Ethereum token issuance continues inflationary, deflationary swing
Three months since the Merge, net token supply issuance has been majority inflationary due to low network usage being a factor to the rate of burn.
Cover art/illustration via CryptoSlate. Image includes combined content which may include the use of AI tools.
After years in the making, the Merge was finalized on Sept. 15, switching Ethereum from Proof-of-Work (PoW) to Proof-of-Stake (PoS).
The roll-out enacted several benefits, including cutting the chain's energy consumption by a reported 99% and setting the groundwork for sharding to improve scaling in a future hard fork.
The Merge also picked up with EIP 1559, which rolled out with the London hard fork in August 2021. This introduced a simplification of Ethereum's fee market mechanism, including breaking fees into base fees and tips, then burning the base fee.
Under a PoS mechanism post-Merge, burning base fees were sold as a deflationary mechanism that would cut token issuance by as much as 88%.
CryptoSlate analyzed Glassnode data to assess whether the claims hold up. Net supply issuance has not been consistently deflationary in the three months since the Merge.
Ethereum deflation fluctuates
According to Ethereum, under the previous PoW system, miners were issued around 13,000 ETH per day in block mining rewards. Now, post-Merge, stakers receive around 1,700 ETH in daily rewards – this equates to an 87% reduction in issuance.
However, with the advent of base fee burns, the scope for a daily net reduction in supply is enabled. Base fee burns depend on network usage. The busier the network on a given day, the more base fees are burnt.
The minimum activity figure for burned base fees to exceed 1,700 ETH, therefore leading to a net decrease in supply, is around 16 Gwei a day.
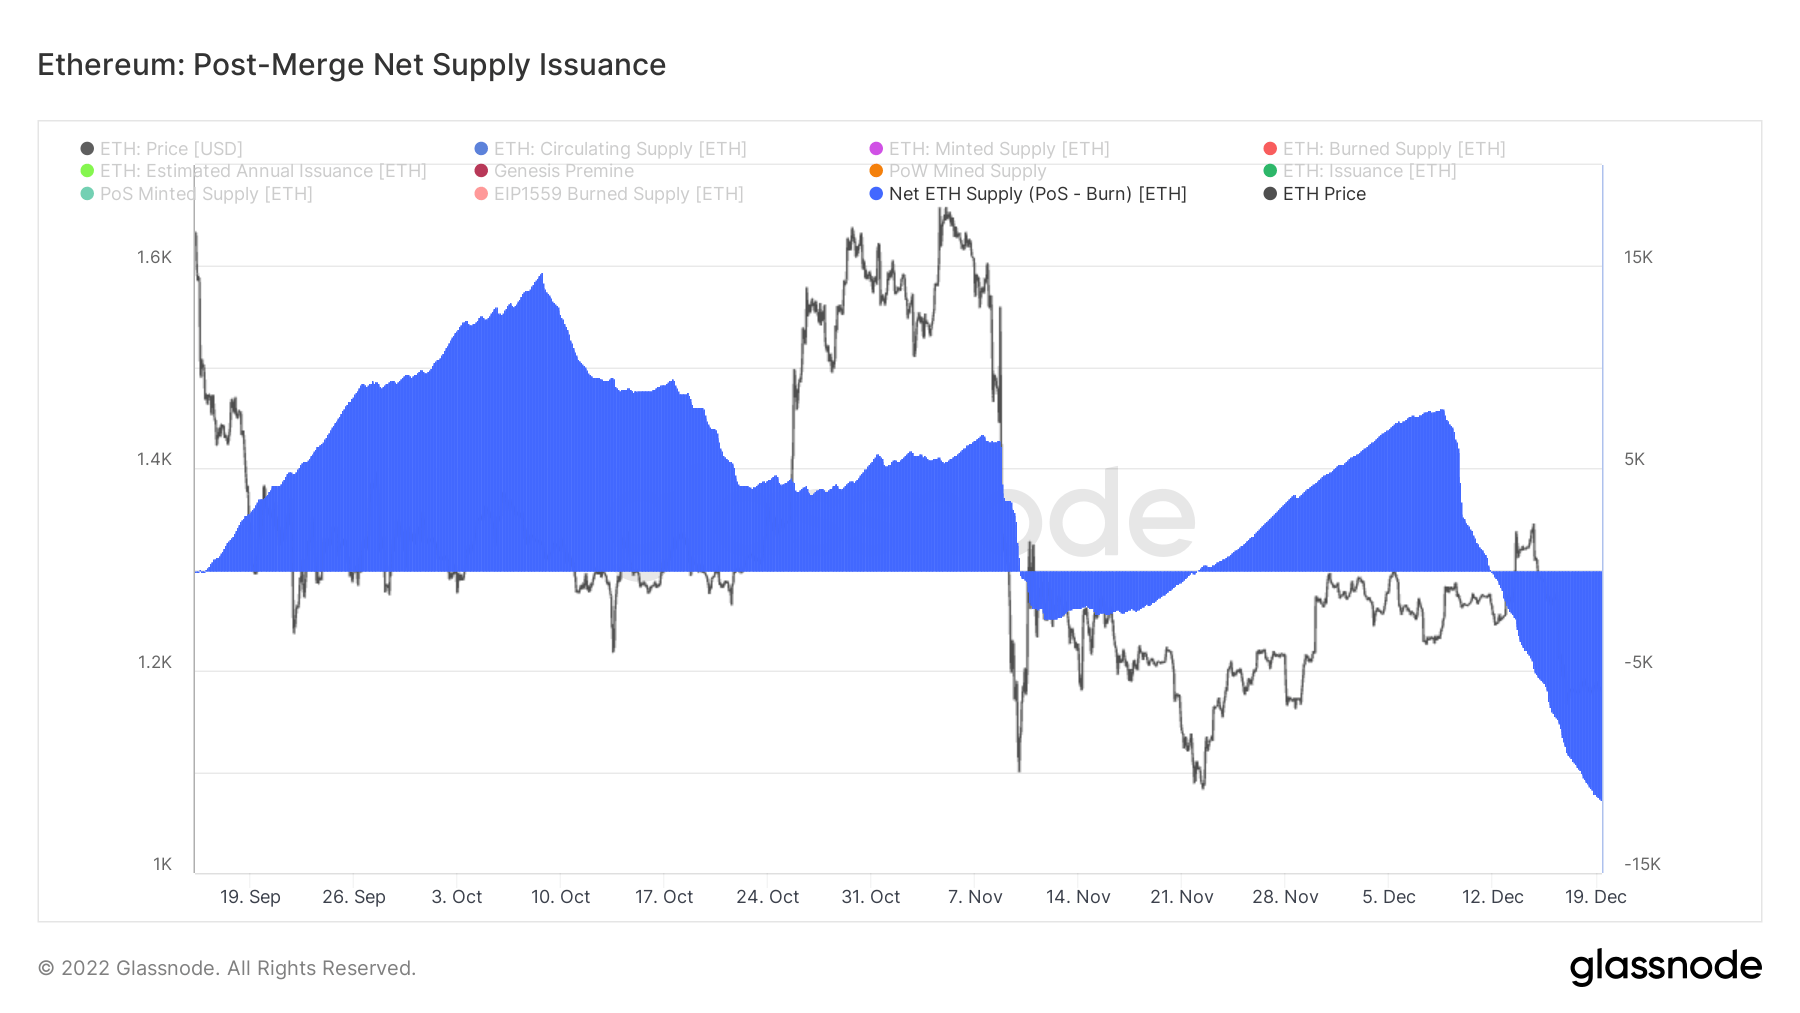
The chart below shows that net supply issuance was inflationary immediately after the Merge until Nov.9, hitting a high of 15,000 tokens in early October.
Following an approximate two-week deflationary stint from Nov. 10, net supply issuance flipped to inflationary once more before returning to a net negative supply issuance from Dec. 12 onwards, sinking to a new low of -11,000 tokens on Dec. 19.
To date, periods of supply inflation exceed supply deflation.
Net Inflation Rate
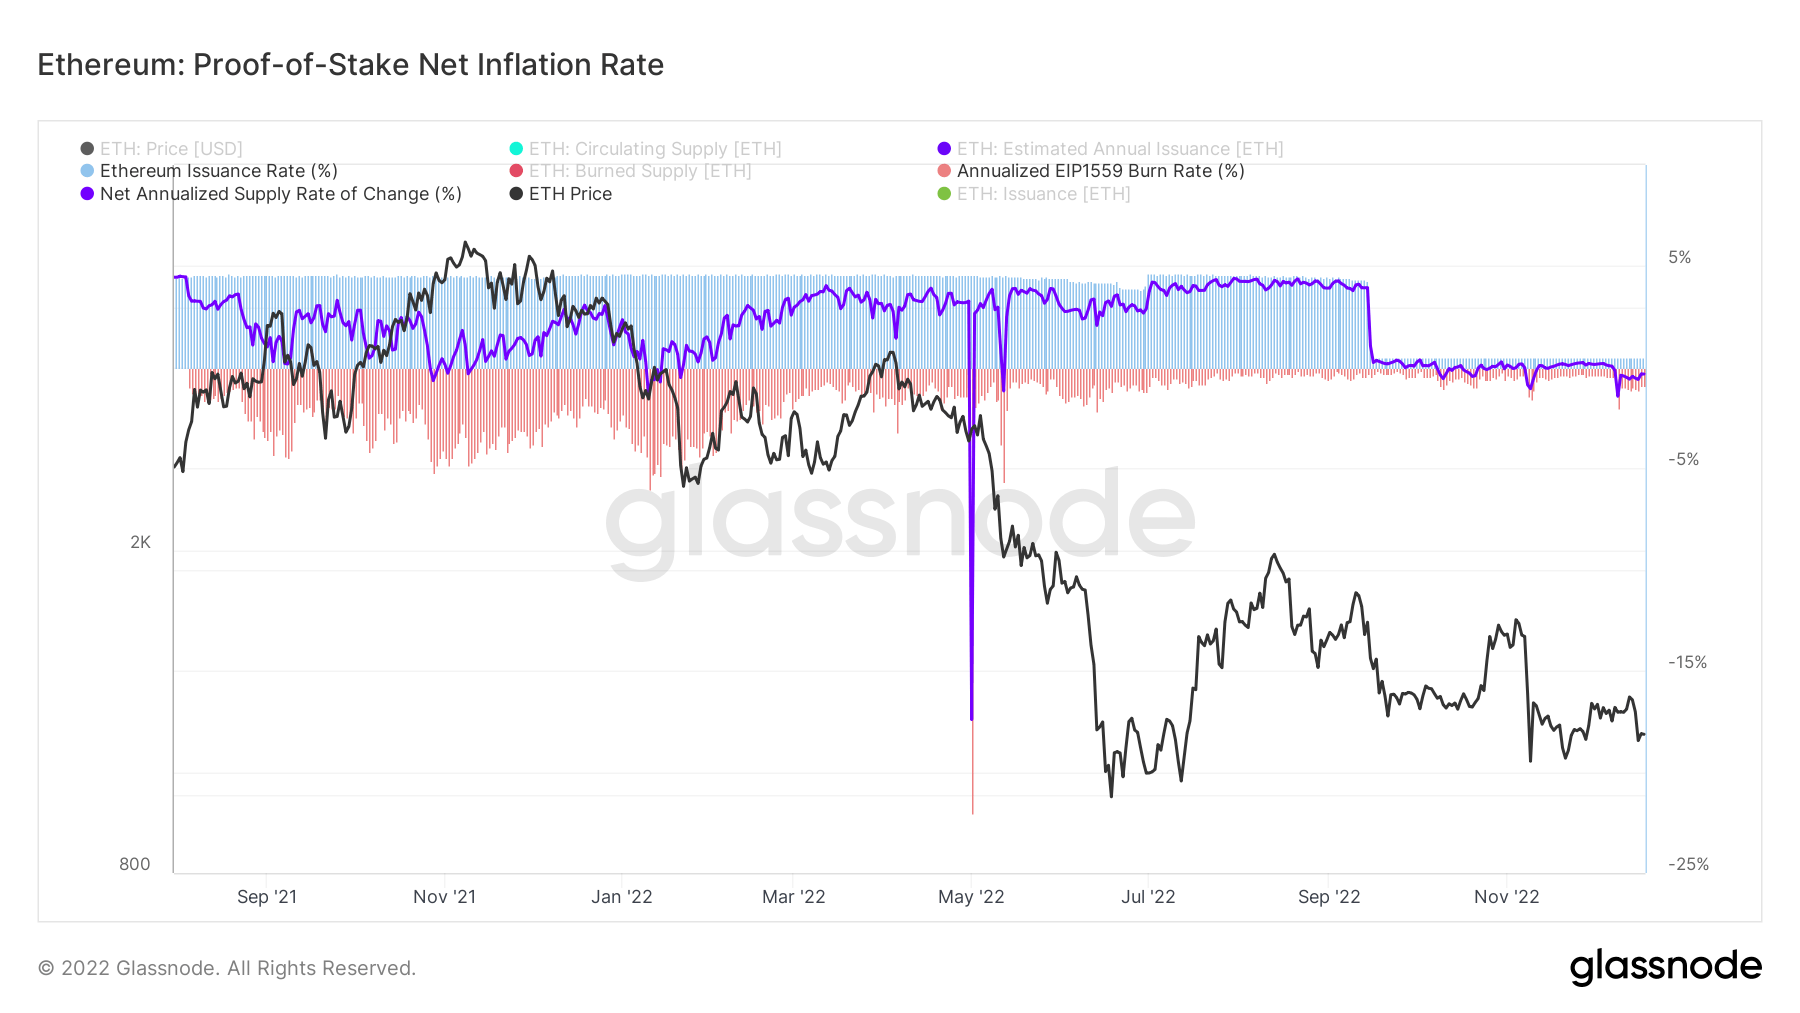
The chart below shows the issuance rate and burn rate dropping post-Merge, with the former metric decreasing significantly after Sept. 15.
Previously, the issuance rate was relatively steady, holding at around 4.1% since October 2021. At the same time, over this period, the burn rate was much more volatile in comparison, peaking at about -5% before declining from August onwards to a rate of 0.35%.
The current issuance rate of 0.5% and burn rate of -0.9% give a net supply change rate of -0.4%.
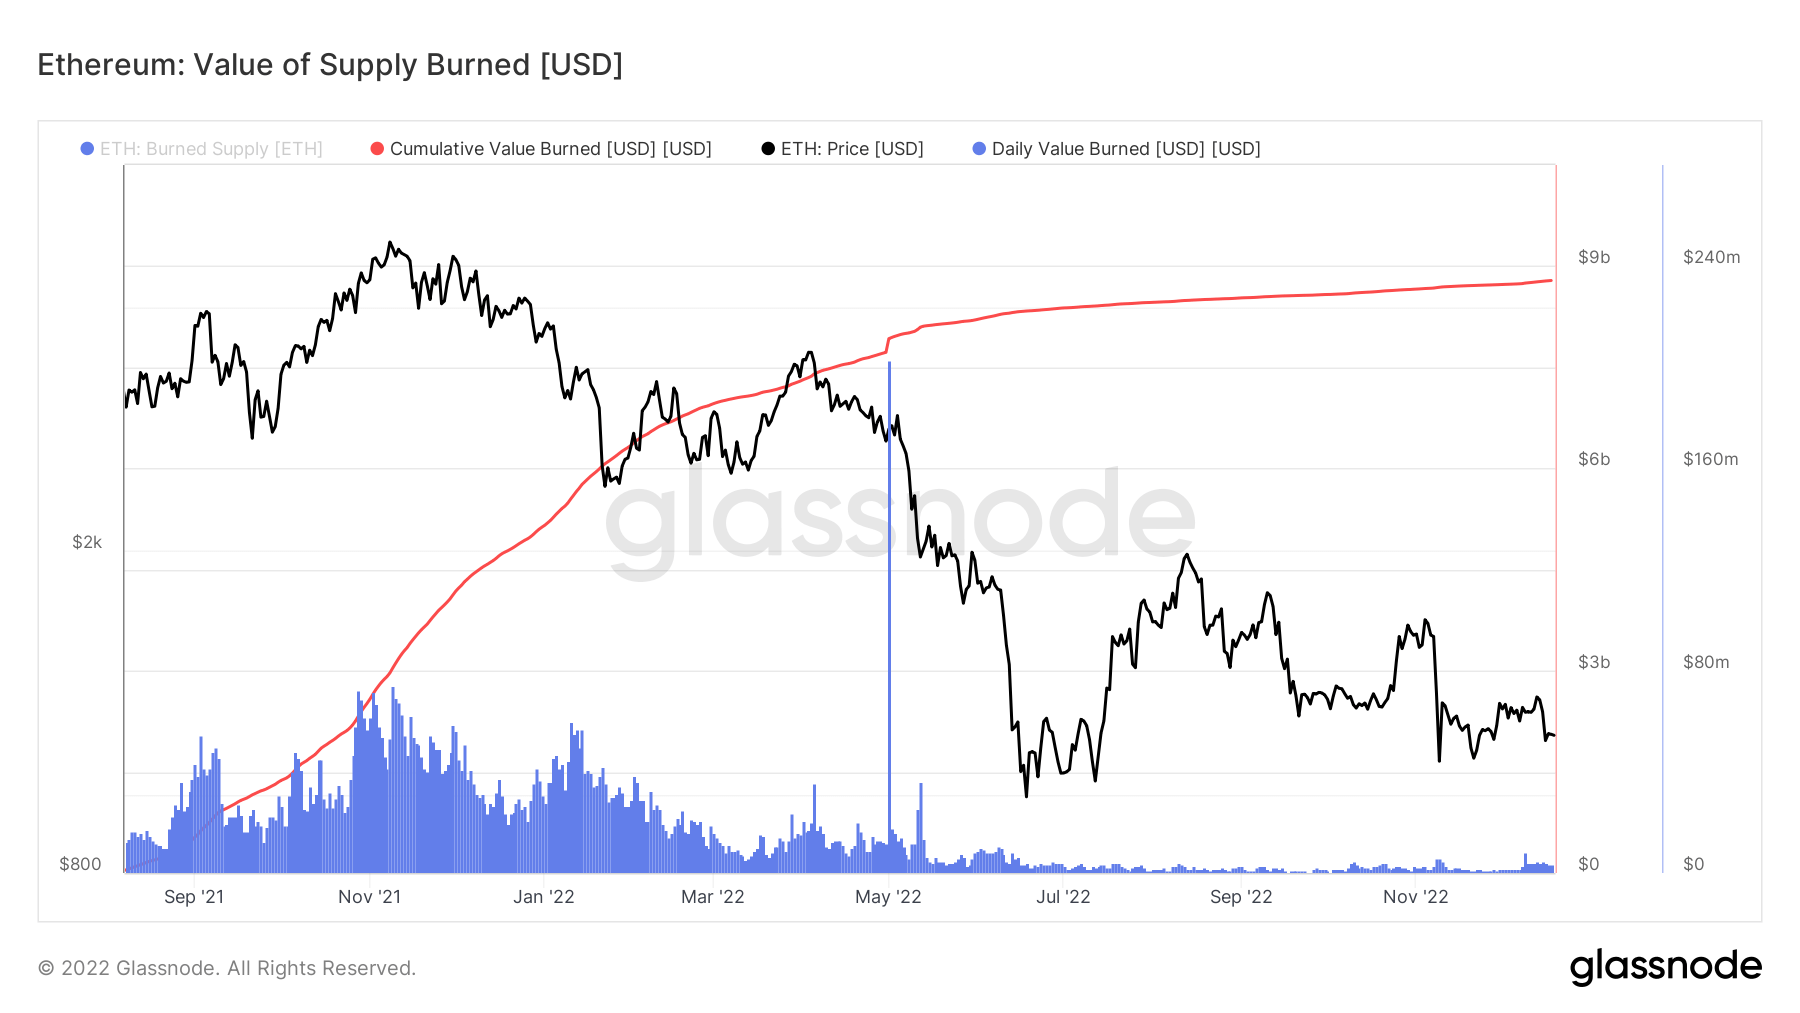
Multiplying the burned base fee by the spot price at the time of burn results in the Value of Supply Burned metric.
Since June 2022, the daily value burned has sunk significantly to approximately $4 million daily. The cumulative sum of all burns to date comes in at just under $9 billion.
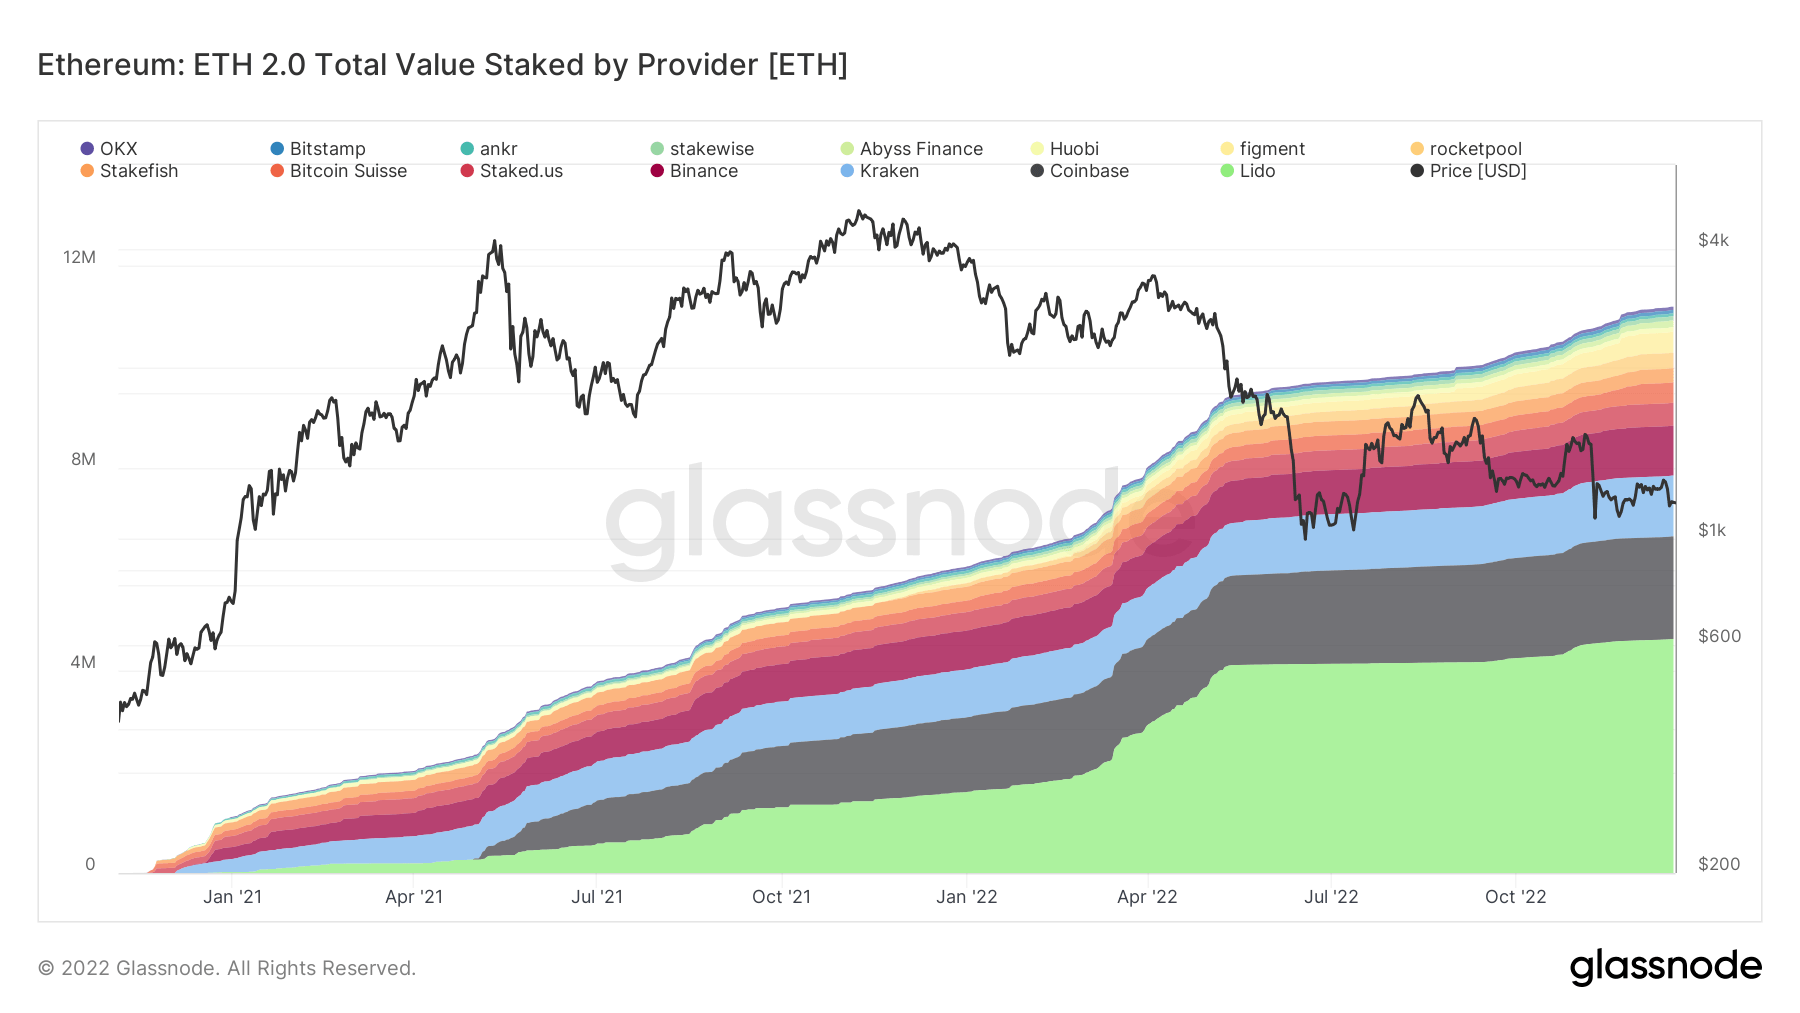
Staking metrics
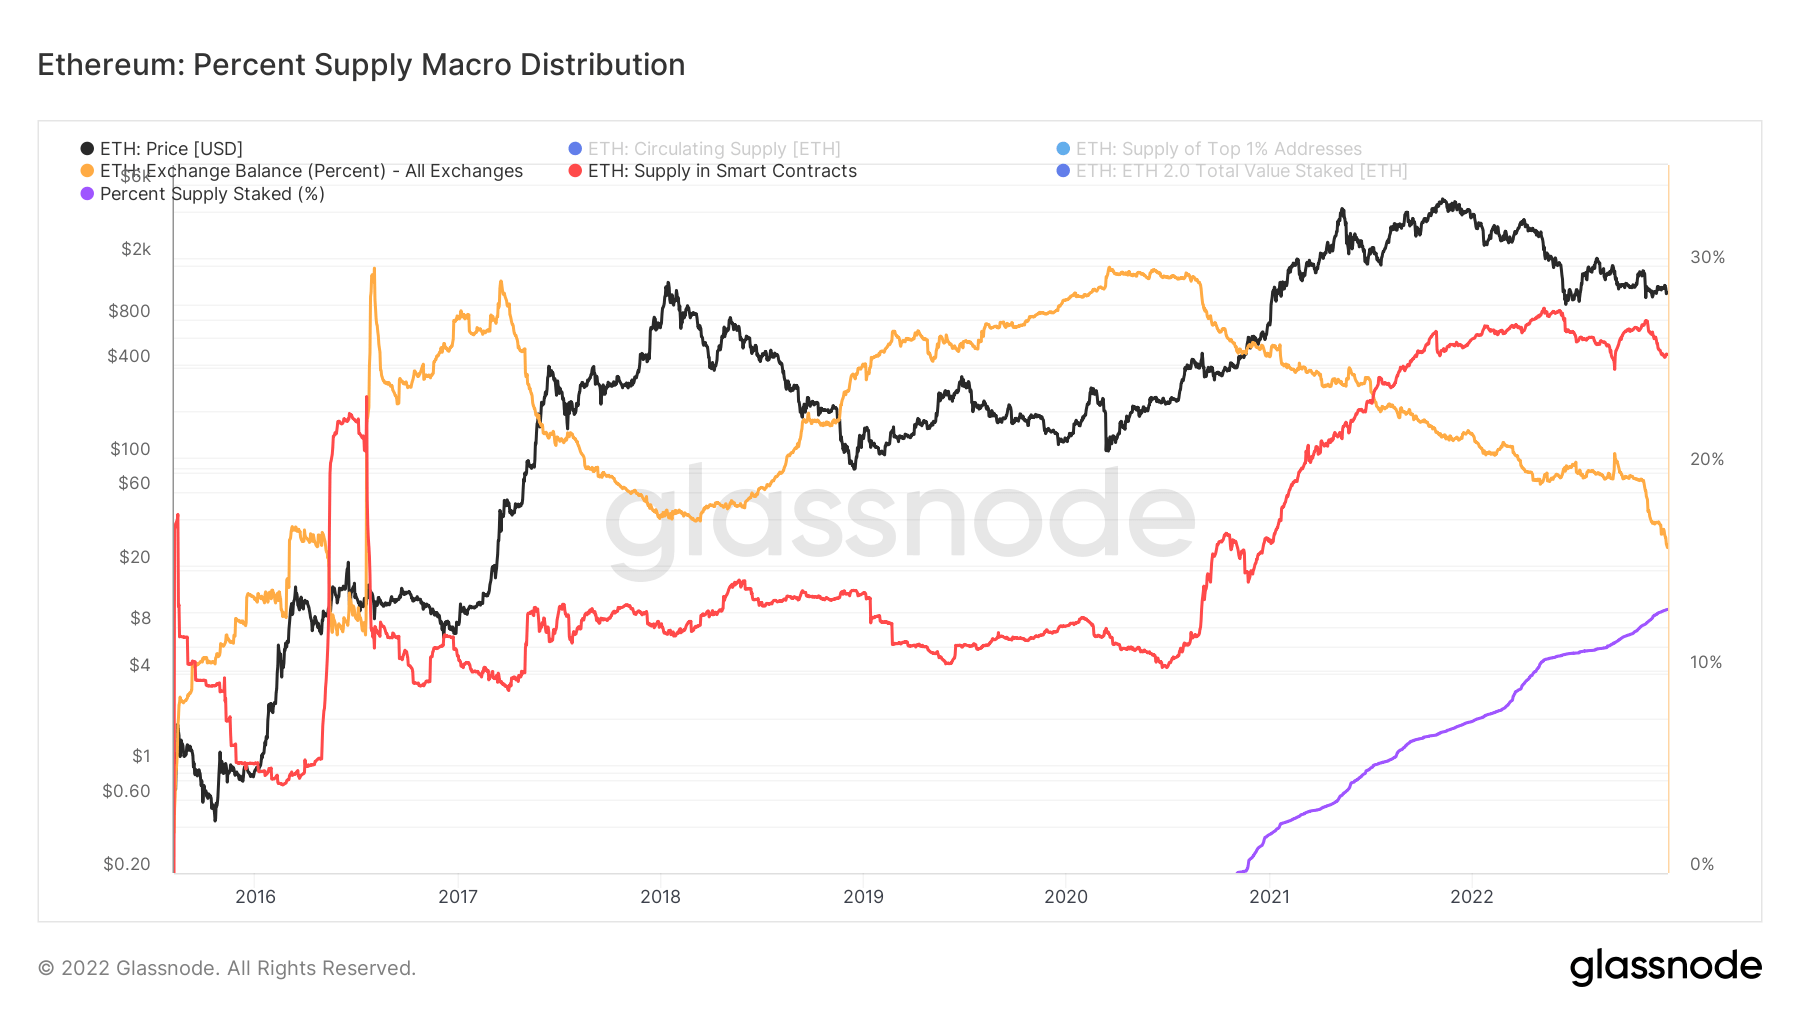
Around 13% of the Ethereum supply is staked. This is significantly less than BNB Chain at 90.2%, Cardano at 71.6%, and Solana at 68.6%.
Currently, staked ETH cannot be unlocked, likely a factor in the relatively low percentage of supply staked versus other large caps. However, once enabled, it is unclear whether this will trigger a mass unstaking of tokens, therefore cutting the issuance of daily ETH staking rewards, or if more tokens will be staked based on being able to move in and out of staking with fewer restrictions.
Since late 2020, the ETH supply on exchanges has fallen from 30% to 16.5%. In contrast, the supply in smart contracts has gone the other way, rising from 15% to 26%—the two cross around mid-2021.
The total number of ETH staked is approaching 12 million. However, the distribution of this is highly concentrated among a few validators as follows:
- Lido – 4.6 million
- Coinbase -2 million
- Kraken – 1.2 million
- Binance – 1 million