 BTC long-term HODLers hit all-time high as Bitcoiners refuse to sell
 BTC long-term HODLers hit all-time high as Bitcoiners refuse to sell
Bitcoiners holding for over 5 years hits all-time high as 2+ year holders also peak

Cover art/illustration via CryptoSlate. Image includes combined content which may include AI-generated content.
Data from Glassnode analyzed by CryptoSlate indicates that long-term Bitcoin holders have hit an all-time high, with a focus on Bitcoin that was previously active 2+ and 5+ years ago.
The cohort of investors from Feb. 2021 is at an average of 66% drawdown from the purchase price, while those who bought in the 2017 bull run are currently in profit. The average price of Bitcoin 2 years ago was around $36,000, and the average price five years ago was $9,500.
Investors who purchased Bitcoin for around $20,000 in 2017 had to endure almost four years of lower prices until Bitcoin finally broke above the 2017 high in early 2021. However, purchases from the height of the 2021 bull run in November have seen falling prices ever since.
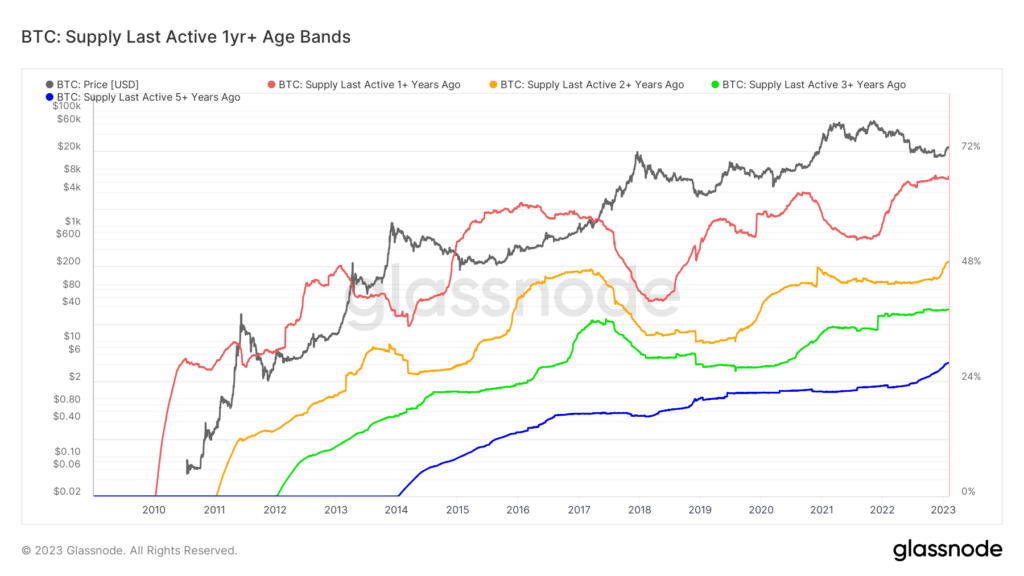
The chart below highlights the Bitcoin supply that was last active at set age bands from 1 to 5 years. The red line indicates the percentage of Bitcoin’s supply that was last active over one year ago, while the blue line depicts Bitcoin that has not moved in over five years.

Bitcoin, which was last active over five years ago, has reached an all-time high of 28% supply of the total available Bitcoin. The 5+ year supply has seen consistent growth since records began in 2014. However, between 2016 and 2018, and 2020 and 2021, the supply plateaued somewhat. Since mid-2021, the 5+ year supply has expanded rapidly.
Further, the Bitcoin that was last active over 2+ years ago has broken 48% of the total supply for the first time. The 2+ year supply last peaked in 2017 before it fell to around 30% from a high of 47%. The sharp increase in the percentage of Bitcoin that hasn’t moved in 2+ years is growing at the fastest rate in history, indicating strong resolve within the cohort.
The data also confirms that around 36% of all Bitcoin changed hands within the last 12 months. The remaining 64% has not moved since Bitcoin was at $38,000.
Bitcoin Market Data
At the time of press 6:30 pm UTC on Feb. 5, 2023, Bitcoin is ranked #1 by market cap and the price is down 2.23% over the past 24 hours. Bitcoin has a market capitalization of $441.87 billion with a 24-hour trading volume of $18.21 billion. Learn more about Bitcoin ›
Crypto Market Summary
At the time of press 6:30 pm UTC on Feb. 5, 2023, the total crypto market is valued at at $1.06 trillion with a 24-hour volume of $46.45 billion. Bitcoin dominance is currently at 41.63%. Learn more about the crypto market ›


