Top 5 altcoins: Ethereum, XRP, Bitcoin Cash, Litecoin, EOS technical analysis

Cover art/illustration via CryptoSlate. Image includes combined content which may include the use of AI tools.
Even though bitcoin seems to be poised to pullback on a weekly scale, some of the altcoins could enjoy a spike in their volume taking them to new yearly highs.
Ethereum
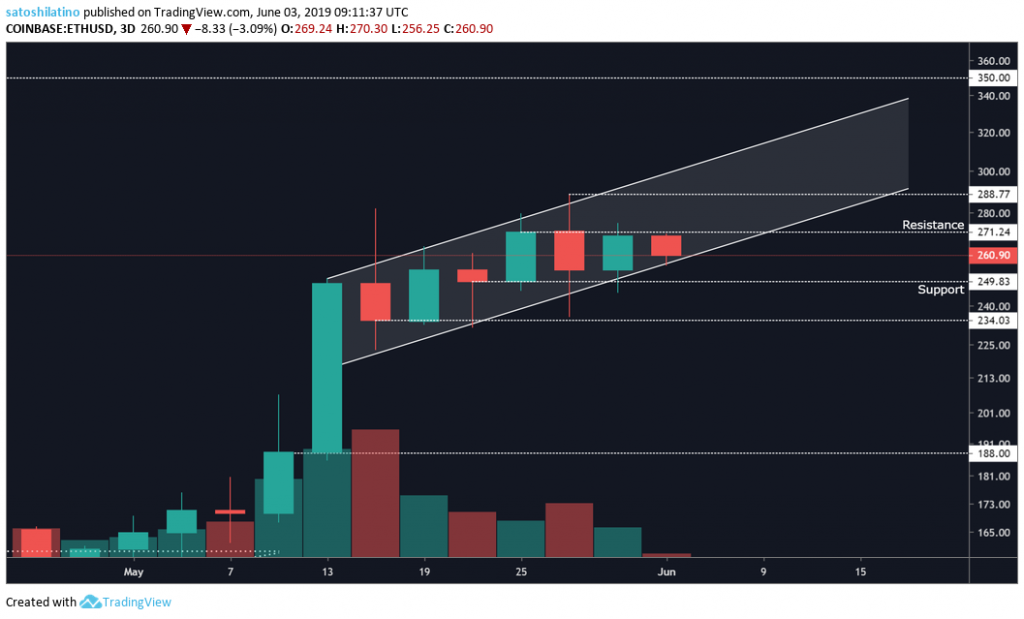
Since ethereum hit a low of $80 in Dec. 14, 2018, it has gone through a bull rally that has taken its market valuation up more than 250 percent, to reach a high of $289 on May 30.
During the last few weeks, ETH has been trading inside an ascending parallel channel on the 3-day chart. Now that ethereum is sitting on the bottom of the channel, there could be a chance that it will break it down. A break below the channel could initiate a correction that could see this cryptocurrency’s price drop 25 percent.
A move below the $250 support level could be used as the first sign of confirmation for a potential pullback and the probabilities will increase if the $234 support level is broken.
Nonetheless, the bullish trend could continue if ethereum is able to trade above $271. A move above resistance could take ETH to test the high of $288 or the top of the parallel channel.
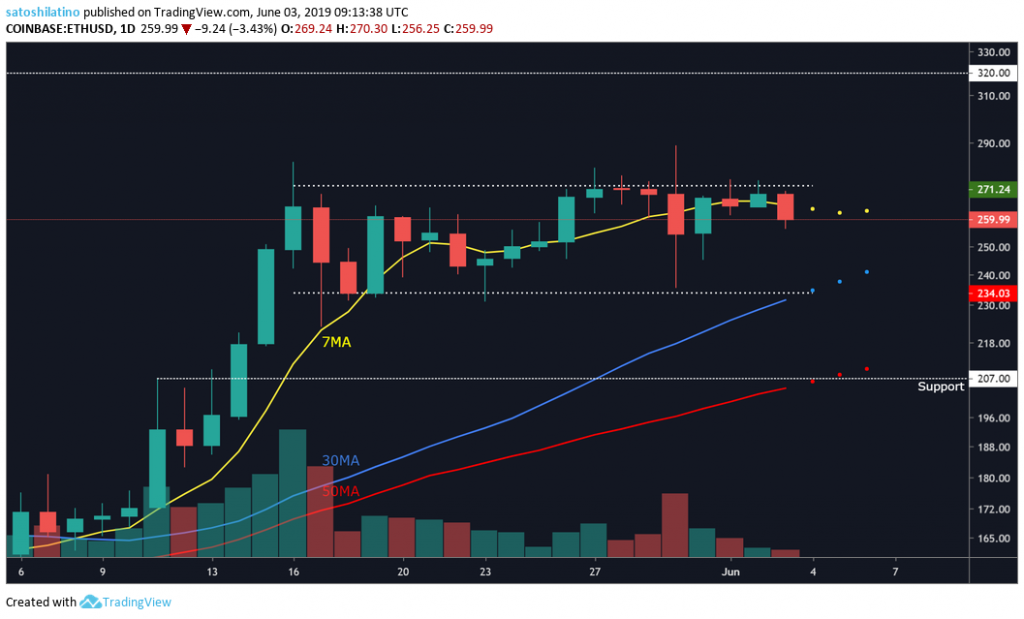
On the 1-day chart, ethereum continues to trade inside a $37 no-trade zone between $271 and $234. Now that it has reached $271 and moved below the 7-day moving average, a drop to $234 could be expected, which is also where the 30-day moving average is sitting. If the 30-day MA is not able to hold ETH’s market valuation it could continue falling and find support around the 50-day MA.
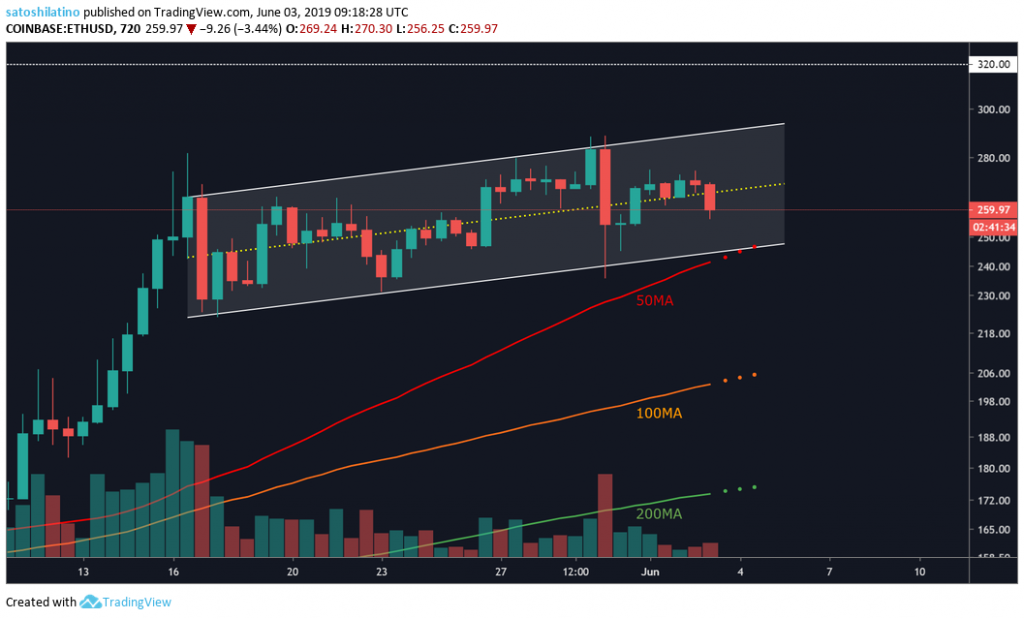
The ascending parallel channel previously mentioned can be better seen on the 12-hour chart. Recently, ethereum dropped from the top of the channel all the way to the bottom where it could bounce off to the middle of the channel.
Now, it seems like a new fall to the bottom of the channel could possibly take ETH to test the 50-twelve-hour moving average. A drop below the 50-twelve-hour MA could drop ethereum down to test the 100-twelve-hour MA and if sell pressure is significant enough it could even test the 200-twelve-hour MA.
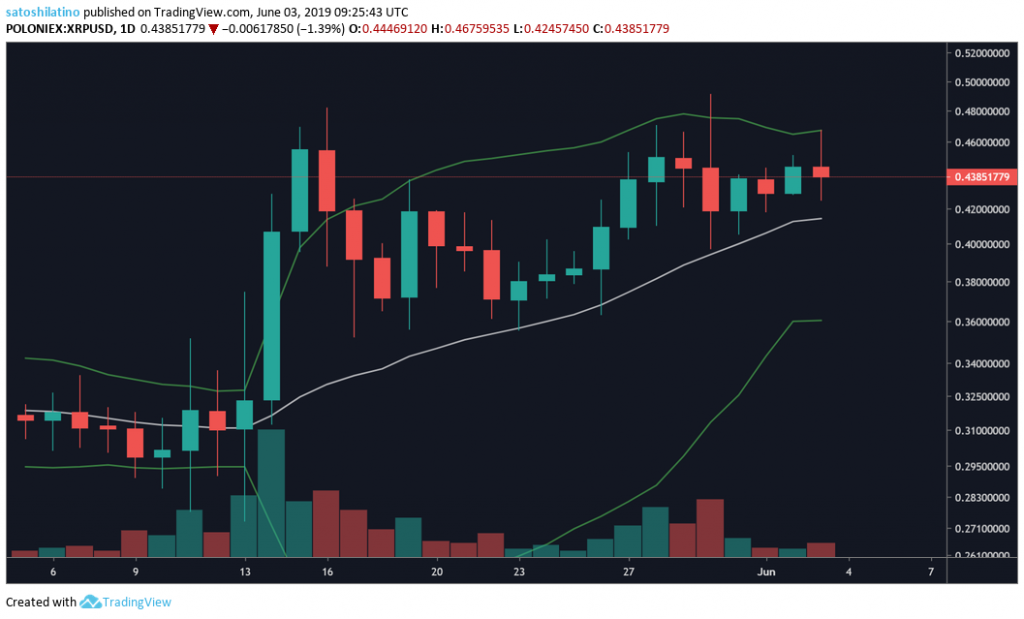
XRP
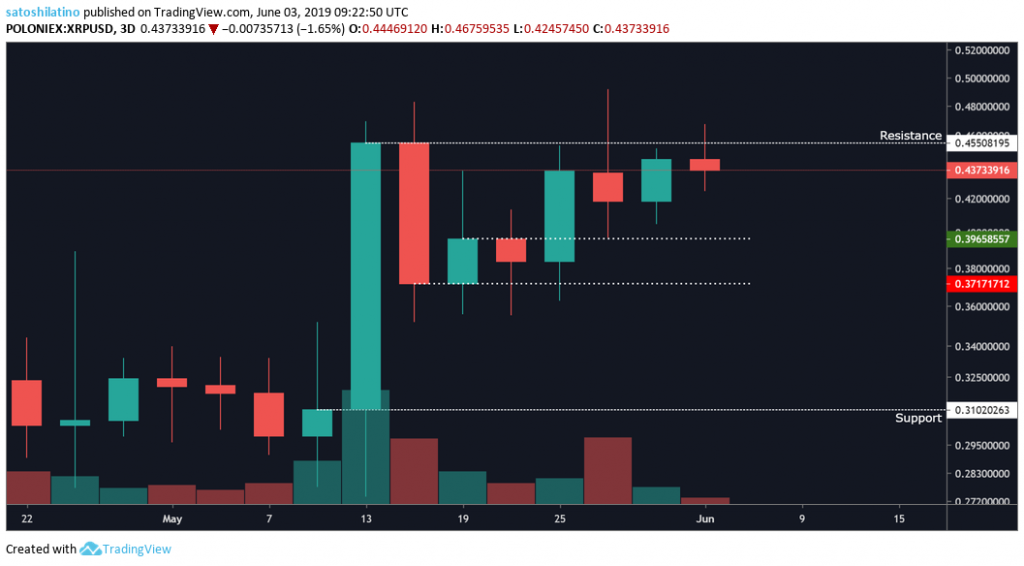
The bullish momentum XRP experienced has been rejected by the $0.45 resistance level multiple times as it can be seen on the 3-day chart. The higher the times a resistance point is tested, the weaker it becomes. A move above $0.45 could take XRP up to the next level of resistance sitting at $0.56.
Conversely, if XRP fails to break above resistance a move down to the $0.4-$0.37 trading range or even lower could be expected.
The Bollinger Bands have begun contracting on the 1-day chart indicating that a period of low volatility could come soon. XRP could still test the upper band, drop to the middle band (20-day MA) or even the lower band.
Even though a bullish impulse above $0.48 could take XRP to the new yearly highs, a pullback to $0.36 is possible.
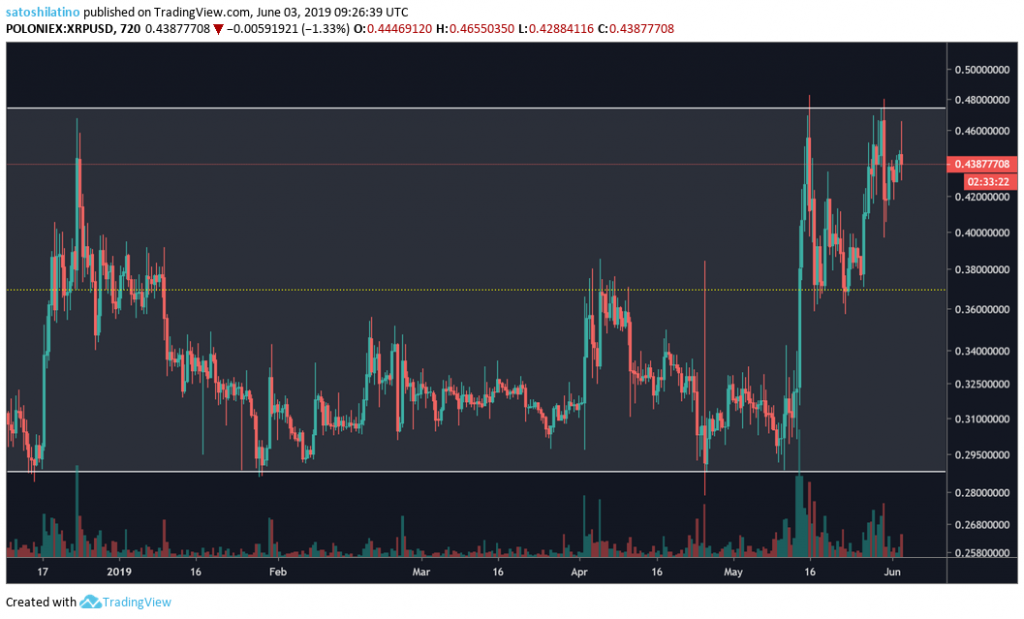
Since Dec. 2018, XRP can be seen trading in a parallel range in the 12-hour chart. Now that it has been trading around the top of the channel a retrace to the middle line, which sits around $0.37, could happen at any minute.
A break out of the parallel channel could take this cryptocurrency to new yearly highs in an extremely bullish movement due to the length of the channel. The $0.48 level is a very important price point to watch.
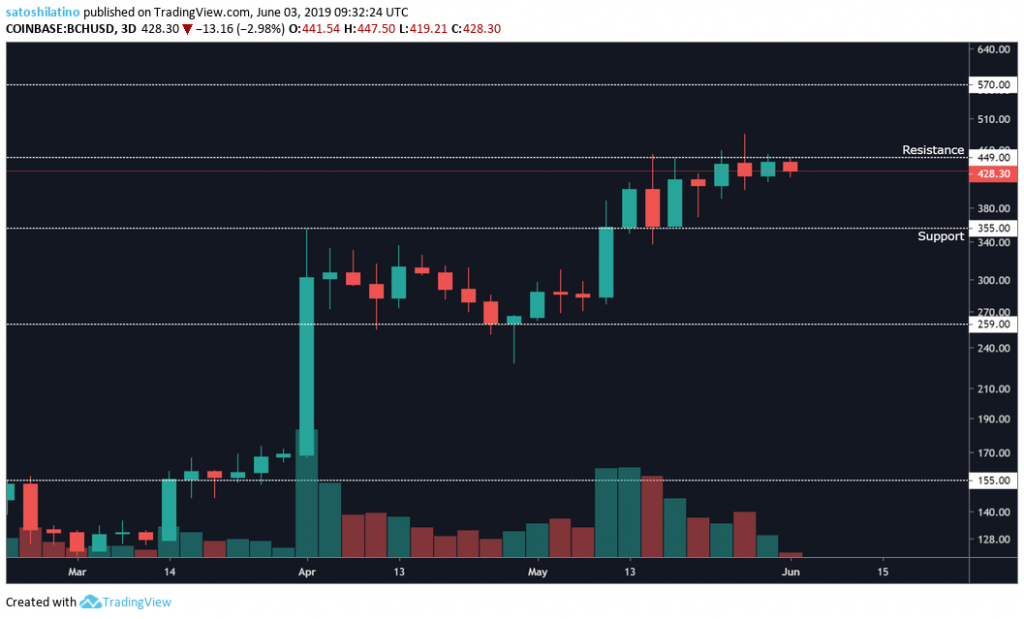
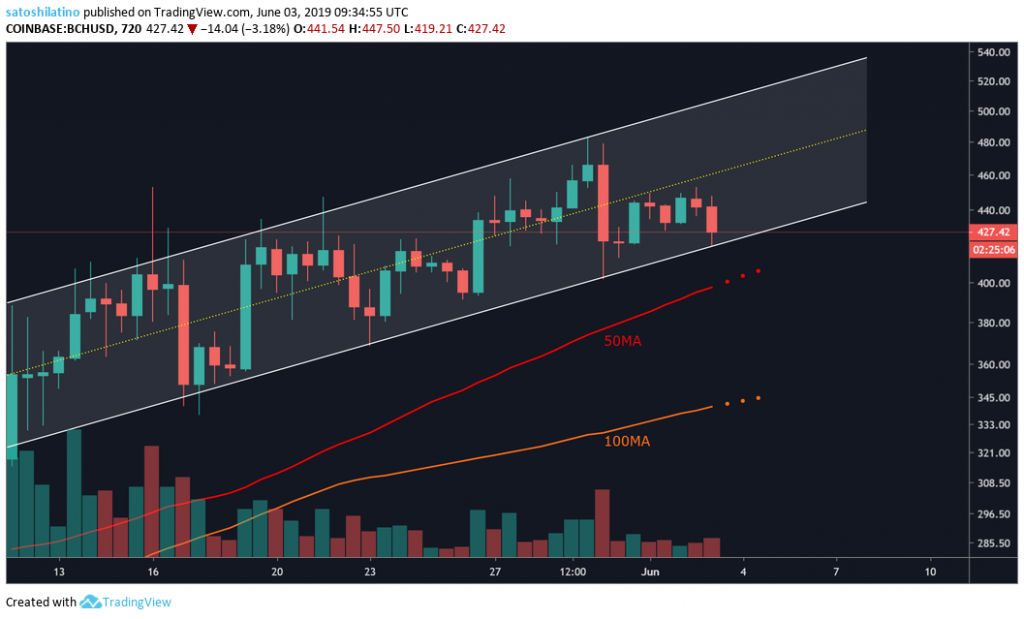
Bitcoin Cash
Bitcoin cash has gone up more than 550 percent since it reached a low of $73 in Dec. 15, 2018.
At the moment, BCH is trading around $430 and testing a significant resistance level that it has not been able to break for the last couple of weeks. A break above this price zone could take this cryptocurrency up to the next resistance level around $570. Failing to break above this resistance point could take bitcoin cash down to $355 based on the 3-day chart.
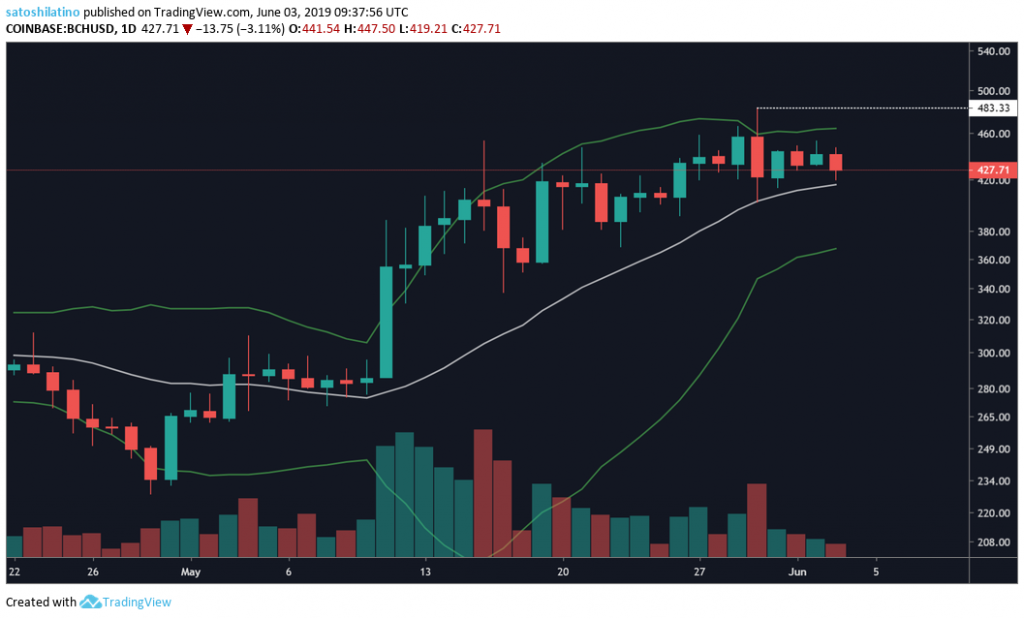
On the 1-day chart, the Bollinger Bands appear to be contracting. At the moment, BCH sits right on the middle band or 20-day moving average. From now on, it could either fall down to the lower band or rise up to the upper band. A break above $483 could take bitcoin cash could indicate that a strong bullish movement will come.
An ascending parallel channel can be spotted on BCH’s 12-hour chart. Bitcoin cash is currently trading on the bottom of the channel, which if it is able to hold could bounce off its market valuation to the middle or the top of the channel.
However, if BCH is able to break the channel to the downside, the likelihood of a drop to the 50-twelve-hour MA or the 100-twelve-hour MA increases.
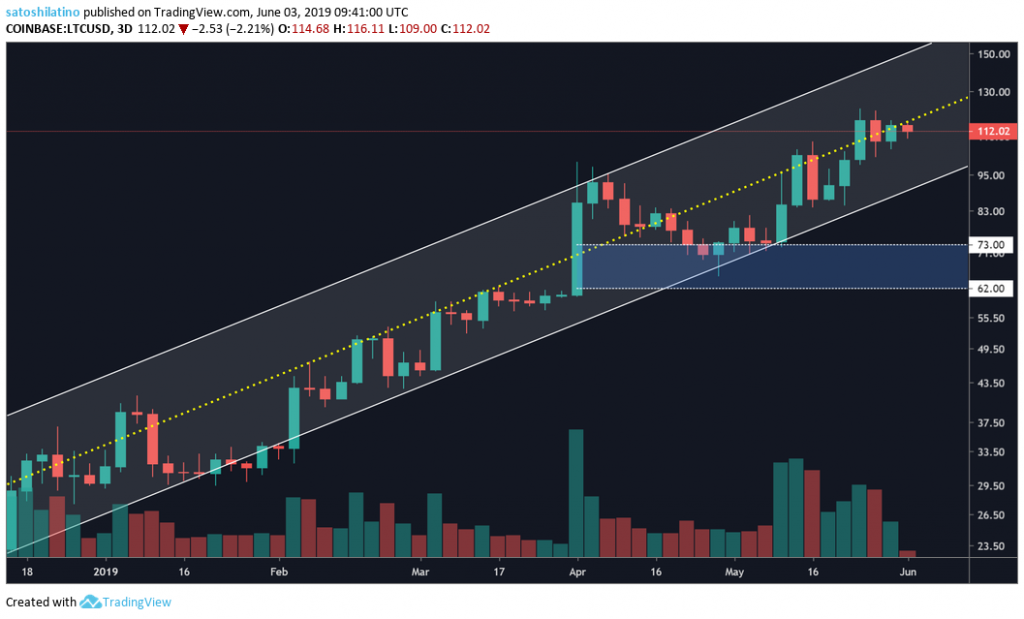
Litecoin
As litecoin’s halving approaches, it continues a steady increase in its market valuation that started on Dec. 2018 and has seen it go up more than 440 percent.
On the 3-day chart, LTC has been trading inside a massive ascending parallel channel. At the moment, this cryptocurrency is at the middle line of the channel and it could continue to rise to the top around $150.
However, if litecoin moves below the middle line, it could go down to the bottom of the ascending parallel channel around $95.
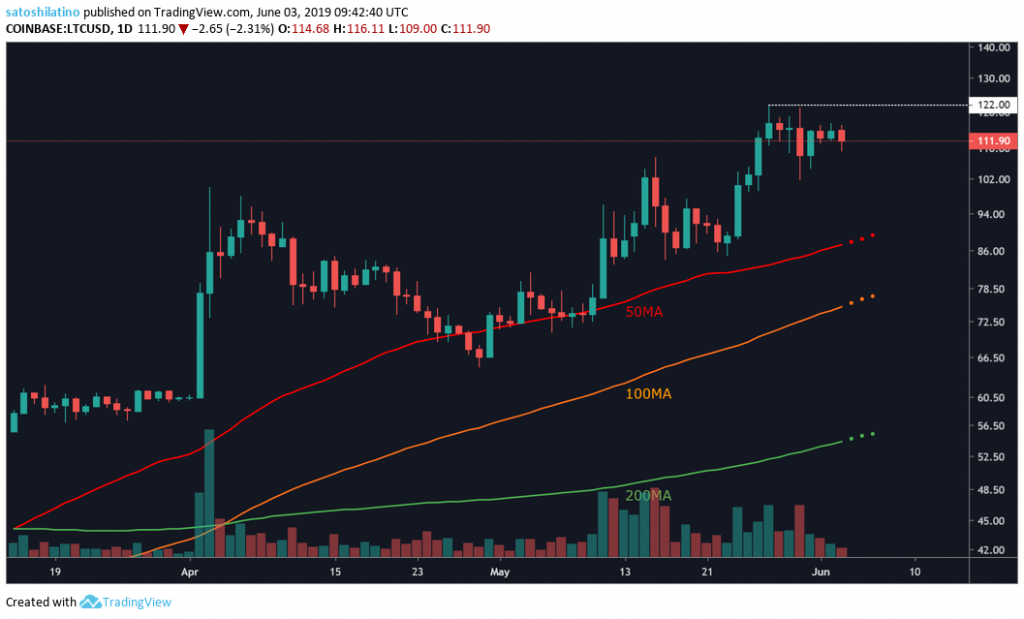
Since the beginning of the year, litecoin can be seen trading above the 50-twelve-hour moving average. The bullish trend will remain as long as LTC continues trading above this moving average, but a correction could be seen if it moves below it. The next levels of support are given by the 100-twelve-hour MA sitting at $75 and the 200-twelve-hour MA at $55.
For the bullish trend to continue litecoin must also trade above $122 to make new yearly highs.
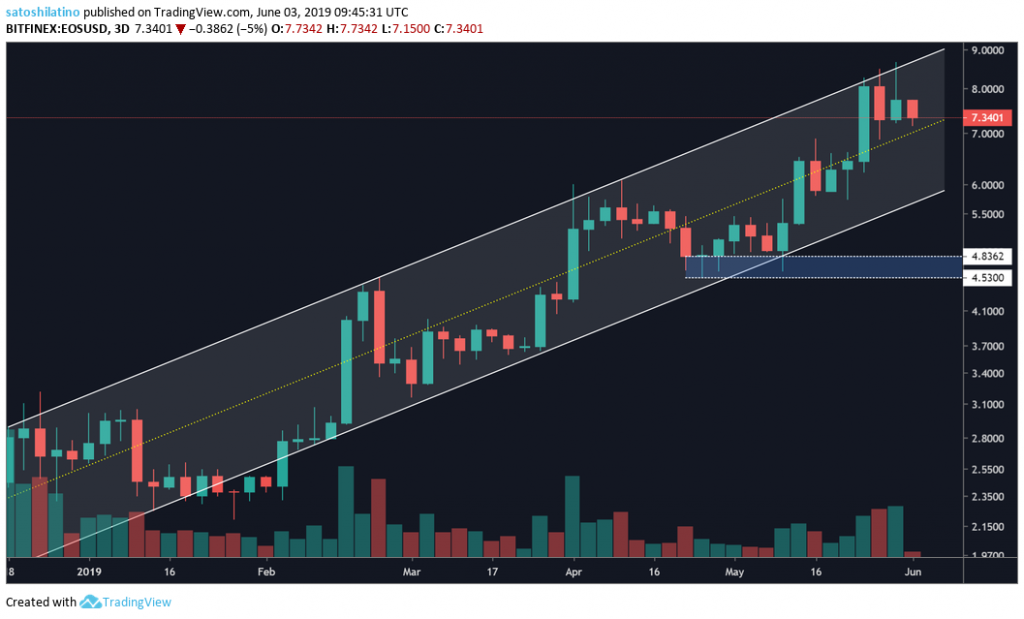
EOS
EOS has recently moved down to the number six spot in market capitalization once again after investors appeared to be taking profits following the Block.one announcement of an EOS-powered social network.
This cryptocurrency can be seen trading inside an ascending parallel channel on the 3-day chart since Dec. 18, 2018, after reaching a low of $1.55. Currently, EOS is sitting right on the middle line of the channel, where a move further down to the bottom or a spike up to the top could be presumed.
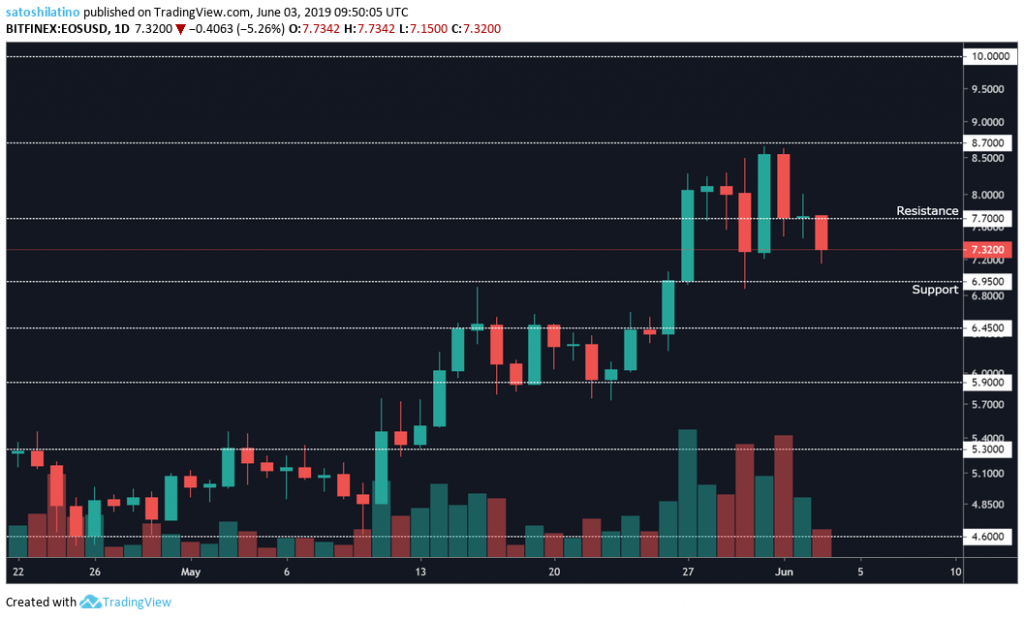
 On the 1-day chart, a series of support and resistance points based on historical data can be drawn to predict the price points that will act as barriers in a bearish or bullish move.
EOS is trading between the $6.95 support and $7.70 resistance levels. A break below this zone could take this cryptocurrency down to $6.45 while a bullish impulse could take it up to $8.70.
Overall Sentiment
Based on this technical analysis of the top altcoins by market capitalization, a correction could come at any minute. Although bitcoin cash and XRP have been trading around significant points of resistance for an extended period of time and a break out could take them to significant new yearly highs, the rest of the cryptocurrencies seem like they could be about to pullback.