Explore CryptoSlate’s Institutional Playbook, a 3-part guide series on exchange due diligence, crypto-as-a-service, and token listing strategy for institutional teams.
Explore CryptoSlate’s Institutional Playbook, a 3-part guide series on exchange due diligence, crypto-as-a-service, and token listing strategy for institutional teams.
Bitcoin 2023 year in review: Analysis of BTC’s key metrics
CryptoSlate's latest market report dives deep into Bitcoin's performance over the past year, analyzing a range of metrics to provide a more objective and comprehensive perspective of its YTD growth.
While on-chain analysis is invaluable for its real-time granularity, it can inadvertently foster a preoccupation with short-term market movements. Zooming out and evaluating Bitcoin’s year-to-date performance allows us to evaluate Bitcoin’s performance over a longer, more significant timeframe.
A year-long analysis shows trends that short-term data may obscure. For instance, it helps identify underlying patterns in investor behavior, market sentiment shifts, and Bitcoin’s long-term value propositions. This broader view is particularly significant in evaluating the impact of macroeconomic factors, such as global monetary policies and economic cycles, on Bitcoin’s market position.
Furthermore, a comprehensive YTD analysis is vital for accurately assessing Bitcoin’s resilience and growth as a digital asset. It enables us to quantify and understand key metrics such as price volatility, market capitalization changes, and the evolution of network health indicators like hash rate and transaction volume. This approach provides a more objective and comprehensive perspective.
In this report, CryptoSlate dives deep into Bitcoin’s performance over the past year, analyzing a range of metrics. These include price dynamics, market capitalization, on-chain data like address growth and accumulation patterns, and derivatives market development. Our goal is to offer a detailed view of the year Bitcoin has had, shedding light on its performance and providing a grounded basis for future projections and analysis.
Price and market cap
Price and market cap
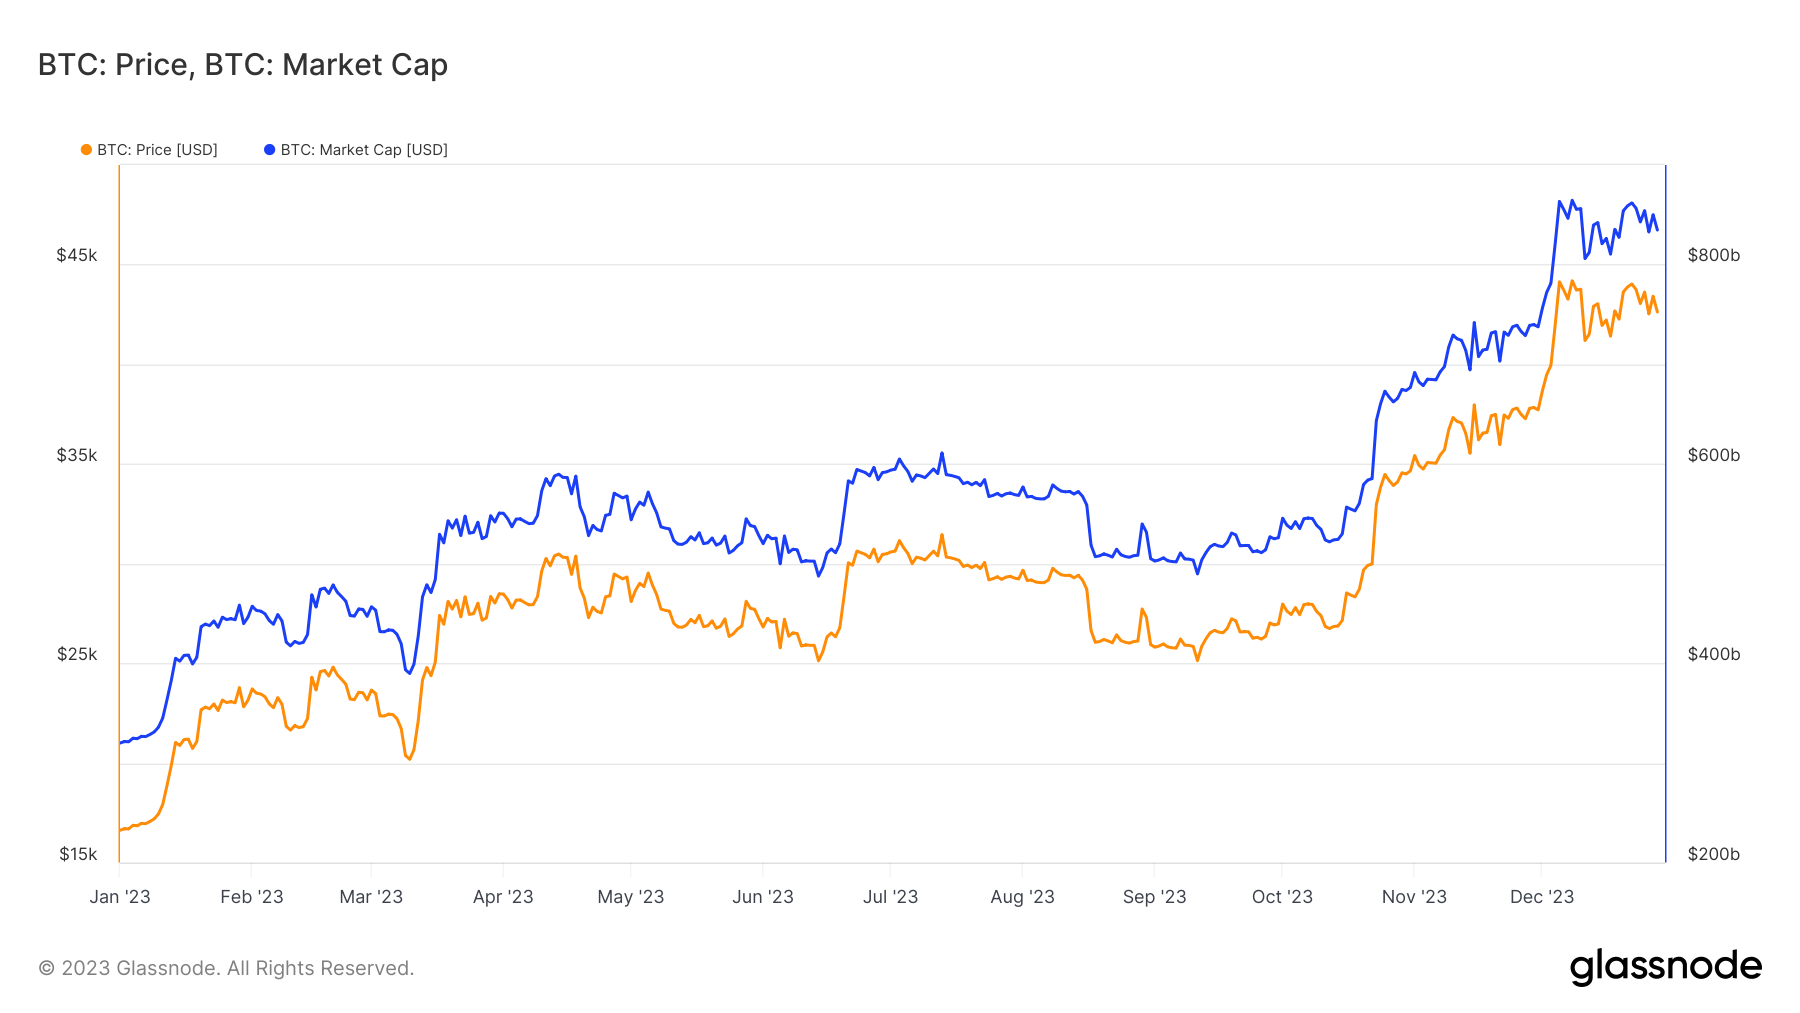
Starting the year at $16,620, Bitcoin’s price experienced a substantial increase, closing at $42,624 on Dec. 28. This represents a YTD increase of approximately 156.49%.
Market capitalization, a key indicator of the total value of Bitcoin in circulation, started at $319.94 billion and escalated to $834.73 billion by the end of the year. increasing by about160.90% YTD. The rise in market capitalization not only reflects the increase in Bitcoin’s price but also underscores its growing prominence and acceptance in the global financial ecosystem.
Graph showing Bitcoin’s price and market capitalization in 2023 (Source: Glassnode)
Realized price and realized cap
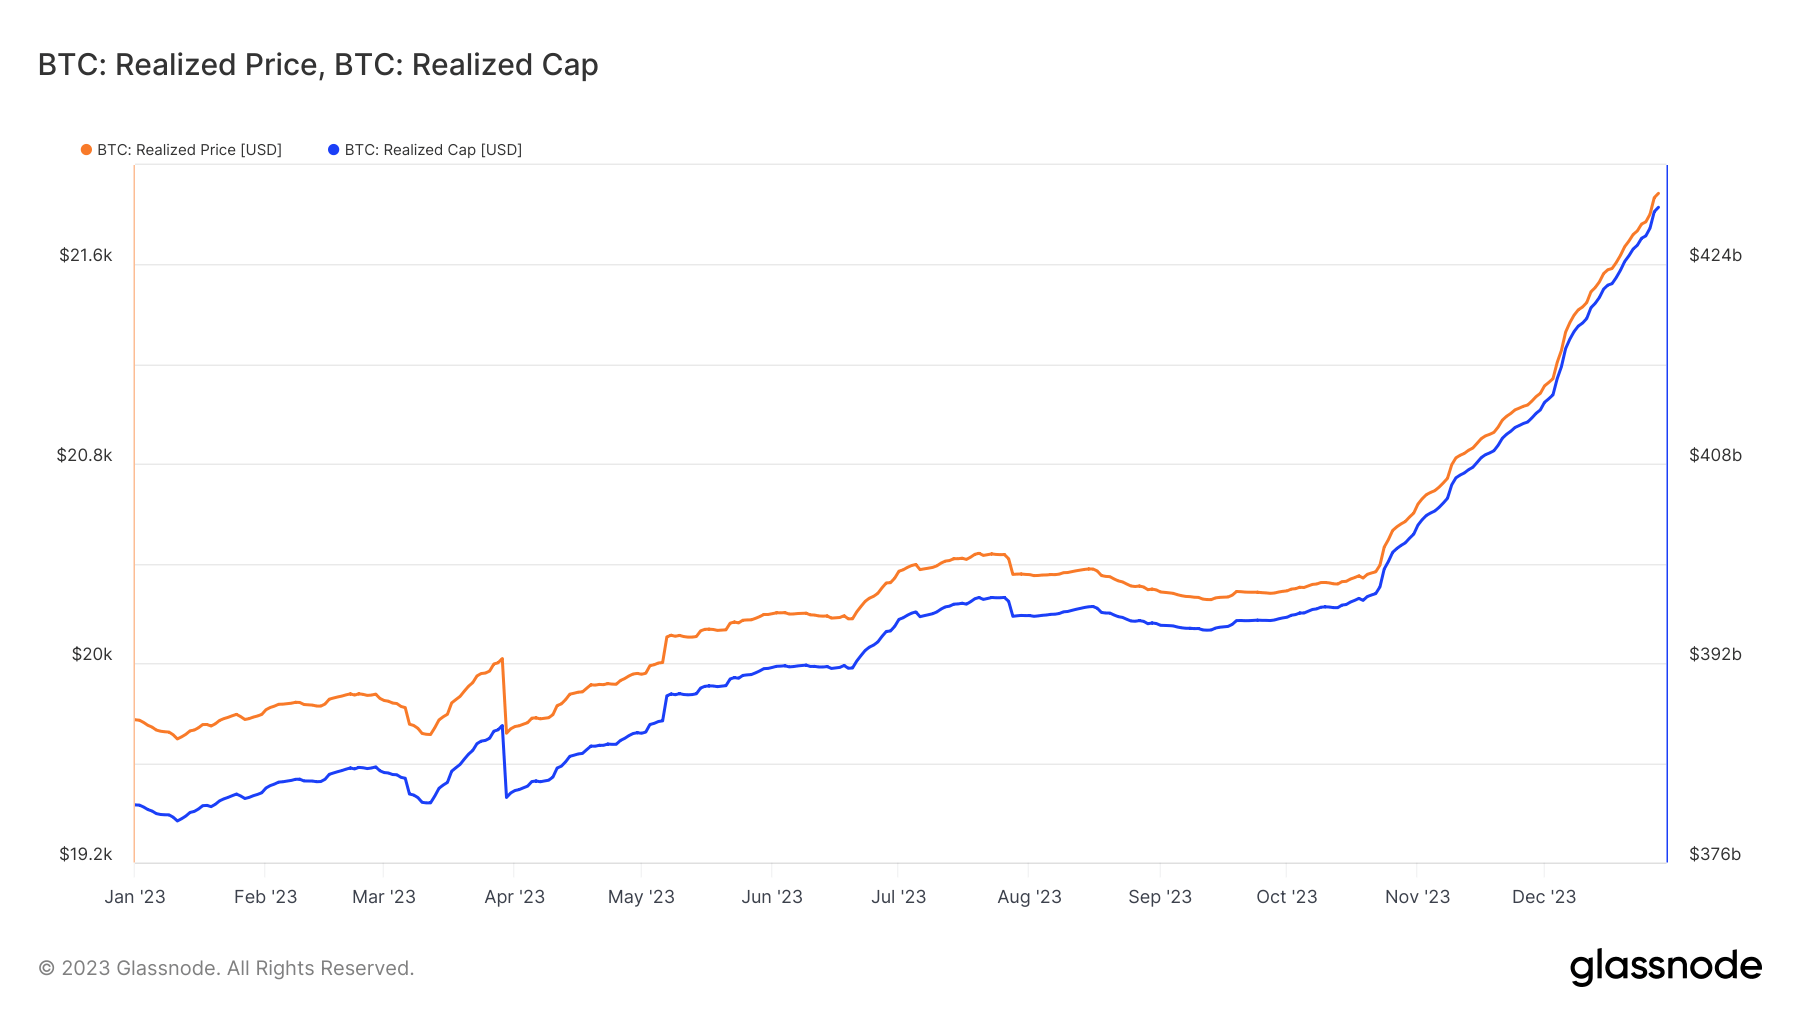
While the market price is the current trading price, the realized price represents the average price at which each Bitcoin last moved, adjusted for lost coins and long-term holdings. The realized price increased from $19,772 to $21,886, marking a YTD growth of about 10.71%. This increase in the realized price suggests a healthy underlying market where long-term holders are seeing an appreciation in their holdings.
Graph showing Bitcoin’s realized price and realized market capitalization in 2023 (Source: Glassnode)
Realized capitalization differs from market capitalization as it multiplies each unit of Bitcoin by the price at which it was last moved, offering a more precise picture of the economic weight behind Bitcoin. The realized cap increased from $380.62 billion to $428.60 billion, a growth of 12.60% YTD. Though more modest than the market cap, this increase in the realized cap is significant as it reflects the increased economic value stored in the Bitcoin network beyond just speculative trading.
Balances and supply
Addresses with non-zero balances
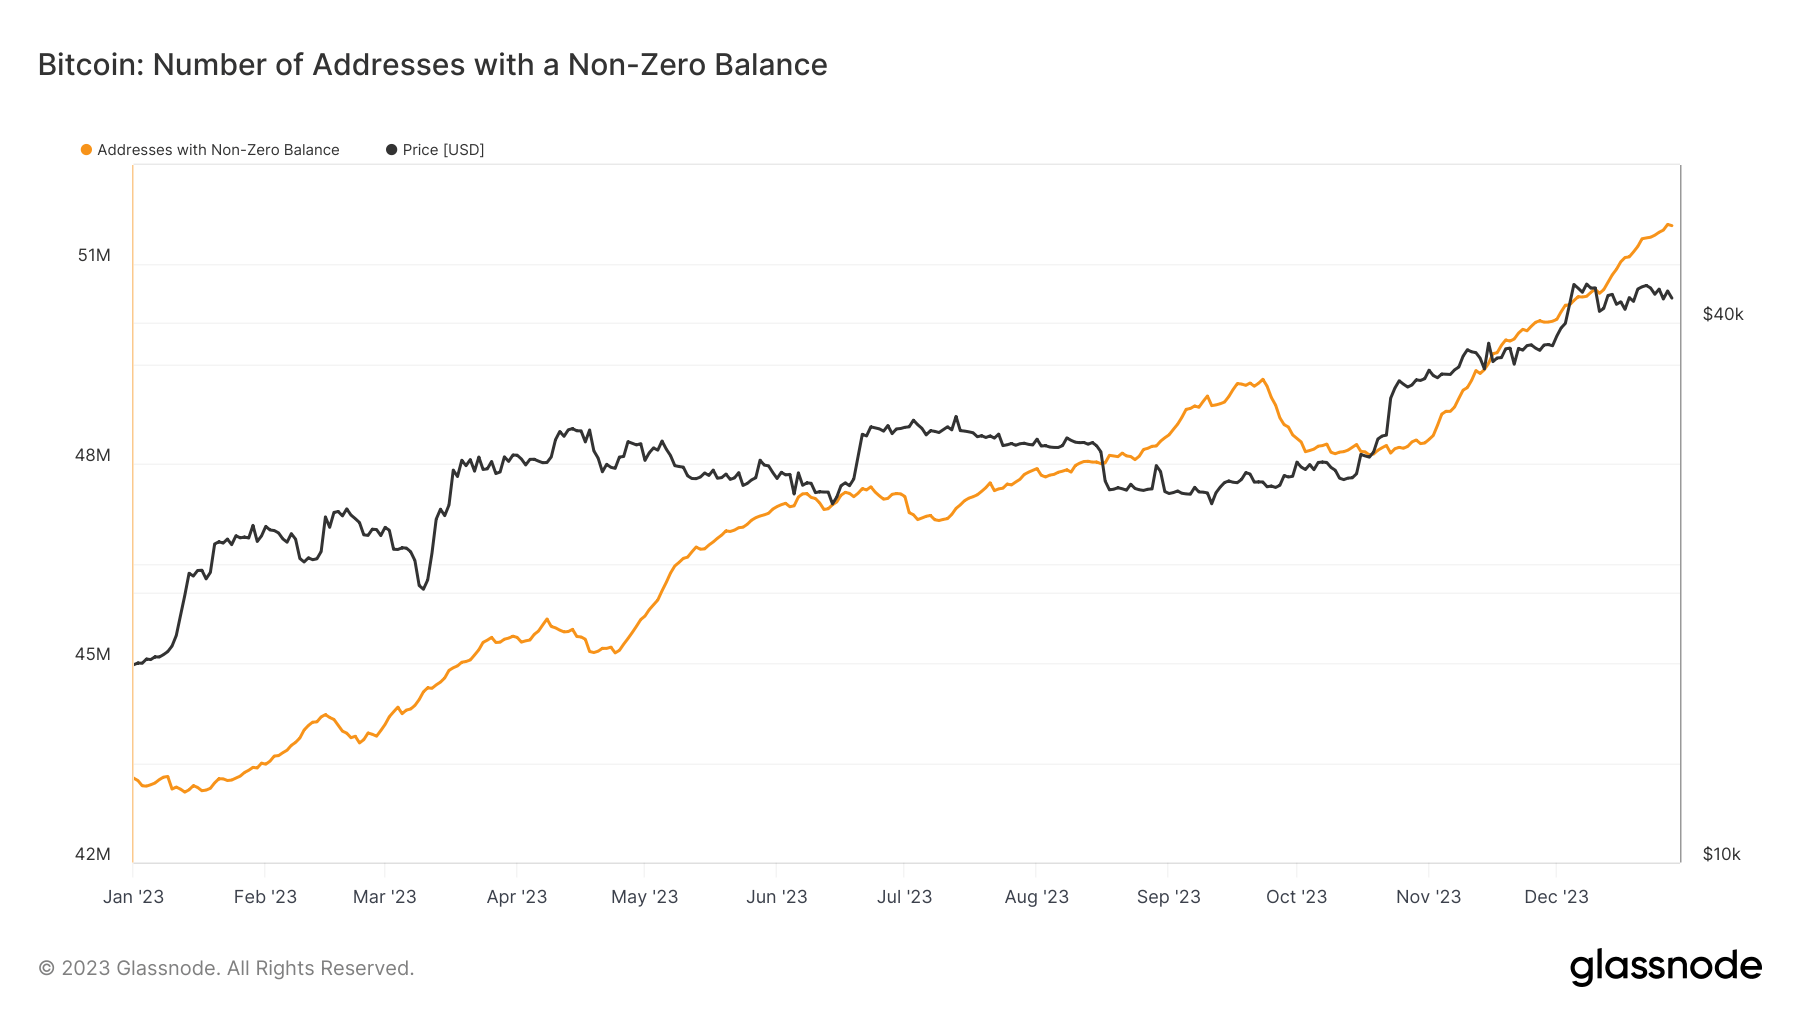
This metric tracks the total number of unique Bitcoin addresses holding any amount of Bitcoin. As of Jan. 1, there were 43.26 million such addresses, which increased to 51.58 million by Dec. 28. This significant increase of 19.23% suggests a broadening of Bitcoin’s user base. A growth in addresses with non-zero balances typically indicates heightened retail interest and adoption as more participants enter the market and hold Bitcoin.
Graph showing the number of Bitcoin addresses with a non-zero balance in 2023 (Source: Glassnode)
Addresses with a balance over 1 BTC
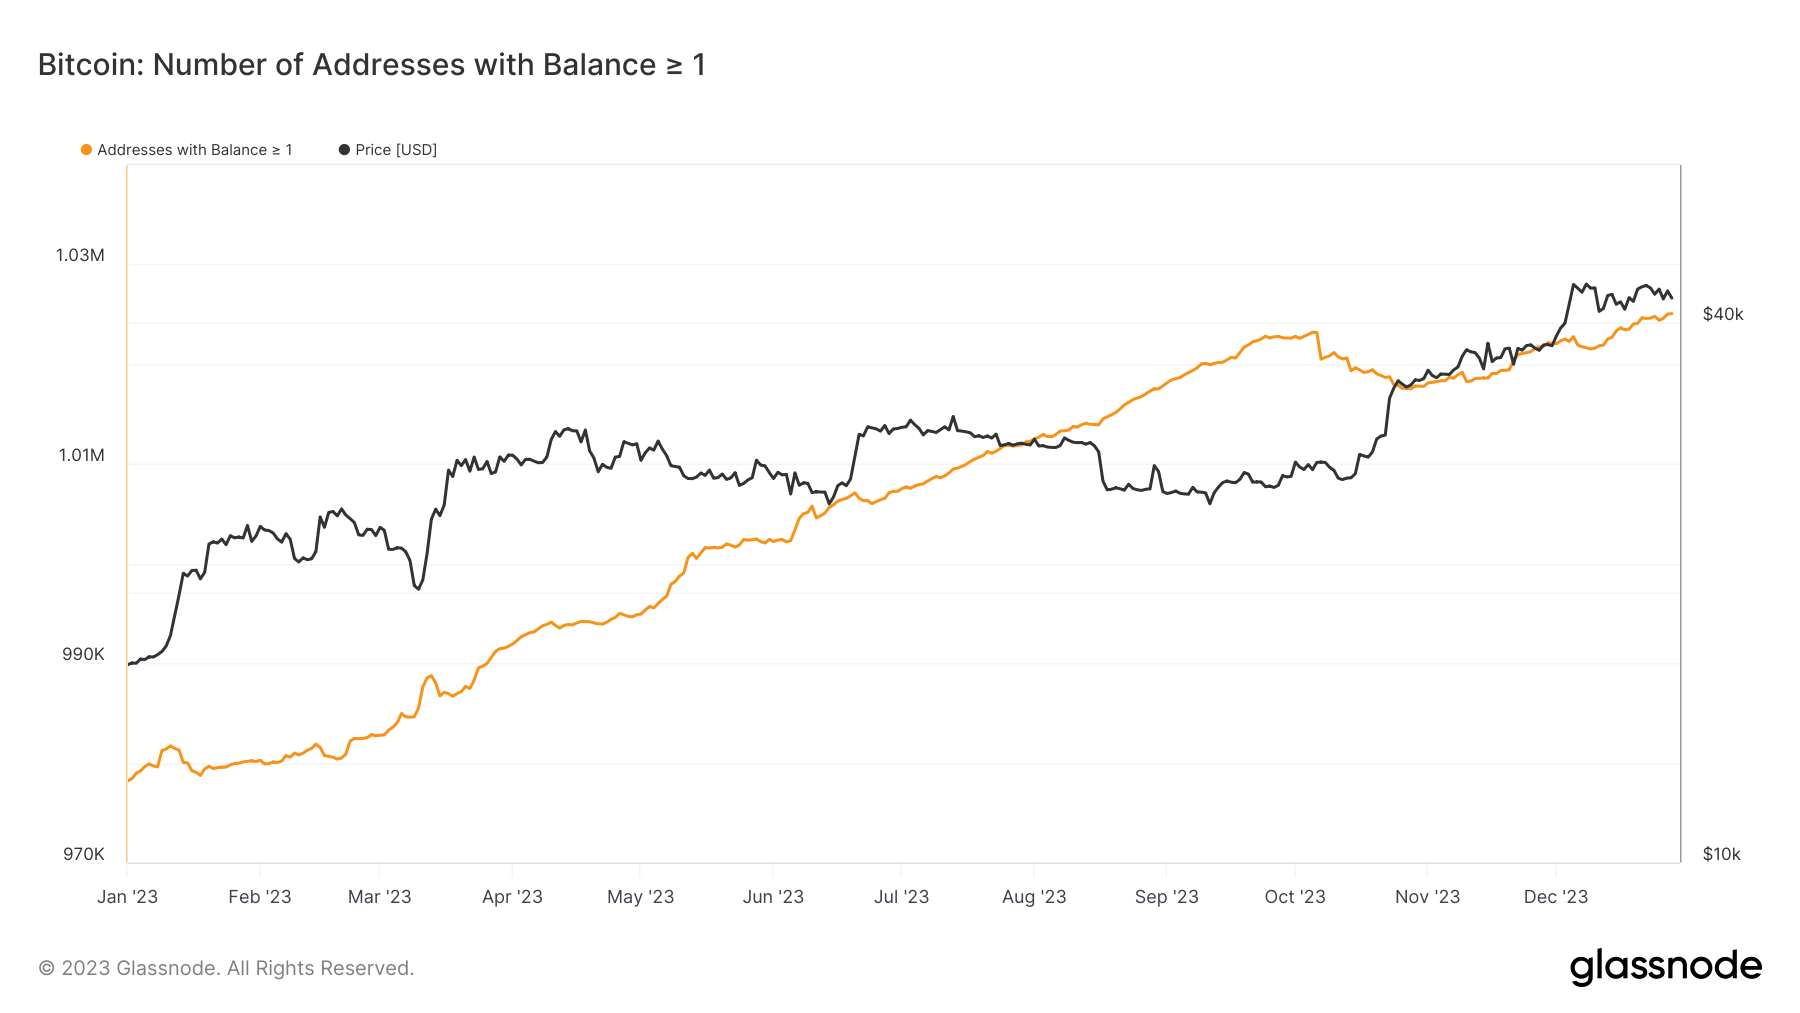
Addresses holding more than 1 Bitcoin are a key indicator of committed investment in the asset. Starting the year at 978,177 and growing to 1.02 billion represents a substantial increase, indicating that more investors are accumulating Bitcoin beyond the threshold of casual holding. This shift points towards a growing confidence in Bitcoin as a store of value and a commitment to longer-term holding strategies.
Graph showing the number of addresses with a balance greater than 1 BTC in 2023 (Source: Glassnode)
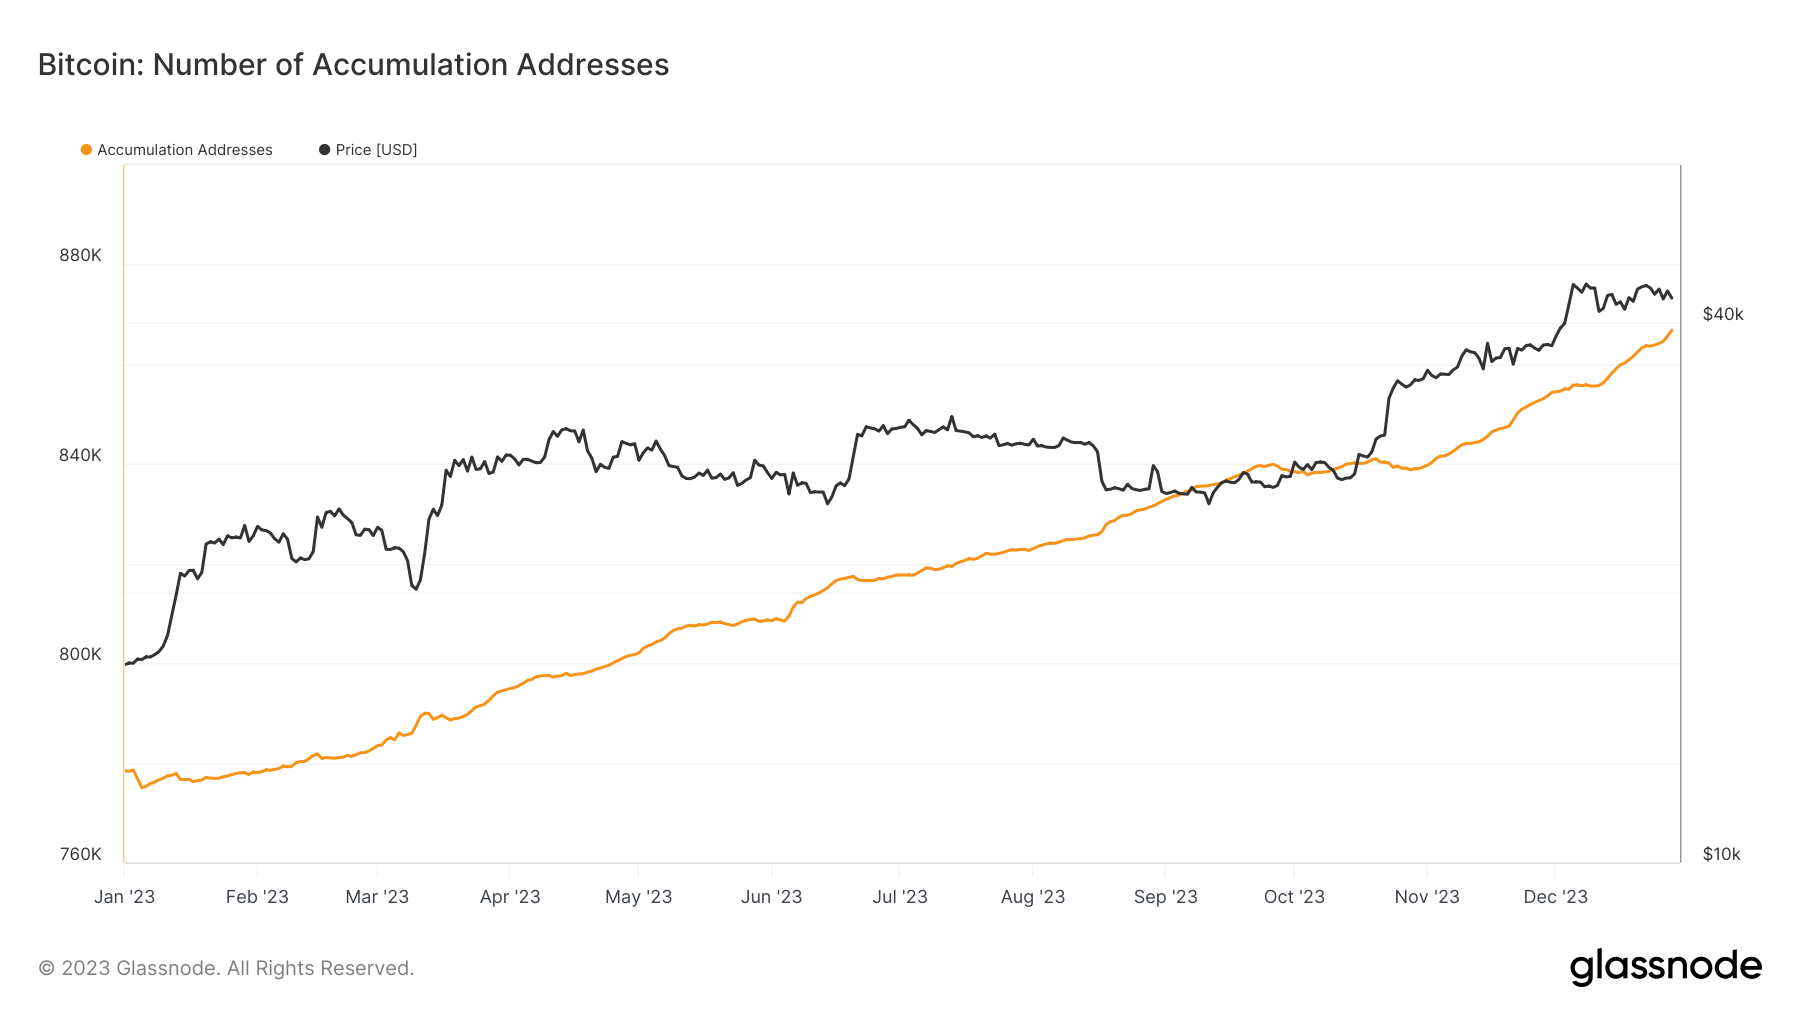
Accumulation addresses
Accumulation addresses, defined as unique addresses that have received at least two non-dust transfers and have never spent funds, excluding exchange and miner addresses, increased from 778,385 to 866,854. This 11.37% increase is significant, reflecting a pattern of sustained accumulation within the network. These addresses are often associated with long-term investors or ‘hodlers,’ and their growth signals a bullish sentiment among this cohort. Moreover, the total Bitcoin held in these addresses rose from 3.04 million to 3.17 million BTC, reinforcing the trend of accumulation.
Graph showing the number of accumulation addresses in 2023 (Source: Glassnode)
Long-term vs. short-term holder supply
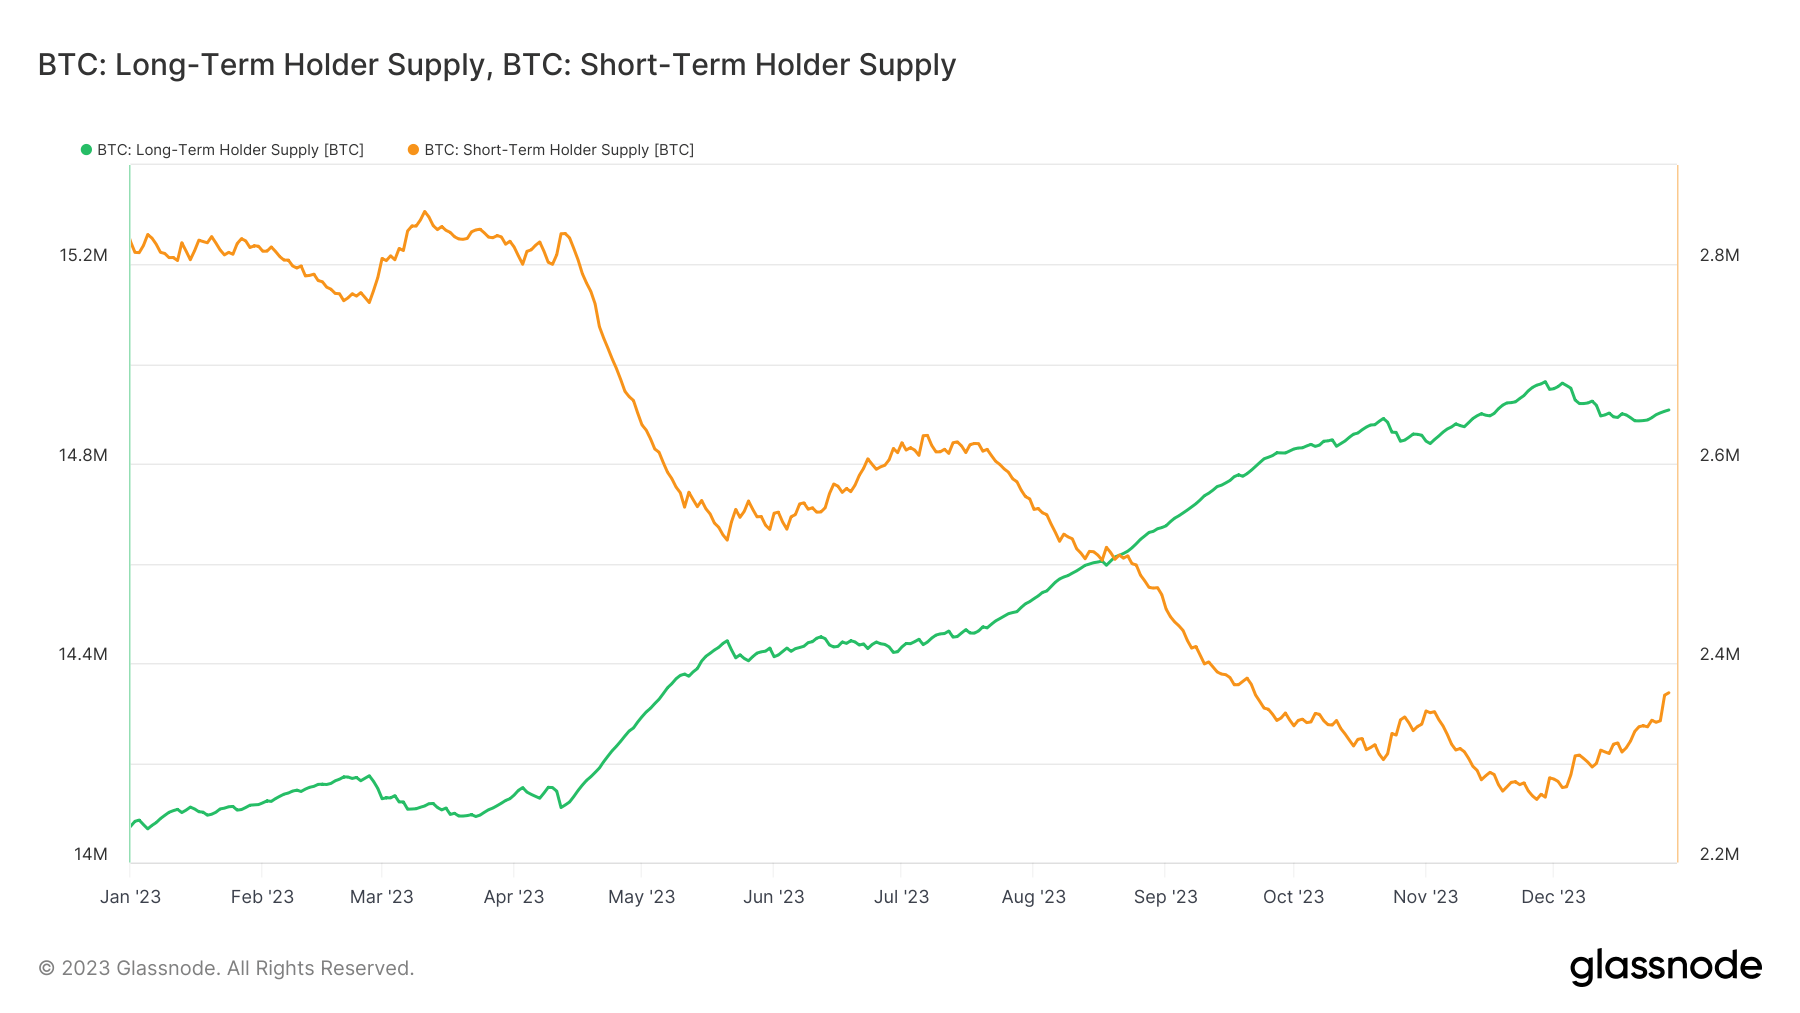
The distinction between long-term and short-term holder supply is crucial for understanding market sentiment. Long-term holders, typically defined as those holding Bitcoin for more than 155 days, saw their supply increase from 14.07 million to 14.90 million BTC, a rise of 5.90%. This increase underscores a growing trend of Bitcoin being held as a long-term investment.
Conversely, the short-term holder supply, representing those holding Bitcoin for less than 155 days, decreased from 2.82 million to 2.37 million BTC. This 15.96% decrease suggests a decline in speculative short-term trading and a potential shift towards more strategic, long-term holding patterns.
Graph showing the Bitcoin supplies held by long-term (green) and short-term (orange) holders in 2023 (Source: Glassnode)
Exchange balance
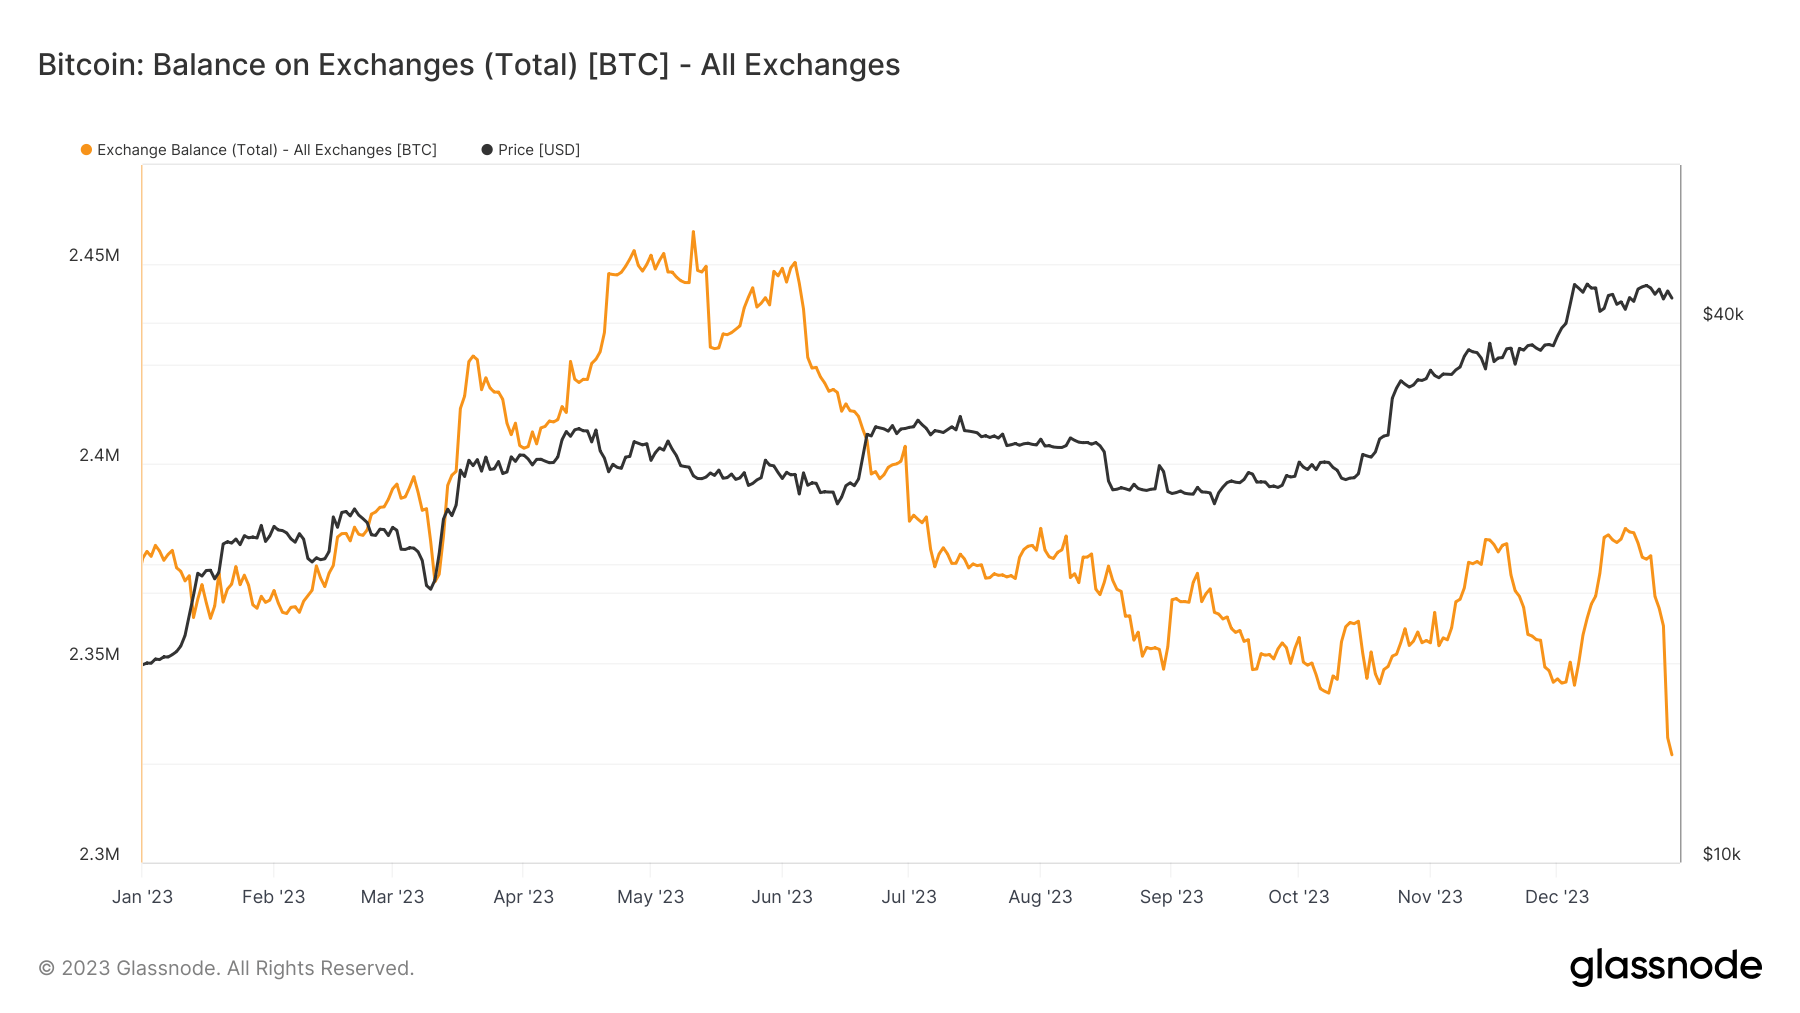
Exchange balances provide insight into the liquidity and potential selling pressure in the market. The slight decrease in exchange balance from 2.37 million to 2.32 million BTC indicates a marginal but noteworthy trend of Bitcoin being moved off exchanges. This behavior often signifies a preference for long-term holding in personal wallets over immediate liquidity, potentially reducing sell-side pressure on exchanges.
Graph showing the total amount of Bitcoins held on exchange addresses in 2023 (Source: Glassnode)
Profit/loss
Addresses in profit
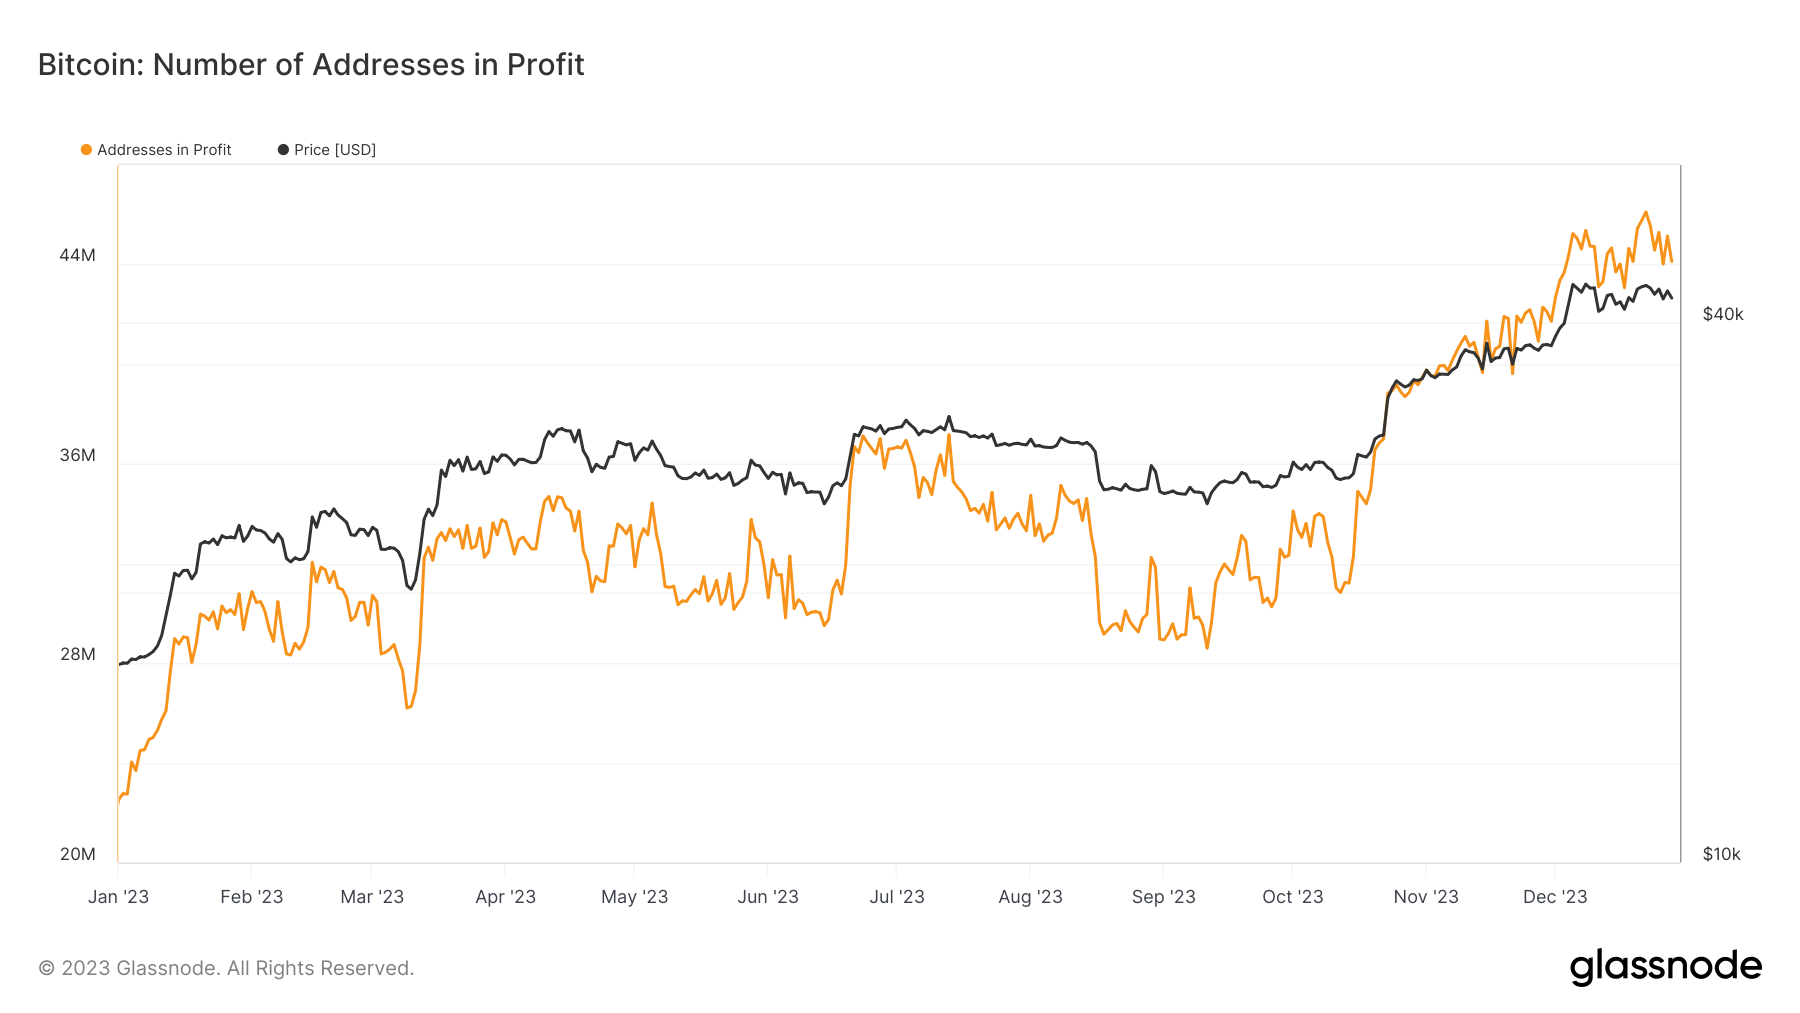
The number of addresses in profit is a key indicator of market health and investor sentiment. It refers to the number of unique Bitcoin addresses whose holdings are worth more than when they were purchased. This metric surged from 22.52 million on Jan. 1 to 44.12 million by Dec. 28, representing a dramatic increase of 95.9%. This substantial growth signifies a highly profitable market for most Bitcoin holders, reflecting the strong price appreciation of Bitcoin over the year.
Graph showing the number of Bitcoin addresses in profit in 2023 (Source: Glassnode)
Comparing the addresses in profit to the total number of Bitcoin addresses showed it has increased significantly since the beginning of the year, growing from 52.06% to 85.54%. This notable rise indicates that most market participants were in a favorable position by the end of the year.
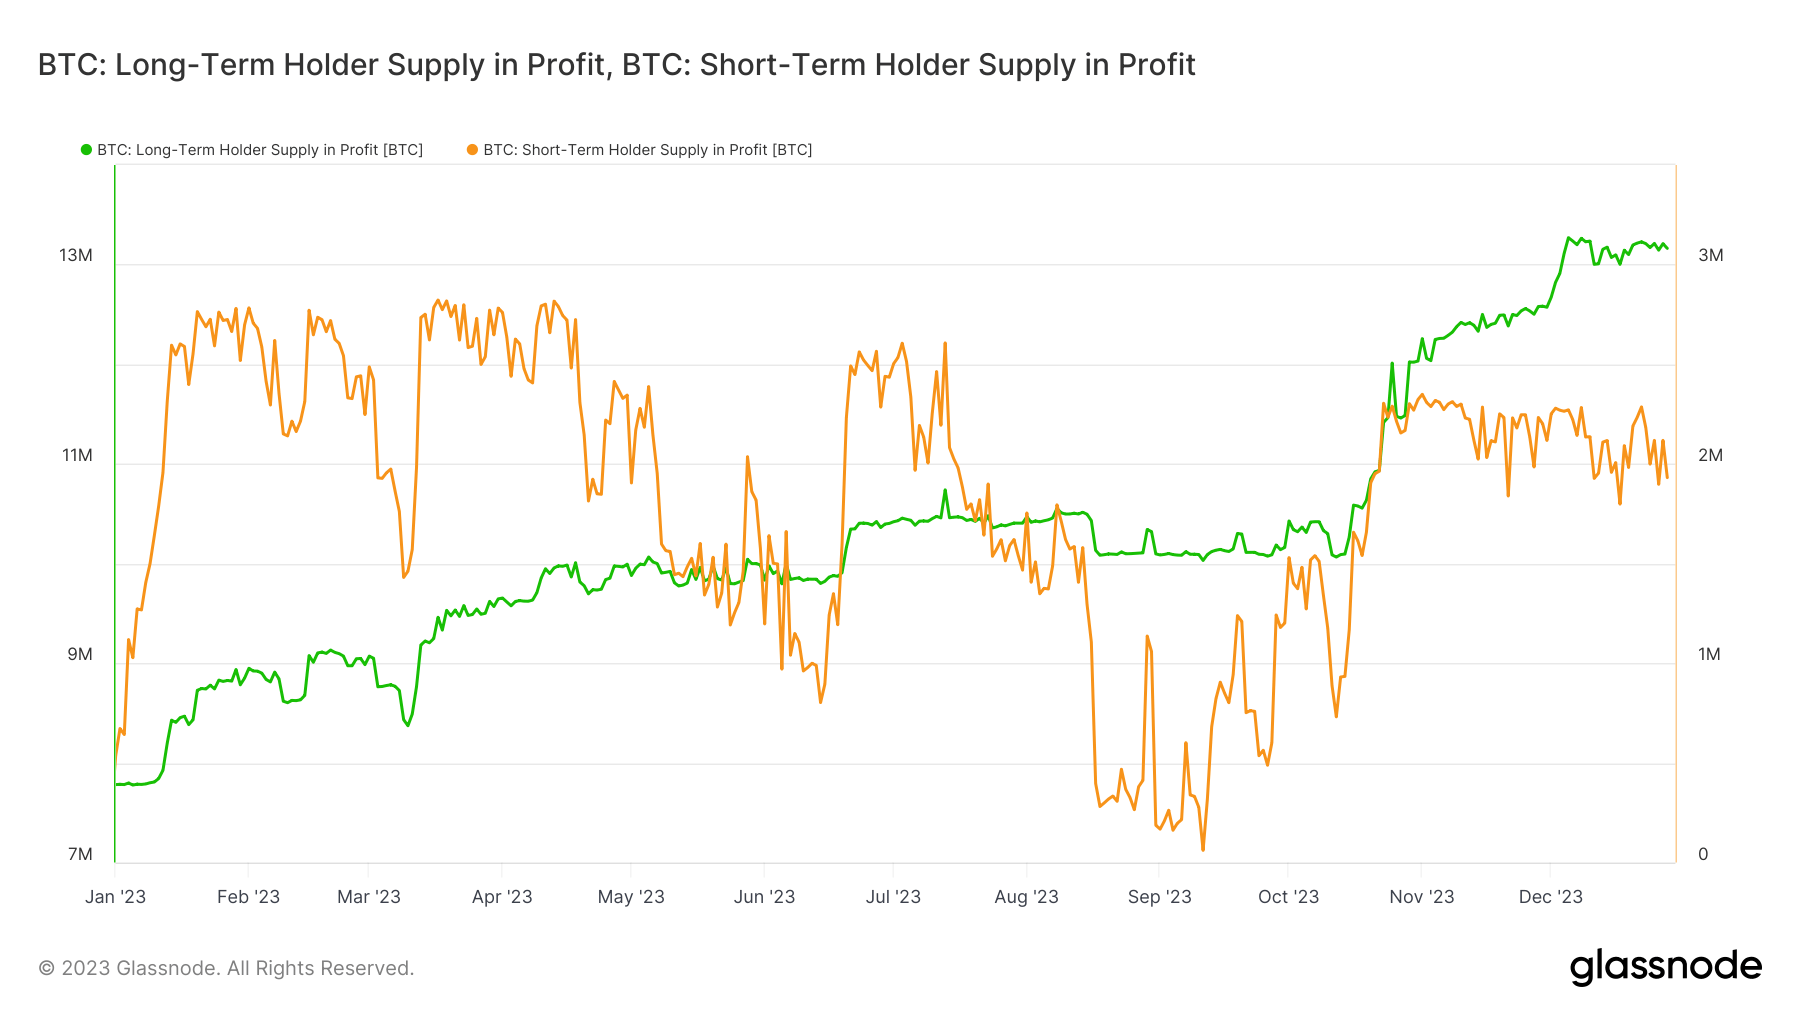
Long-term vs. short-term holder supply in profit
Analyzing the supply in profit segmented by holding duration offers insights into the behavior of different investor types. Long-term holders, generally considered the backbone of the Bitcoin market, saw their supply in profit rise from 7.78 million BTC to 13.16 million BTC. This indicates that holders who maintained their positions despite market fluctuations were rewarded with substantial gains.
Conversely, the short-term holder supply in profit, representing those holding their positions for less time, increased from 535,645 BTC to 1.93 million BTC. This reflects the profitable opportunities that existed even for those engaging in shorter-term trading strategies.
Graph showing the long-term (green) and short-term (orange) supply in profit in 2023 (Source: Glassnode)
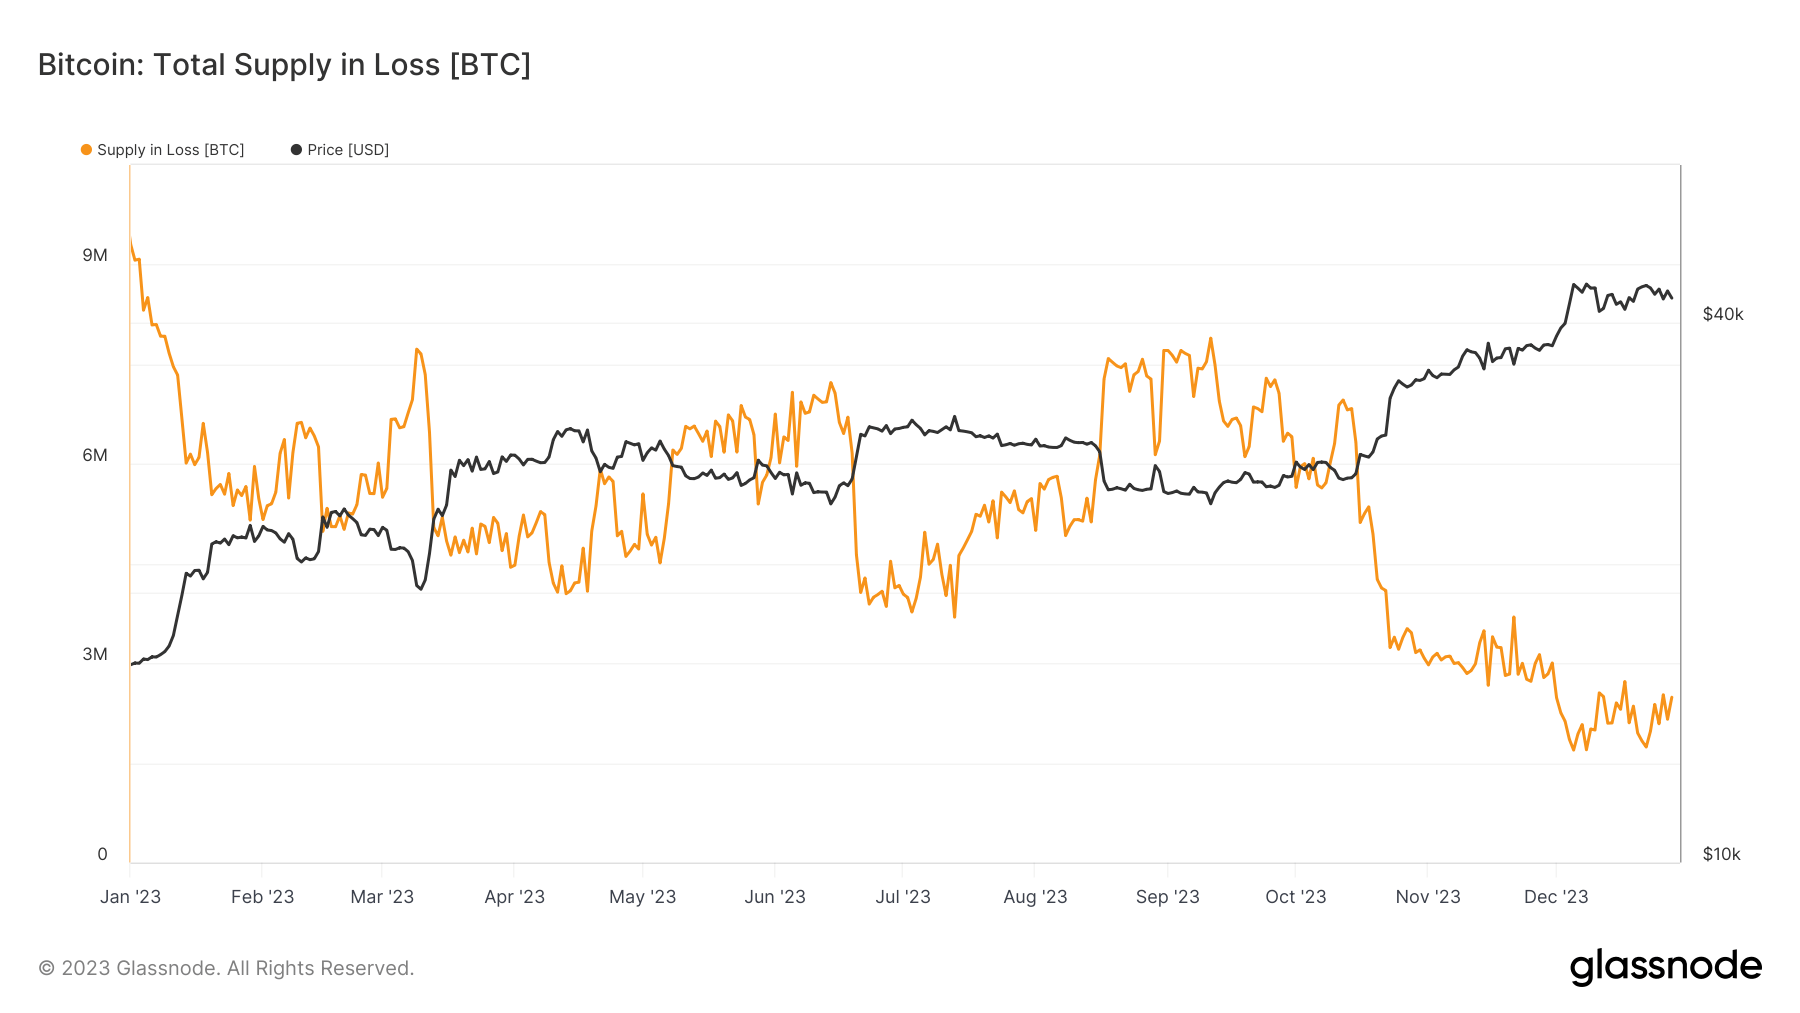
Supply in loss
The supply in loss provides a counterbalance to the profit metrics, offering a view of the market’s downside. The long-term holder supply in loss decreased significantly from 6.29 million BTC to 1.74 million BTC, indicating that fewer long-term holders were at a loss by year-end. Similarly, the short-term holder supply in loss also decreased from 2.28 million BTC to 438,320 BTC. These declines in the supply in loss are indicative of the overall price appreciation of Bitcoin and a generally favorable market for holders.
Graph showing Bitcoin’s supply in loss in 2023 (Source: Glassnode)
Miners and inscriptions
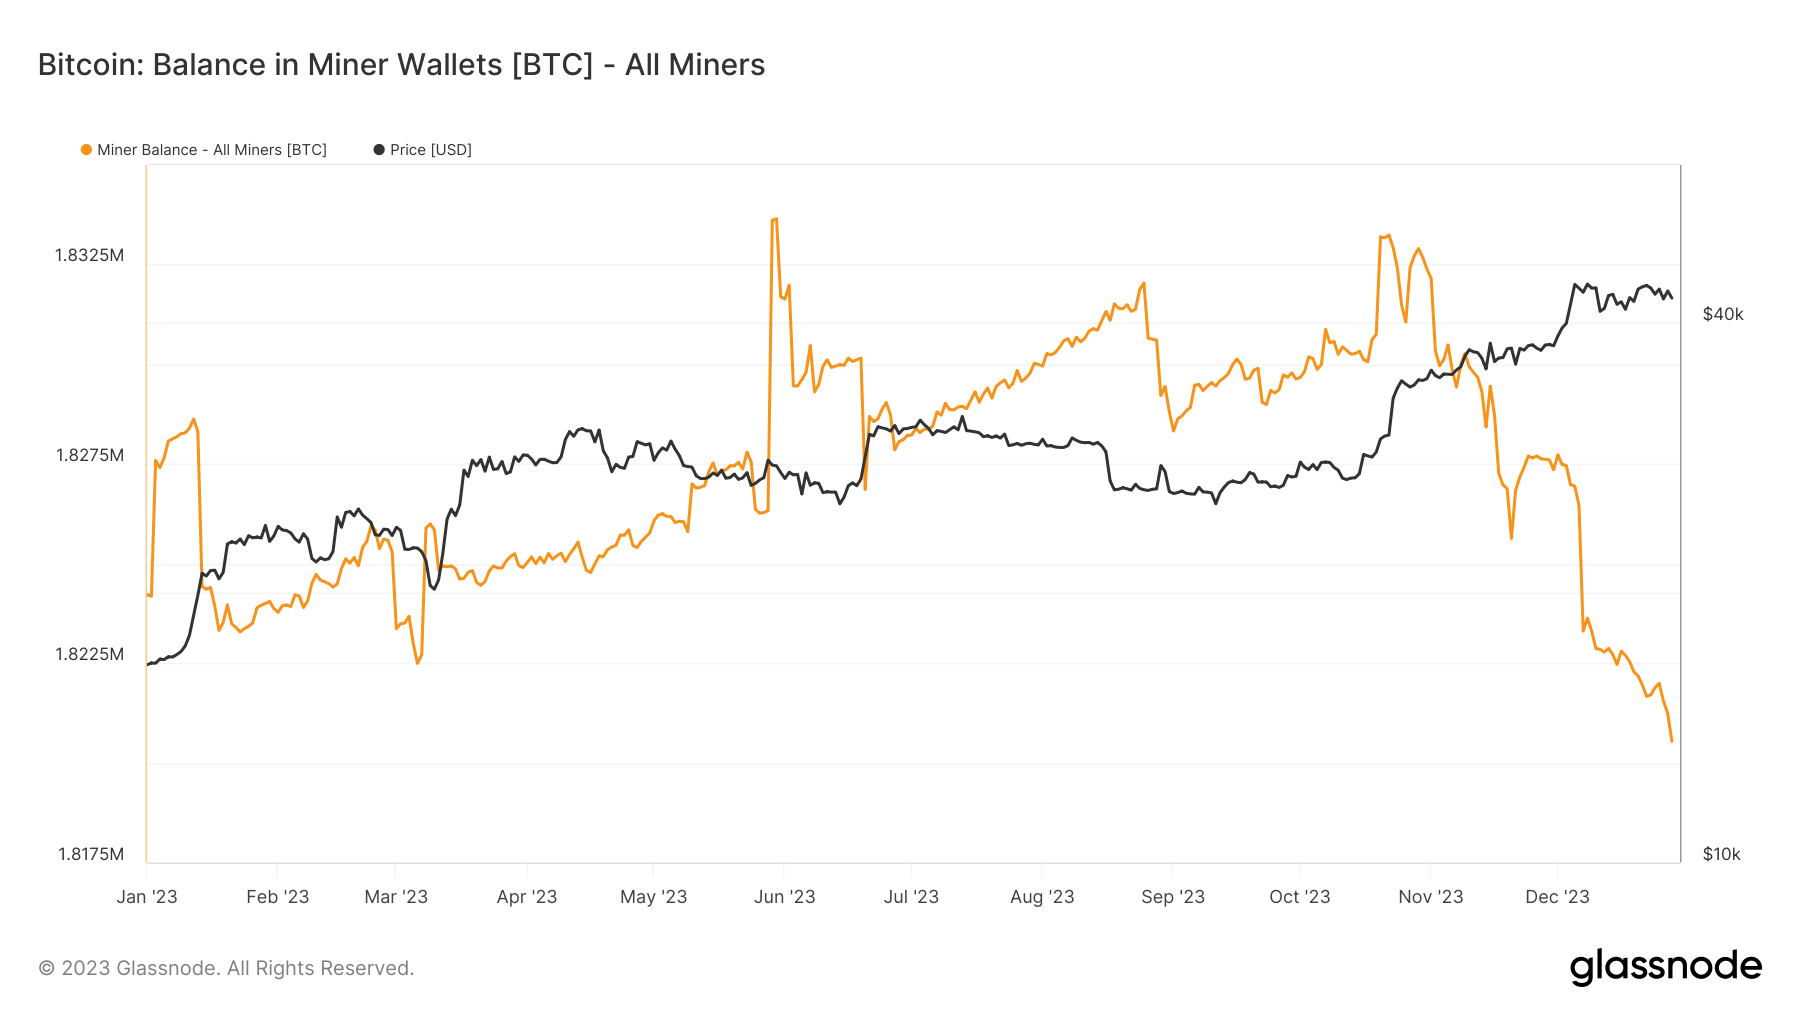
Miner balance
Miner balance refers to the total amount of Bitcoin held in miners’ wallets. It started at 1.824 million BTC on Jan. 1 and slightly decreased to 1.820 million BTC by Dec. 28. Despite being just 0.22%, this decrease is noteworthy particularly noteworthy. It indicates that miners were not significantly offloading their holdings, suggesting confidence in the future value of Bitcoin. A stable or increasing miner balance is often viewed as a bullish sign, as it implies miners are not under pressure to sell their mined Bitcoin to cover operational costs.
Graph showing the total supply of Bitcoin held in miner wallets in 2023 (Source: Glassnode)
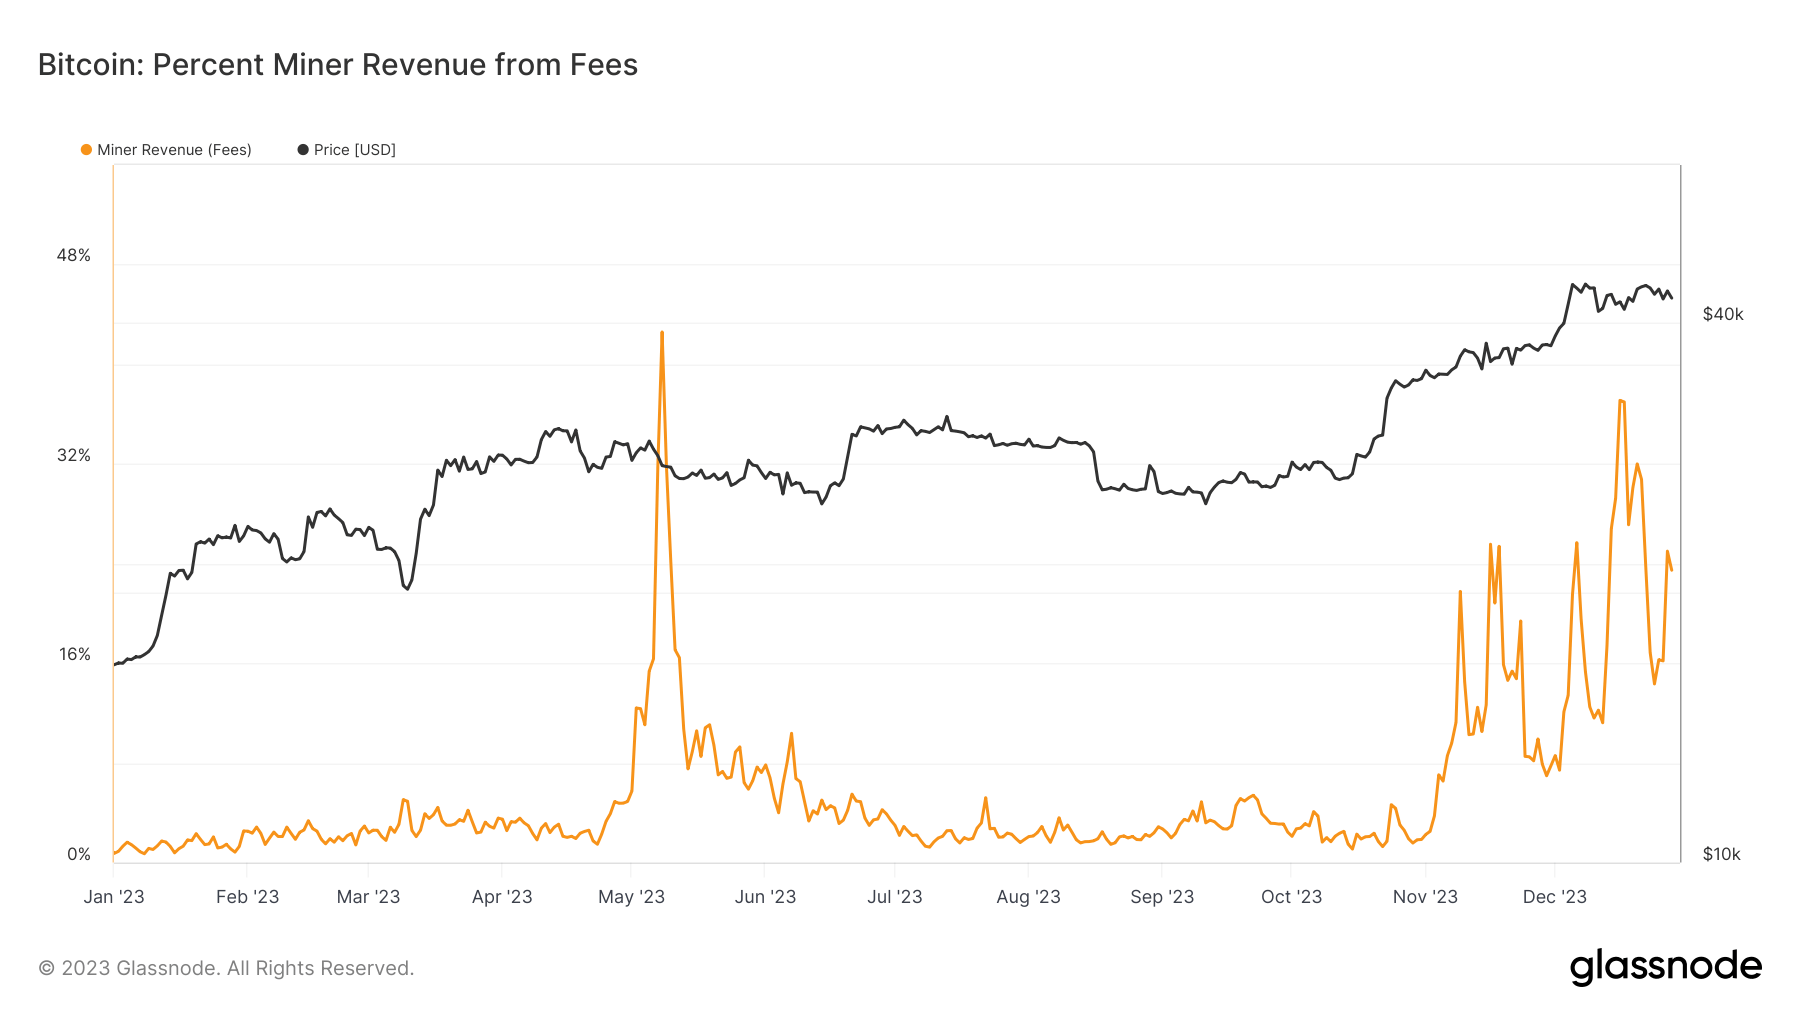
Miner revenue from fees
Miner revenue from fees, which is the percentage of total miner revenue derived from transaction fees as opposed to block rewards, saw a remarkable increase from 0.72% to 23.46%. This substantial increase is significant for a few reasons. Firstly, it reflects the growing utility and usage of the Bitcoin network, as more transactions mean more fees. Secondly, it indicates a shift in the economic incentives for miners, especially important as block rewards continue to halve every four years. Higher fee revenue can help sustain miner profitability in the long term, a critical factor for network security.
Graph showing the percentage of miner revenue derived from fees in 2023 (Source: Glassnode)
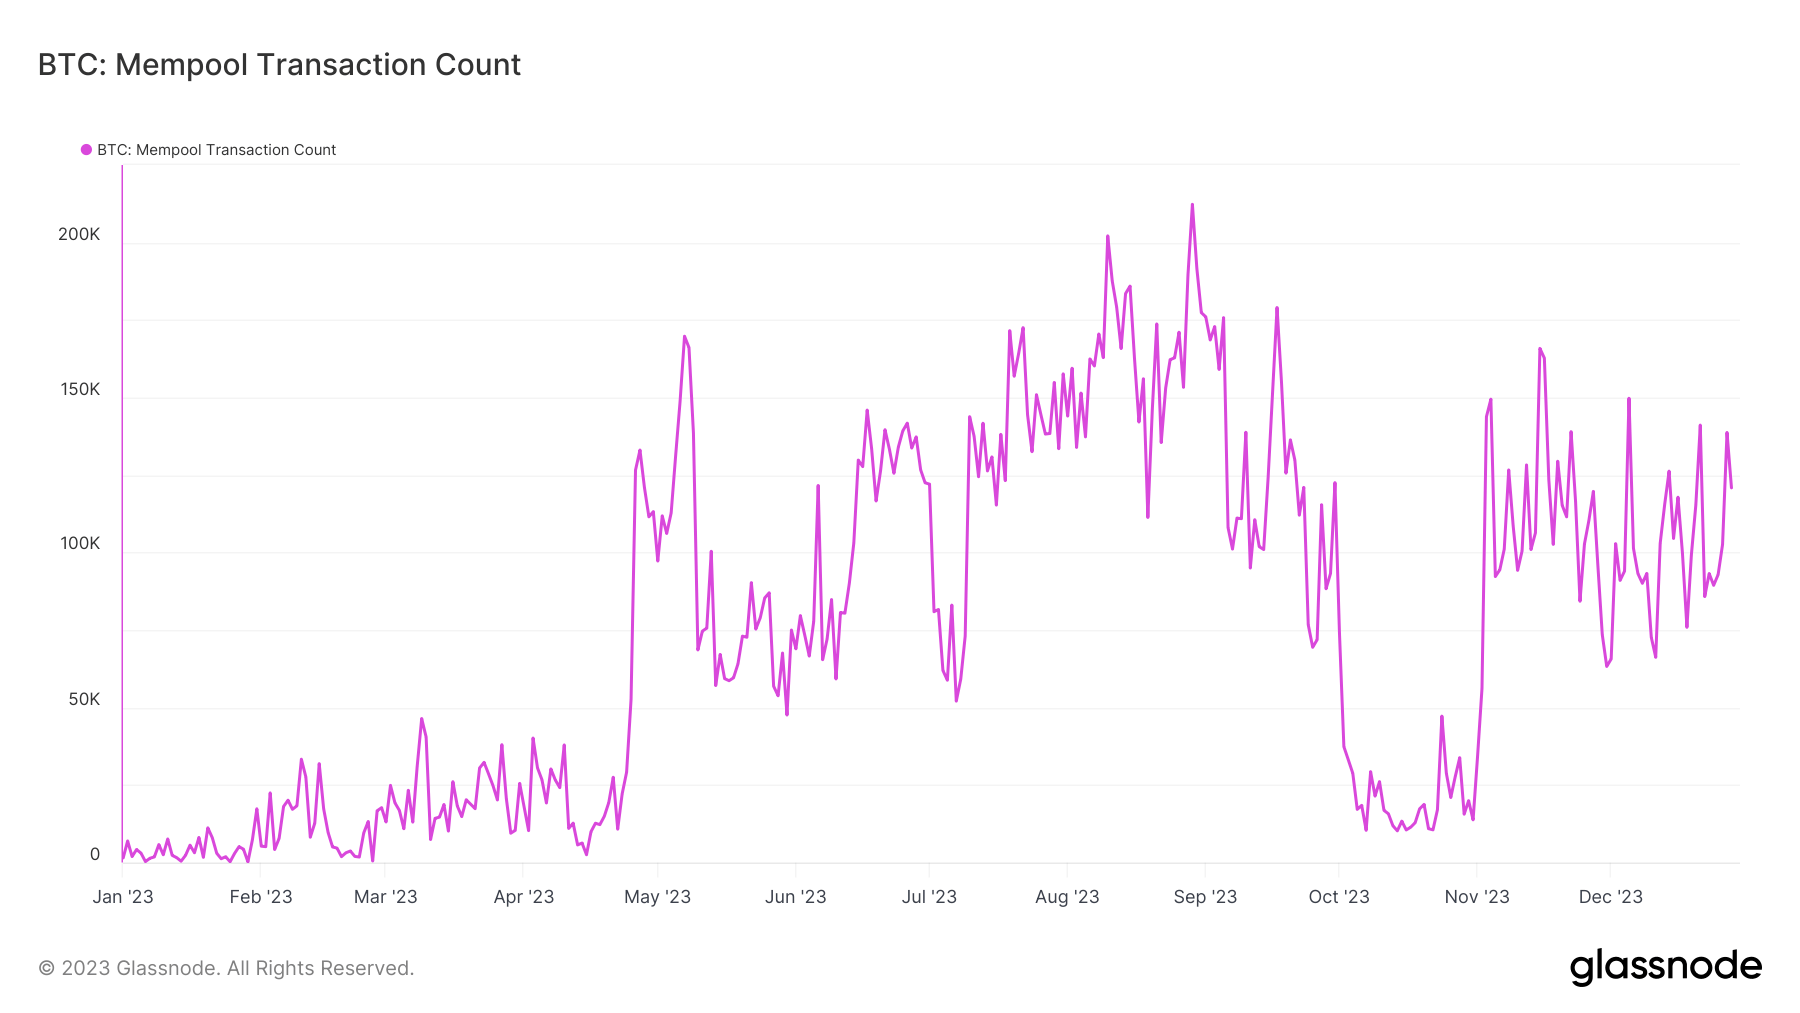
Mempool transaction count
The mempool transaction count, which measures the number of unconfirmed transactions in the mempool, grew from 1,496 to 120,875. This substantial increase signifies heightened network activity. A larger mempool transaction count can indicate rising demand for block space, often correlating with increased user activity and network utilization. However, it can also lead to higher transaction fees and longer confirmation times, as seen in the metrics mentioned above.
Graph showing the total number of transactions waiting in the Bitcoin mempool (Source: Glassnode)
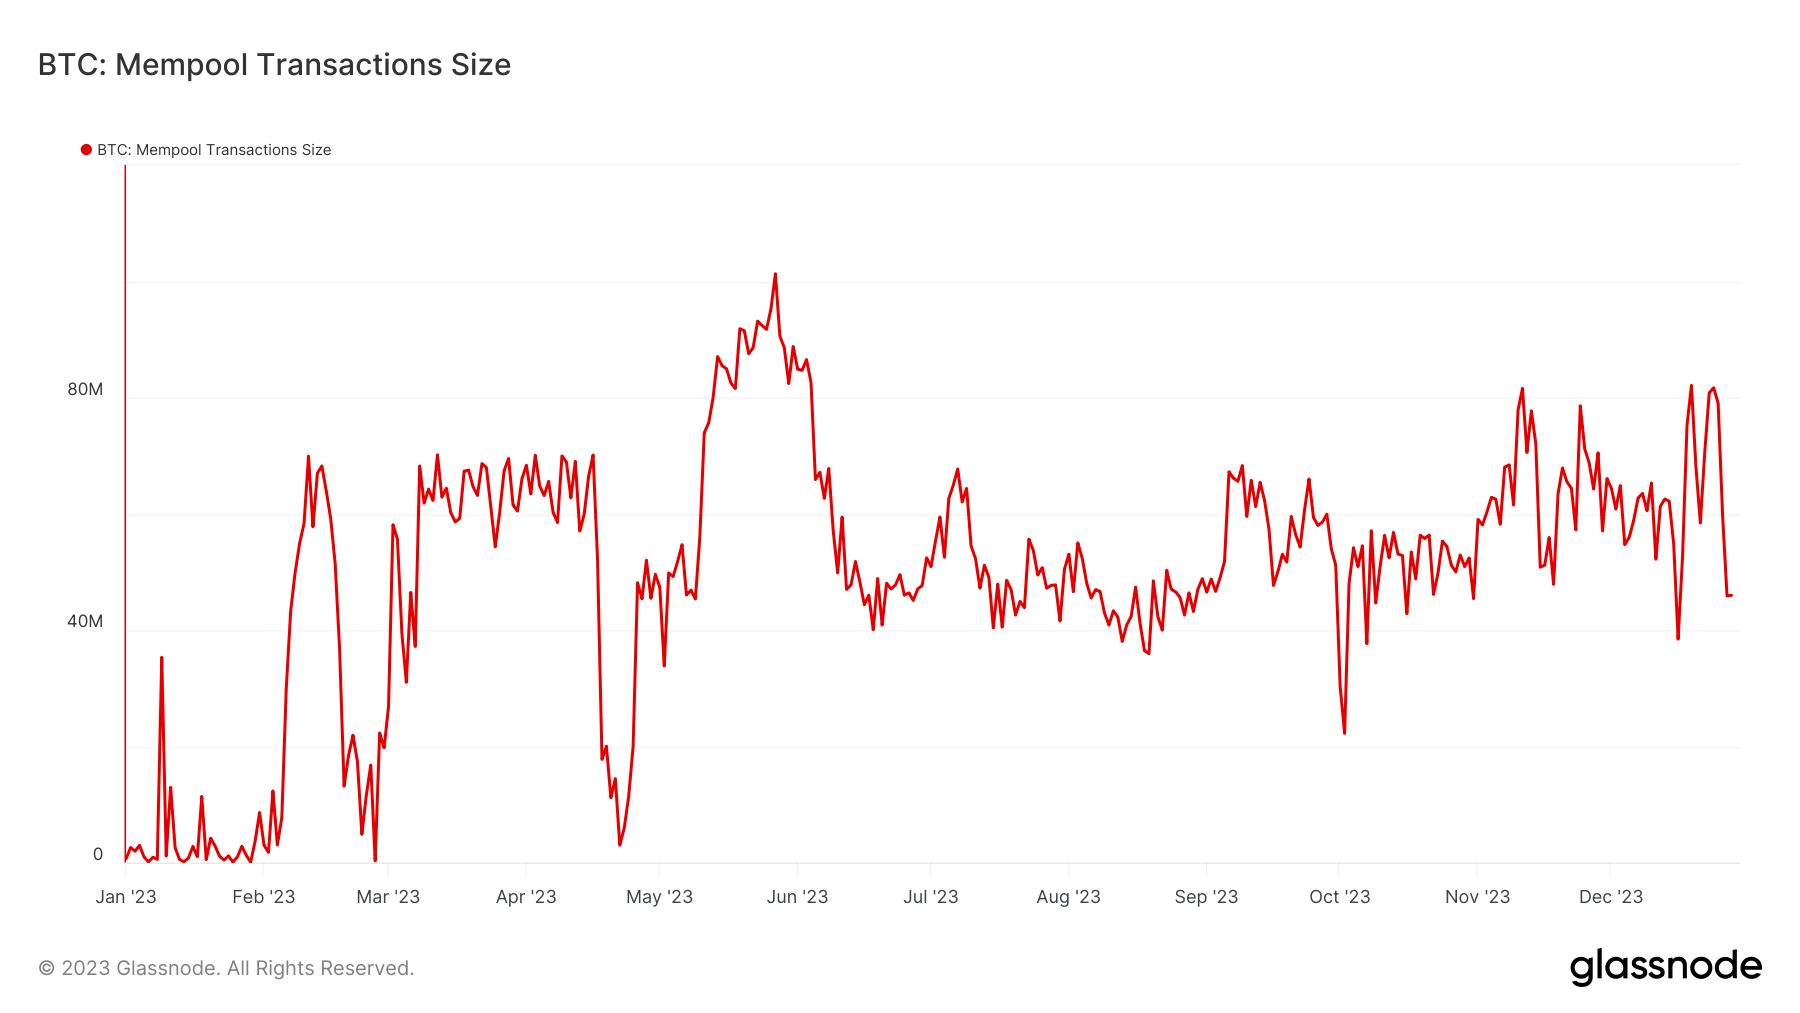
Mempool transaction size
Mempool transaction size, measured in bytes, reflects the total size of transactions waiting to be confirmed. It increased dramatically from 668,218 bytes to 45.9 million bytes. This increase aligns with the rise in transaction count and further underscores the heightened network activity. Larger mempool sizes can strain the network, leading to congestion and increased fees, but they also reflect a robust and heavily utilized network.
Graph showing the total size (denoted in virtual bytes) of all transactions waiting in the Bitcoin mempool in 2023 (Source: Glassnode)
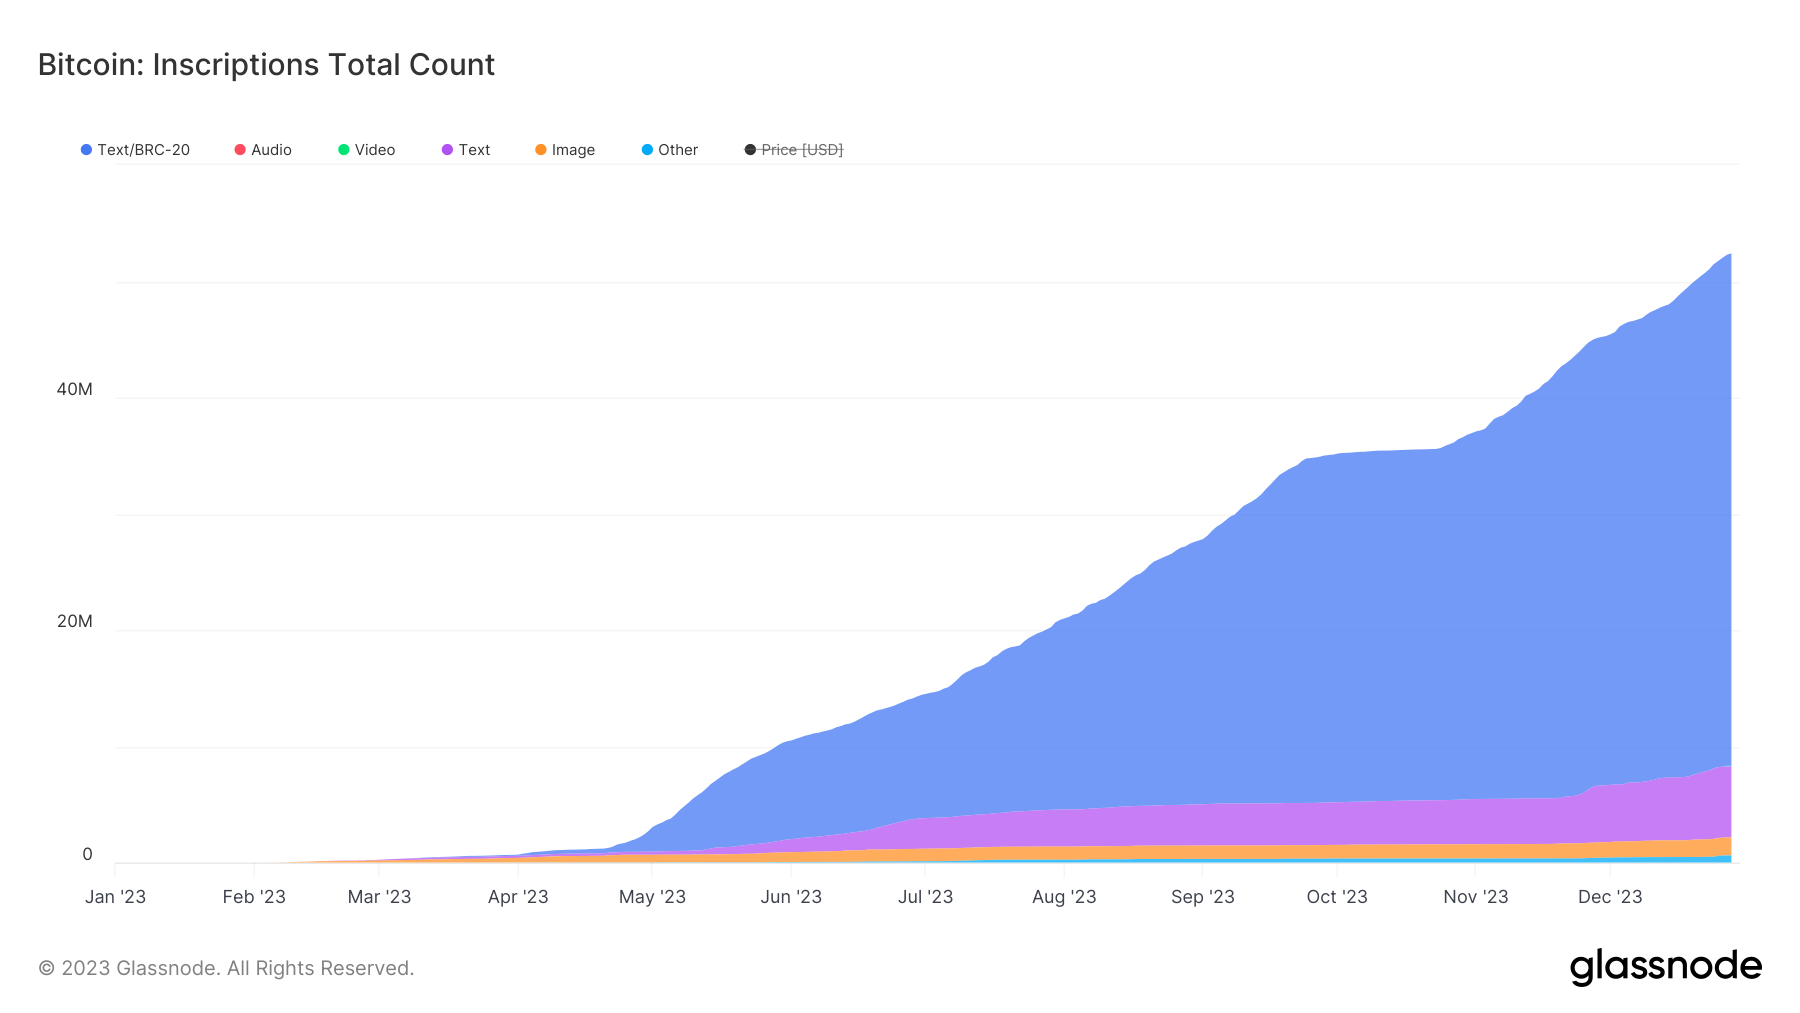
Inscriptions
Introduced in January, Inscriptions saw their popularity explode in the first half of the year and are the ones to blame for the increase in transaction fees, transaction numbers, and mempool congestion. There were less than 680 inscriptions on Feb. 1 this year. As of Dec. 28, 52.4 million inscriptions have been added to the Bitcoin blockchain. This new trend signifies an innovative use of the Bitcoin network beyond mere financial transactions. The growth in inscriptions points to the evolving nature of blockchain technology and its expanding utility in digital record-keeping.
Graph showing the total number of inscriptions by type on the Bitcoin network in 2023 (Source: Glassnode)
Derivatives
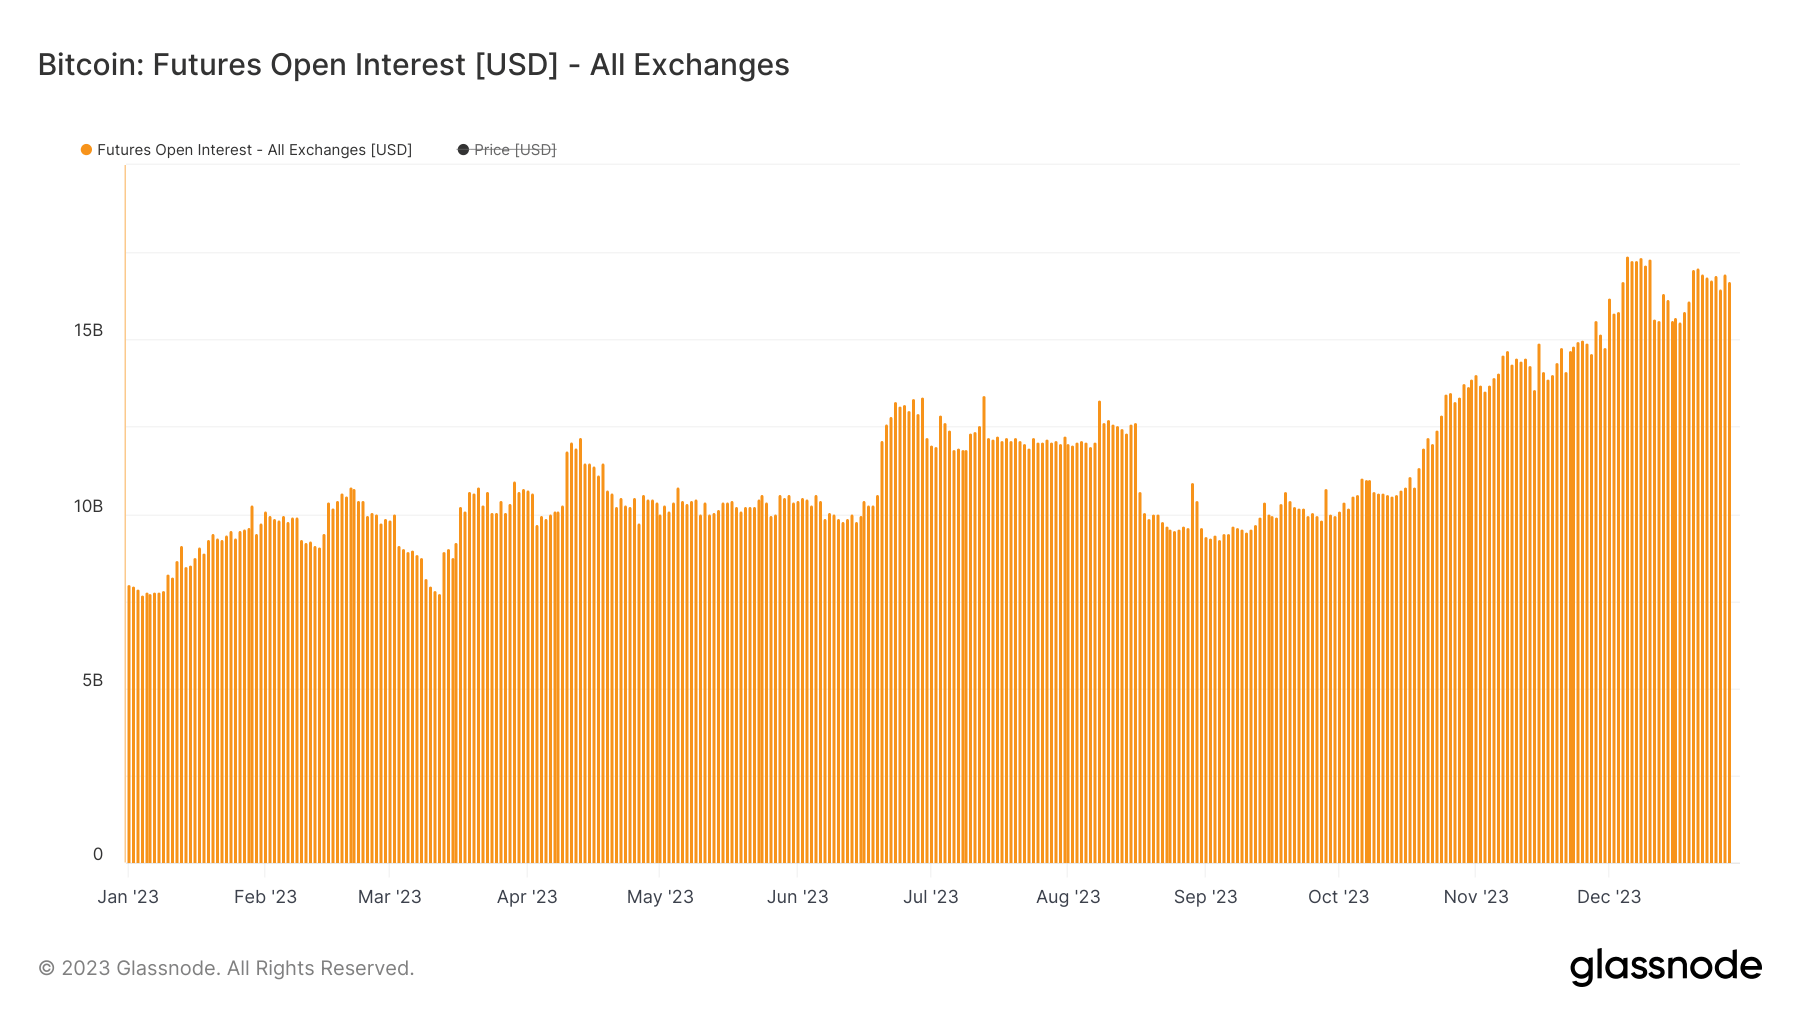
Futures open interest
Futures open interest refers to the total value of outstanding futures contracts that have not been settled. The open interest on Bitcoin futures increased significantly from $7.99 billion on Jan. 1 to $16.69 billion by Dec. 28, more than doubling with an increase of approximately 108.89%. This dramatic rise in open interest signals a growing interest and participation in the Bitcoin futures market. High open interest typically indicates increased liquidity and trading activity, making the market more attractive for both retail and institutional traders. It also suggests that more traders are willing to bet on Bitcoin’s future price, reflecting confidence or speculation in its price movement.
Graph showing the total amount of Bitcoin (USD Value) allocated in open futures contracts in 2023 (Source: Glassnode)
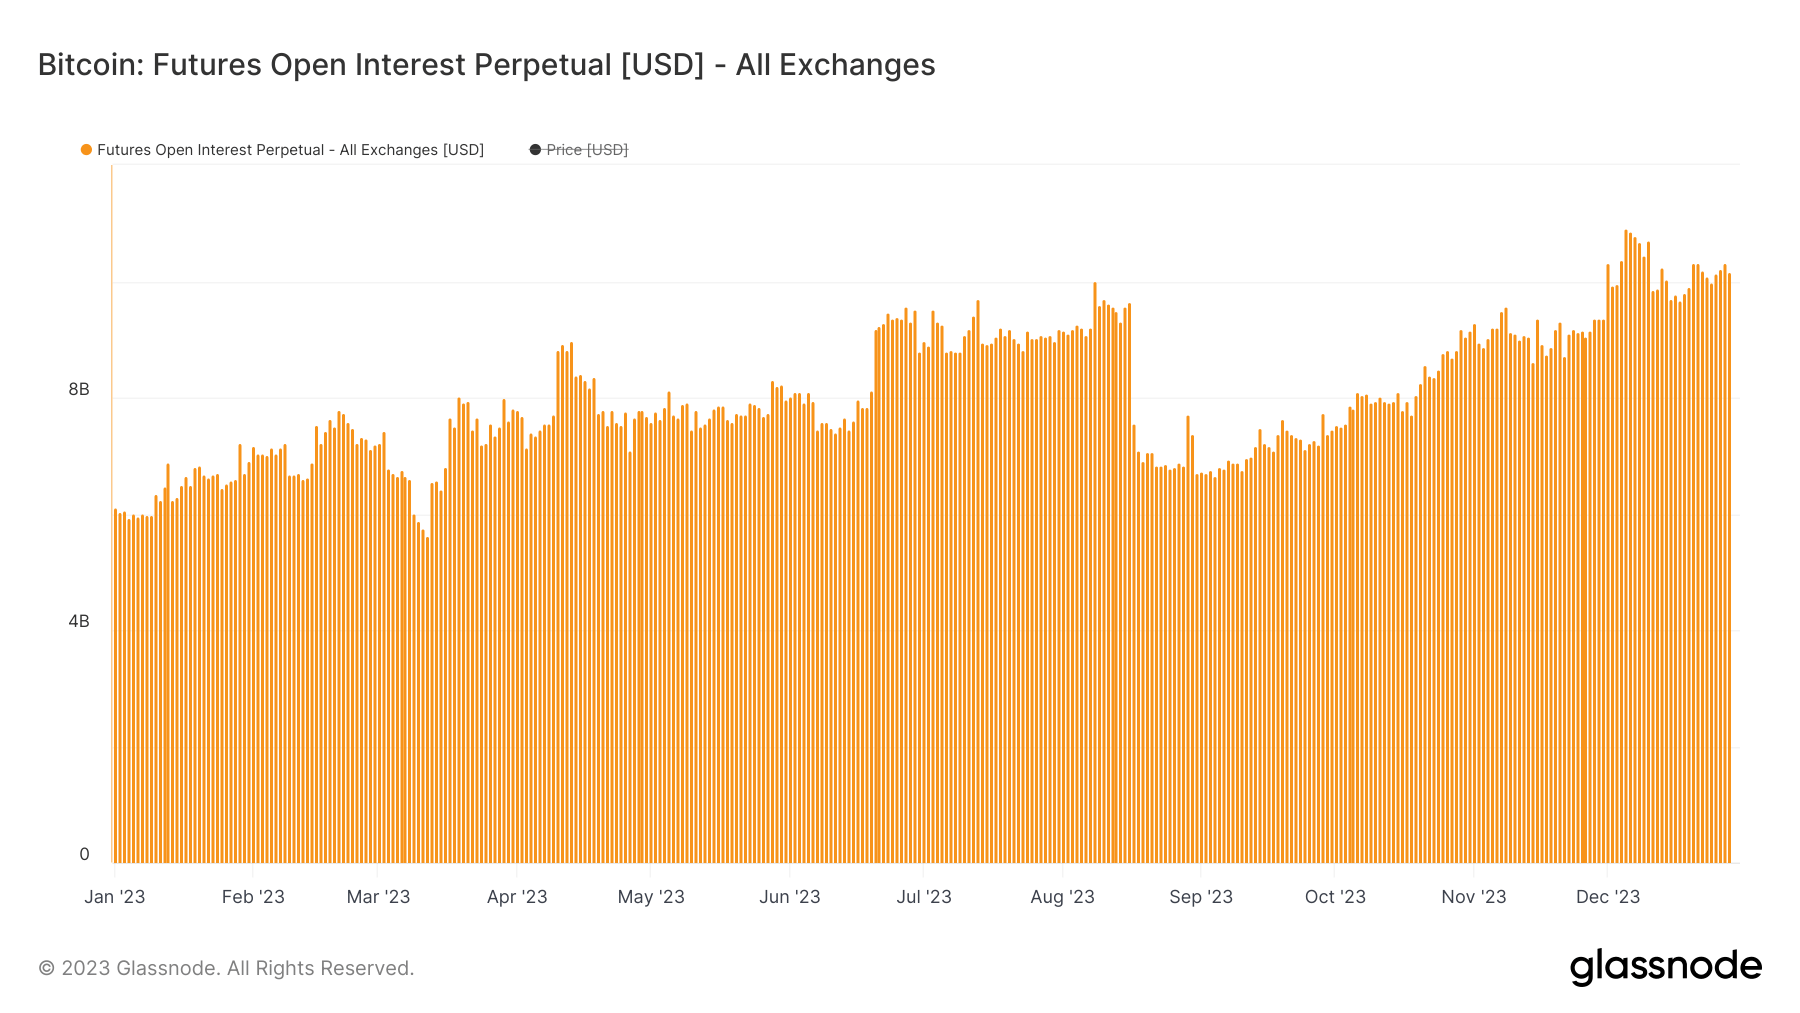
Perpetual futures open interest
Unlike traditional futures, Perpetual futures do not have an expiration date and hence allow traders to hold positions indefinitely. The open interest in perpetual futures increased from $6.10 billion to $10.17 billion, marking a significant increase of 66.72% YTD. This growth points to an increased appetite for perpetual trading, which is often preferred for its flexibility and the ability to easily implement various trading strategies. The increase in perpetual futures open interest also suggests that more traders are engaging in complex trading and speculative activities.
Graph showing the total amount of Bitcoin (USD Value) allocated in open perpetual (non-expiring) futures contracts in 2023 (Source: Glassnode)
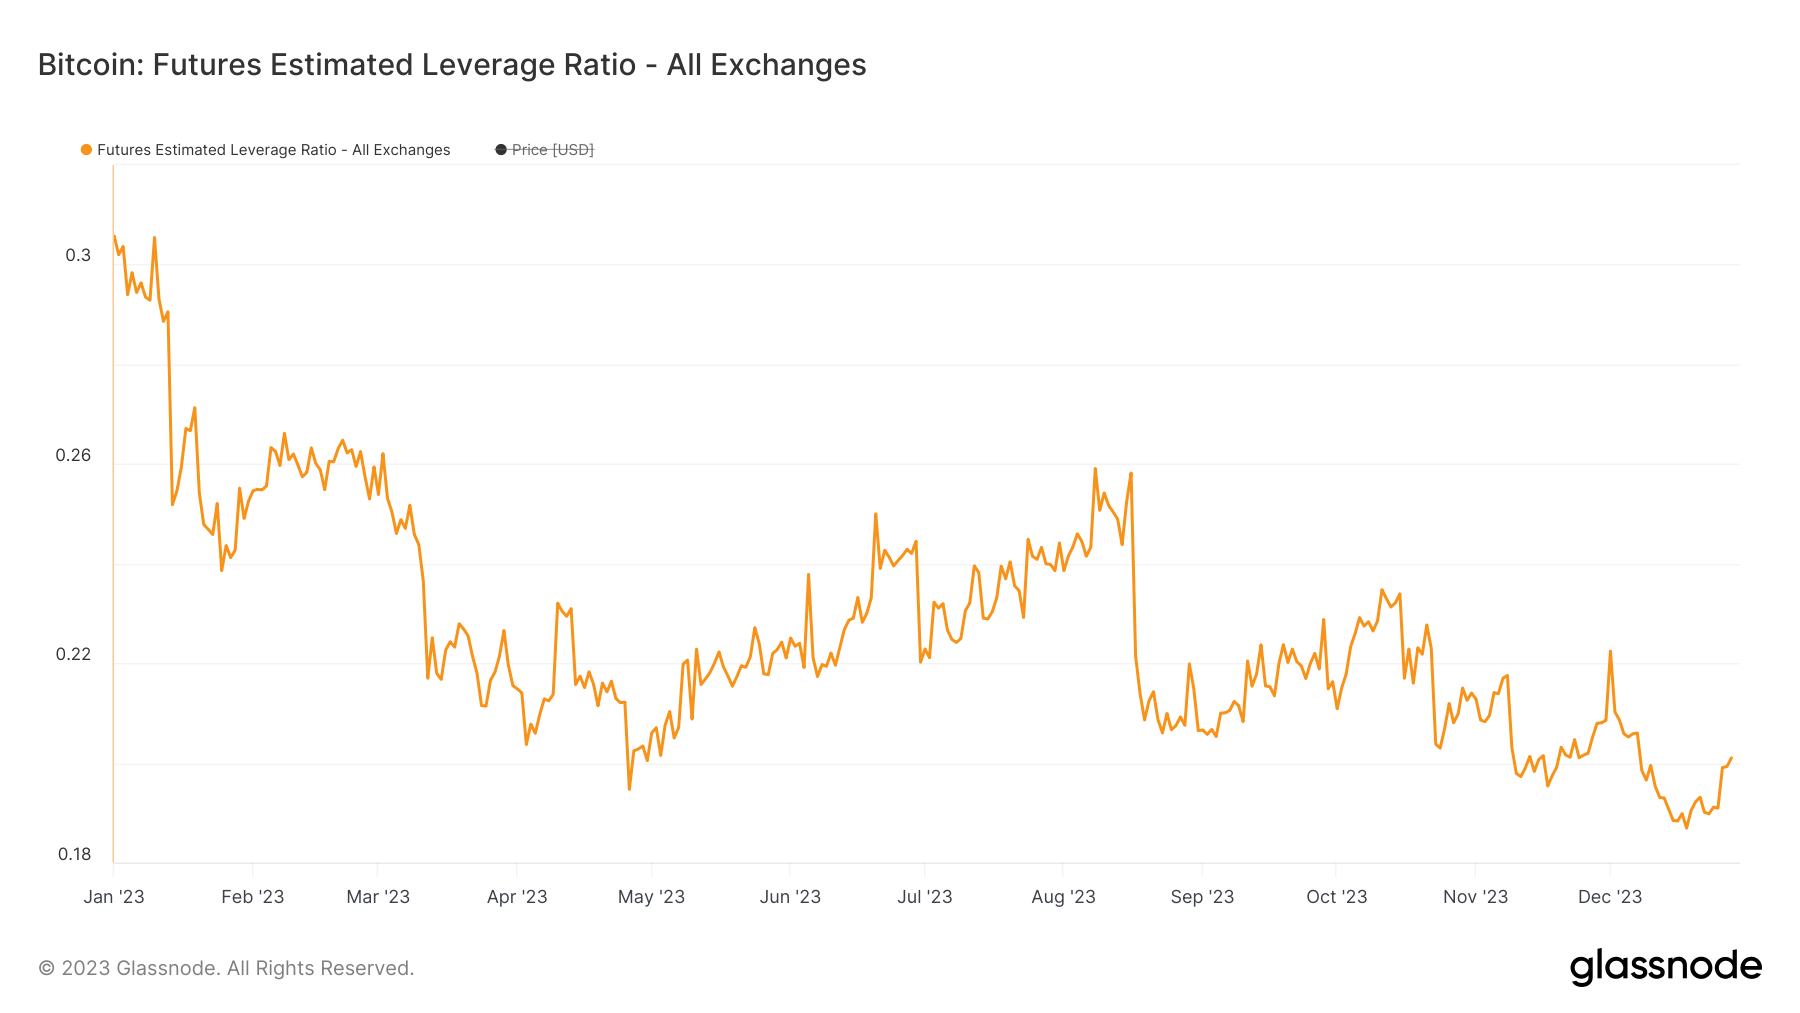
Futures estimated leverage ratio
The futures estimated leverage ratio measures the average leverage used in the futures market. It decreased from 0.3 to 0.2 over the year. This decrease indicates a reduction in the average level of leverage employed by traders. Lower leverage implies a more cautious approach to trading, possibly reflecting a greater awareness of risk in the market. This can be seen as a positive sign for the market’s health, as excessive leverage can lead to higher volatility and systemic risks.
Graph showing the estimated leverage ratio for Bitcoin futures in 2023 (Source: Glassnode)
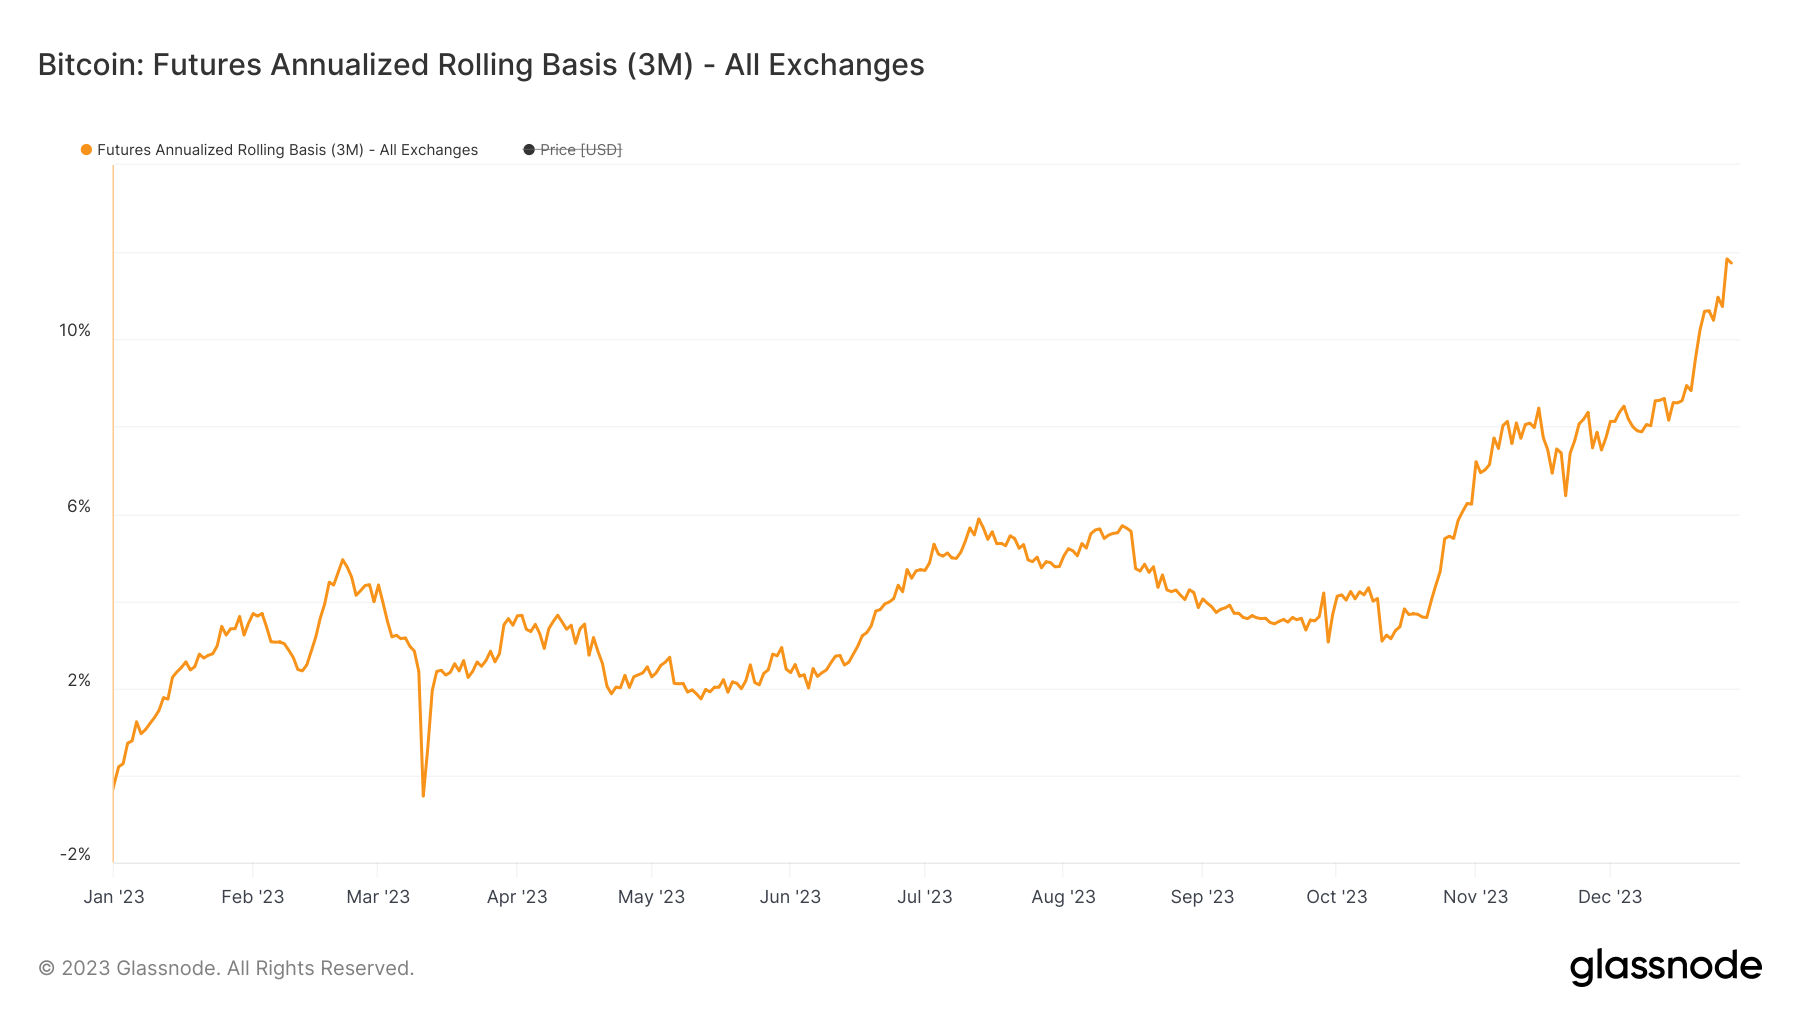
3-month futures annualized rolling basis
The 3-month futures annualized rolling basis represents the annualized yield that can be achieved by engaging in a basis trade, where a trader buys the spot asset and simultaneously sells a futures contract expiring in 3 months. This strategy is employed to capitalize on the price differences between spot and futures markets without taking on directional exposure to Bitcoin’s price.
On Jan. 1, the 3-month futures annualized rolling basis was -0.196%, indicating that futures were trading at a slight discount to the spot price. By Dec. 28, this metric shifted dramatically to 11.75%. Such a positive rolling basis suggests that futures were trading at a significant premium to the spot price. This shift could be due to several factors, including increased demand for Bitcoin in the futures market, bullish market sentiment, or liquidity constraints. A positive and high rolling basis is often interpreted as a bullish signal, indicating that traders are willing to pay a premium for future delivery, expecting higher prices ahead.
Graph showing the 3-month annualized rolling basis for Bitcoin futures in 2023 (Source: Glassnode)
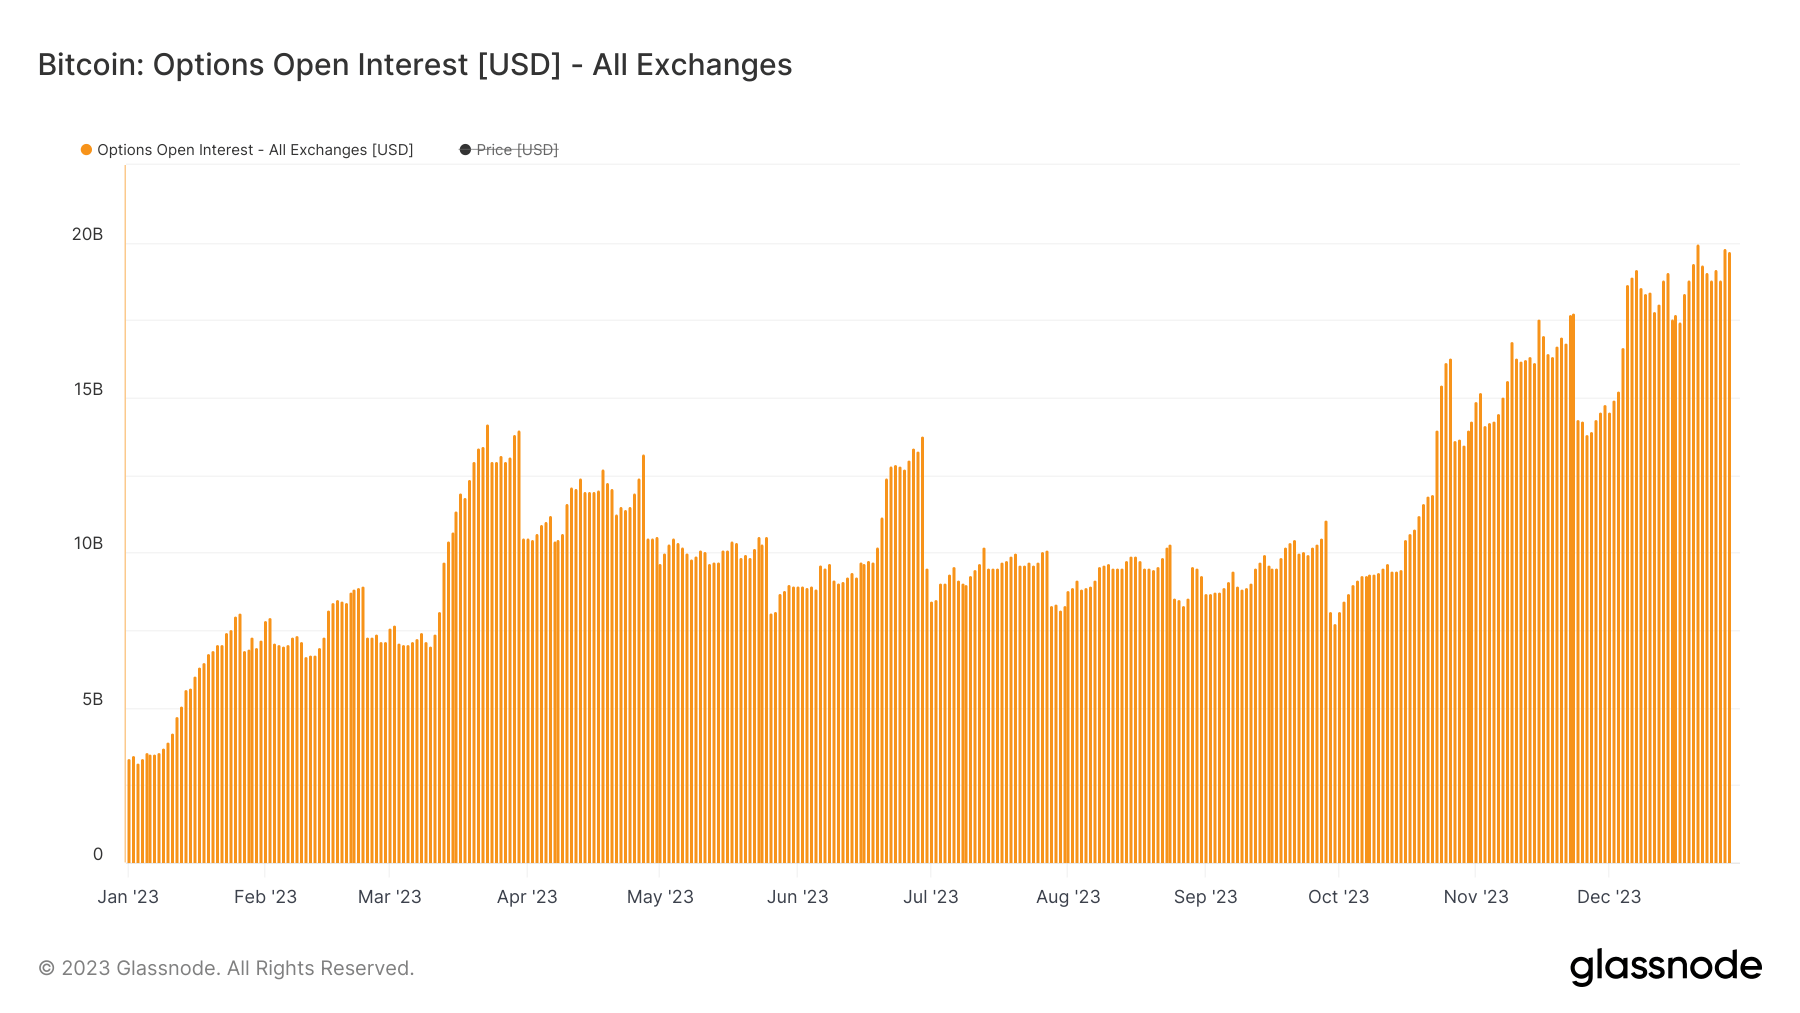
Options open interest
Options open interest, which represents the total value of outstanding options contracts, saw a massive increase from $1.92 billion to $19.73 billion over the year, an increase of over 927%. This explosive growth indicates a burgeoning interest in Bitcoin options trading. High open interest in options suggests a diverse range of market strategies being employed, from hedging to speculative plays, and reflects a maturing market where traders seek more sophisticated instruments to express their views and manage risk. The significant rise in options open interest also points to the increased institutionalization of the Bitcoin market, as institutional investors commonly use options for risk management and strategic trading.
Graph showing the total amount of Bitcoin (USD value) allocated in options contracts in 2023 (Source: Glassnode)
Conclusion
The strong price performance and market capitalization growth highlight Bitcoin’s resilience and appeal as a digital asset. The on-chain metrics and holder behavior suggest a maturing market with a growing user base inclined towards long-term investment. The profit/loss dynamics indicate a generally profitable market for holders, bolstering investor confidence. The miners’ activities and network data reflect a robust, heavily utilized network adapting to new uses and challenges. Lastly, the derivatives market trends point to Bitcoin’s growing integration into the broader financial system, attracting both retail and institutional participants.
In conclusion, Bitcoin’s performance over the past year paints a picture of a maturing asset with increasing adoption, a broadening user base, and a shift towards long-term holding. The expansion of the derivatives market signifies a sophisticated and evolving financial ecosystem around Bitcoin. Collectively, these trends indicate a robust and maturing market, providing valuable insights for investors and market participants.