Bitcoin technical analysis, price reaches yearly high as it nears $9000

Cover art/illustration via CryptoSlate. Image includes combined content which may include the use of AI tools.
Since February, bitcoin experienced four consecutive months of price increases. BTC has gone up more than 168 percent, marking a new yearly high of $8,950 today.
Bitcoin Technical Analysis
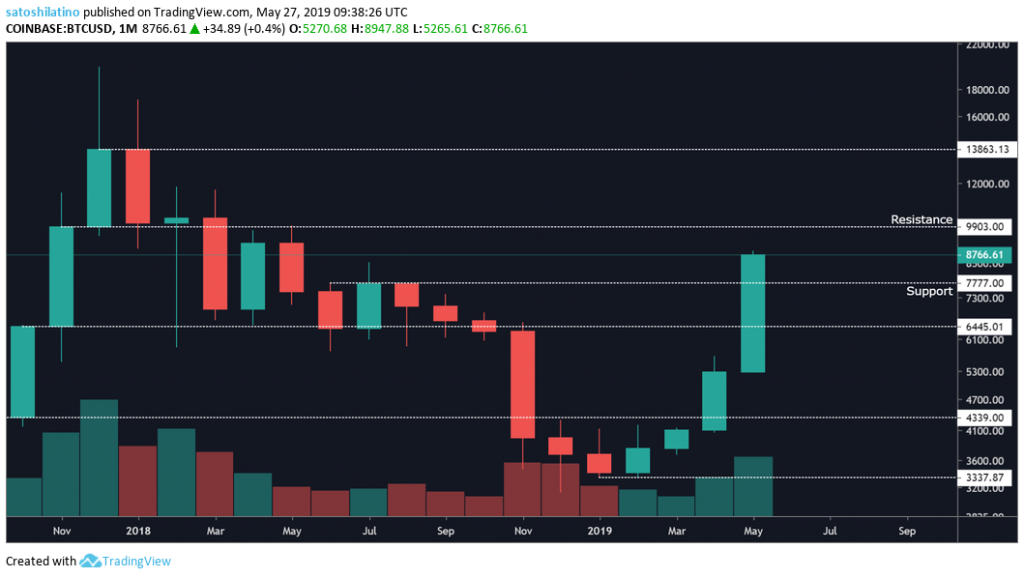
On the 1-month chart, a series of support and resistance levels based on historical data can be drawn. These price points have acted as barriers, preventing the price action of bitcoin from getting pushed up or down.
Now that BTC has broken above the $7,800 support level, it seems to be rising to test the $10,000 resistance level.
The $10,000 mark represents a significant part of BTC’s psychological market cycle. It could be expected that this price zone will act as a take profits point for many investors, which could influence a retrace to the $7,800 support level or lower. However, if this level breaks with significant volume the market could go through a fear of missing out (FOMO) phase with the potential to take bitcoin up to $14,000.
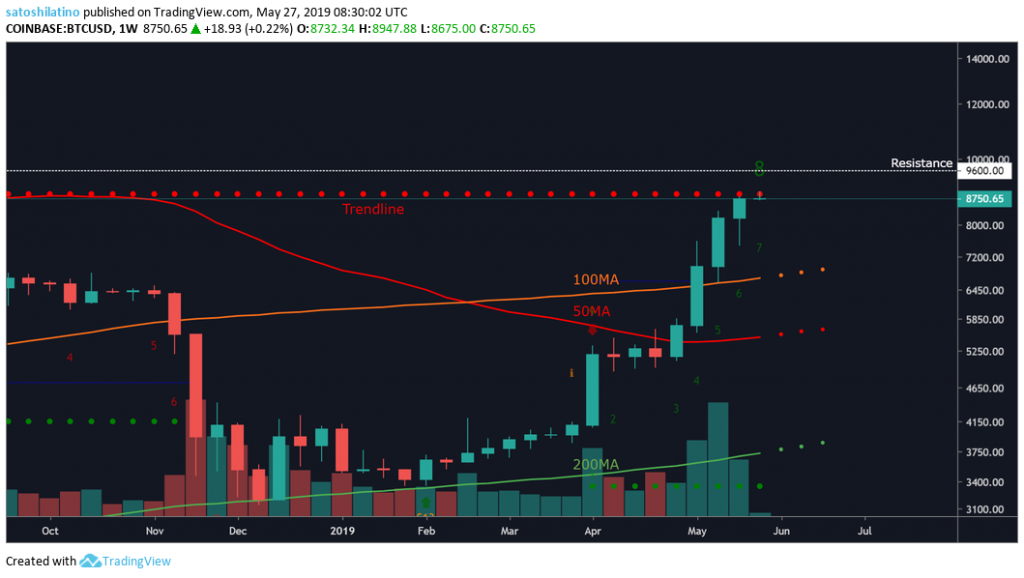
Based on the TD Sequential Indicator, bitcoin is sitting on a green eight candlestick and fighting the $8,800 trendline on the 1-week chart. Even though this indicator will probably give a sell signal next week with a green nine, breaking above the trendline and the $9,600 resistance level could be considered a strong bullish signal.
If the pioneer cryptocurrency fails to break above the resistance zone ahead, it could pullback to any of the support points given by the 100, 50 and 200-week moving averages.
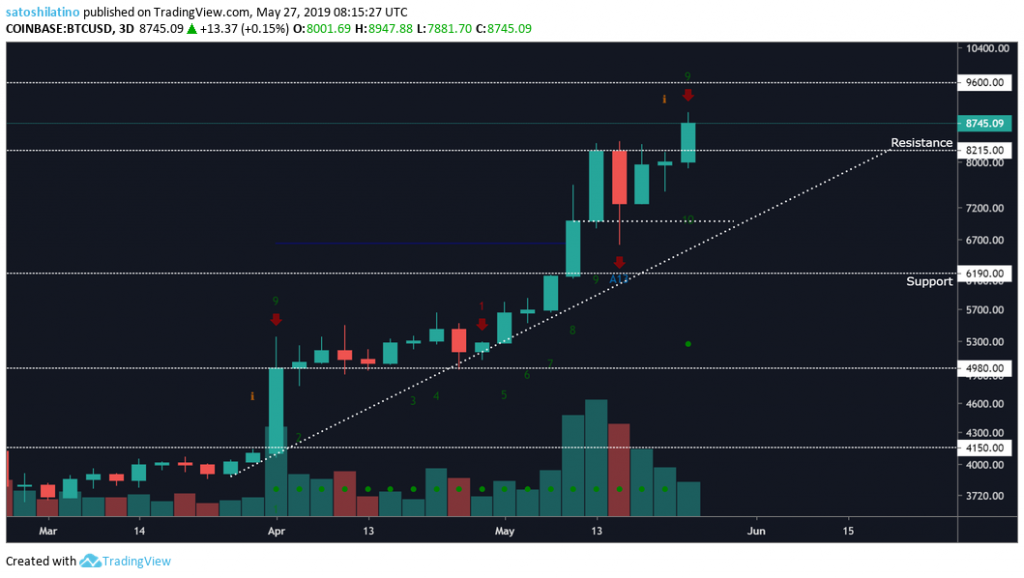
On the 3-day chart, the $8,200 resistance level was holding the price of BTC from going higher for twelve days. Now that this level has been broken with significant volume bitcoin is reaching new yearly highs and could be on its way to test the $9,600 resistance point given by this chart.
Although the bullish trend has been strong, the TD Sequential Indicator is signaling a pullback with a green nine. This signal could materialize on May 28 and a correction could be expected for a healthy continuation of the trend. If the retrace occurs, the support price points to watch out for are $7,000, $6,200, and $5,000.
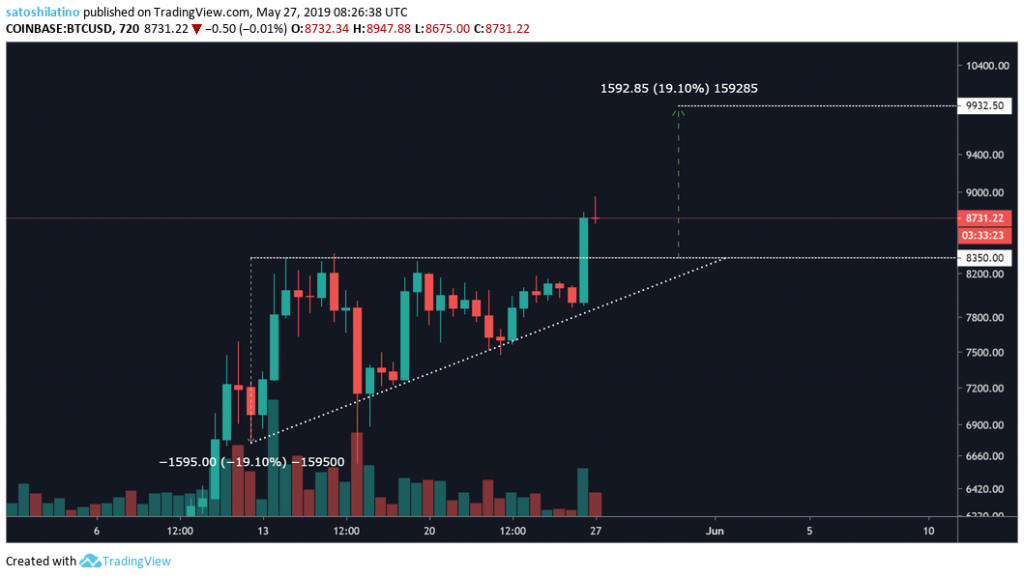
The ascending triangle that was forming on BTC’s 12-hour chart broke out to the upside indicating a continuation of the bullish trend. Based on this pattern, bitcoin could move up another 19 percent from the breakout point of $8,350.
Overall Sentiment
Bitcoin remains bullish across all major charts and it seems to be on its way to the $10,000 pivot point. The 1-week and 3-day charts are giving signs of bullish trend exhaustion, which could indicate that after reaching the next resistance point bitcoin could consolidate once again or correct.