Analyst: Bitcoin re-accumulation phase has begun, but it must drop to this key price first
Cover art/illustration via CryptoSlate. Image includes combined content which may include the use of AI tools.
The Bitcoin price tends to move in a trend that deals maximum pain for both bulls and bears in the market — and this time is seemingly no different.
Based on previous fractals, one popular cryptocurrency technical analyst said that the Bitcoin price is more likely to pull back to the low $5,000s to establish a new short-term bottom.
Why are fractals important for Bitcoin?
In extended bear or bull markets, the Bitcoin price tends to move in fractals. The BTC price likes to establish a large range and several smaller ranges within it, and touch both tops and bottoms multiple times within different timeframes.
A fractal often forms after the Bitcoin price achieves a short-term high because it brings more uncertainty into the market. Traders start to become fearful and cause more intense pullbacks to occur.
The reaccumulation phase of Bitcoin has begun after the price dropped to as low as $6,410 and demonstrated a clear inverse head and shoulders (IHS) formation in a large time frame. An IHS is a traditional structure in technical analysis that indicates the formation of a short-term bottom.
However, in early 2018, the Bitcoin price formed an IHS and rallied upwards. Eventually, the upsurge resulted from the IHS broke down which then led to bitcoin testing the low $3,000s area in December 2019.
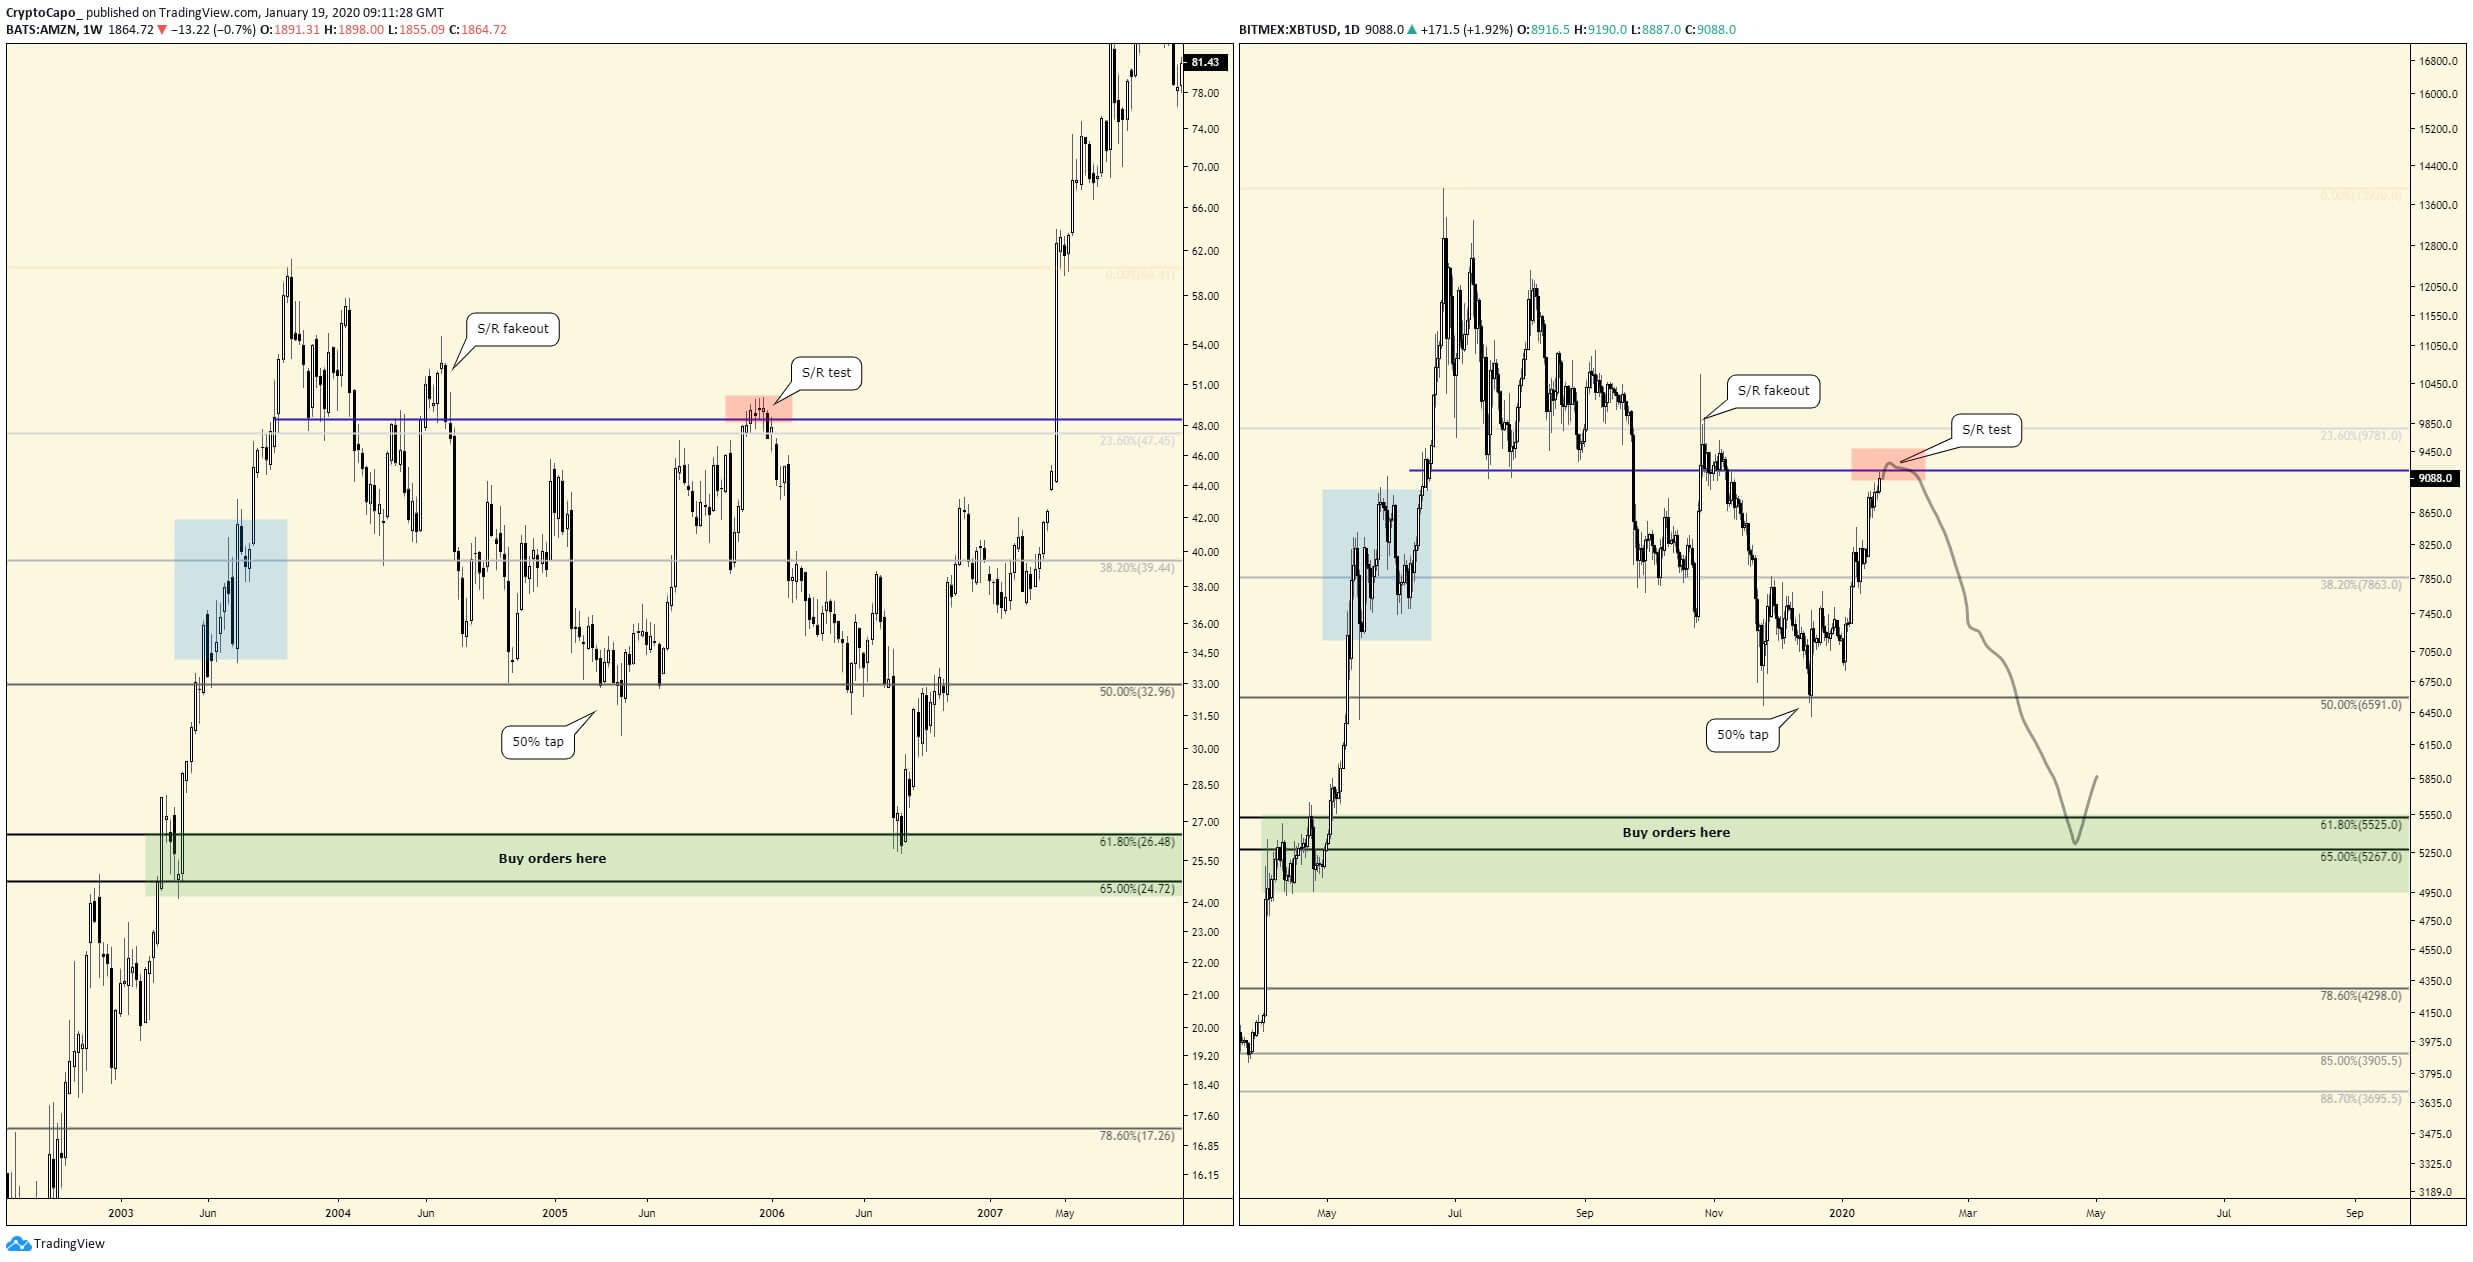
As seen above, the Bitcoin price was rejected at $9,200. The $9,200 to $9,400 range was considered a heavy resistance area and if it is confirmed as a short-term top, it paves the way for a deeper pullback to the $6,000s.
— Hsaka (@HsakaTrades) January 22, 2020
The opposing bullish case
Although it has been volatile in the past week, the Bitcoin price has been unable to move out of a tight range between $8,500 to $8,700. Every move up was met with a significant sell-off and every move down was met with large buying demand.
In a phase wherein traders are seeking a clear direction either to the upside or the downside, it opens BTC to potential trend reversals.
As emphasized by prominent cryptocurrency trader DonAlt last week, a close over $9,500 by Bitcoin at the end of January would indicate a reversal to the upside.
It may indicate the start of a new extended rally, breaking out of a key resistance level and heavily traded zones. The trader said:
“If this is a bear market rally, it ends this month. If it's a bull market rally you better be positioned. The monthly close is gonna be fun to observe, it's either gonna be shattered bear or bull dreams.”
After four days of uncertainty and tightly traded ranges, the price of Bitcoin is at a critical juncture that could establish the direction it goes over the next three to six months. There is also a possibility that there is no clear direction until the end of January, right before the monthly close.