Explore CryptoSlate’s Institutional Playbook, a 3-part guide series on exchange due diligence, crypto-as-a-service, and token listing strategy for institutional teams.
Explore CryptoSlate’s Institutional Playbook, a 3-part guide series on exchange due diligence, crypto-as-a-service, and token listing strategy for institutional teams.
The ongoing market instability has put a spotlight on monetary policies across the world. Investors and analysts have long warned about the shortsightedness of extreme quantitative easing during the COVID-19 pandemic, correctly predicting its negative effects on the market.
Since 2020, a considerable portion of the global market has been focused on central banks, as their actions and decisions seem to have been the biggest driver of market changes in the past three years. This was most obvious in the U.S., where the Federal Reserve has been directly responsible for volatility across crypto and the traditional financial market.
Investors and traders have been timing the market according to FOMC meetings anticipating interest rate rises and following the Fed’s balance sheet trends to determine the amount of liquidity in the market.
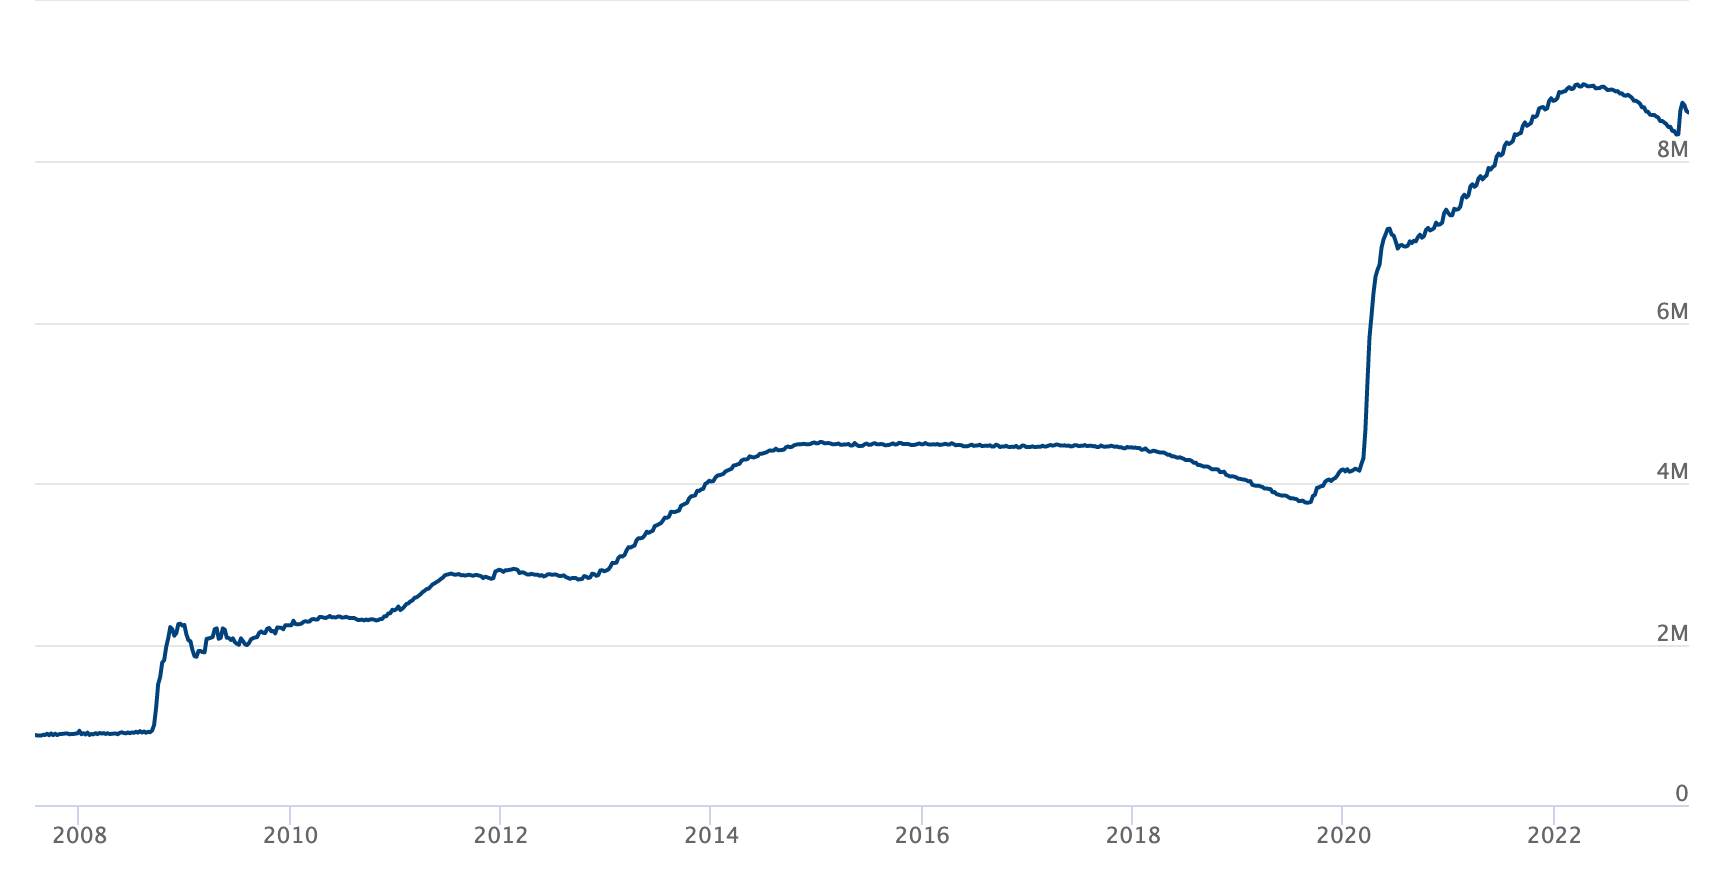
Graph showing the Federal Reserve’s balance sheet in millions of dollars from 2008 to 2023 (Source: Federal Reserve)
This approach has been relatively successful. Major market volatility correlated with brief drops in the Fed’s balance sheet. FOMC meetings were always followed by notable market movement, serving as a solid gauge for unpredictability.
However, this rather binary approach to market analysis has many shortfalls. Most notably, the financial market in the U.S. is too complex to be fully understood just through the Fed’s balance sheet and interest rates.
In this report, CryptoSlate dives deep into net liquidity, an overlooked metric representing the actual amount of money available in the economy, to determine its effects on the market.
Size doesn’t matter - Why the Fed’s balance sheet isn’t the main driver of markets
The Federal Reserve’s balance sheet’s size was a relatively unimportant indicator until the 2008 financial crisis. To combat the effects of the crisis, the Fed embarked on a historically unprecedented bout of quantitative easing, drastically increasing its balance sheet.
The rapidly increasing liabilities provided economists and analysts valuable insight into the Federal Reserve’s market intervention scale. It also turned out to be one of the biggest market drivers, as QE and QT policies visible through the balance sheets went on to sway the market.
Historically, significant increases in the Federal Reserve’s balance sheet led to market downturns. These downturns were mostly short-lived, as they corrected into long-term growth across almost all assets. Nonetheless, the inverse correlation upon large spikes in the balance sheet was virtually inevitable.
That is, until 2020, when the Federal Reserve almost doubled the size of its balance sheet, adding $3.4 trillion between August 2019 and June 2020. After a minor decrease in July 2020, the Fed added another $2 trillion the following year. The Fed’s balance sheet peaked in April 2022 at $8.95 trillion and currently stands at $8.62 trillion.
Between March and July 2020, over $1.4 trillion was provisioned to the U.S. Treasury, representing an almost fivefold increase to its primary operational account in five months.
Graph showing the general account of the U.S. Treasury between 2007 and 2023 (Source: St. Louis Fed)
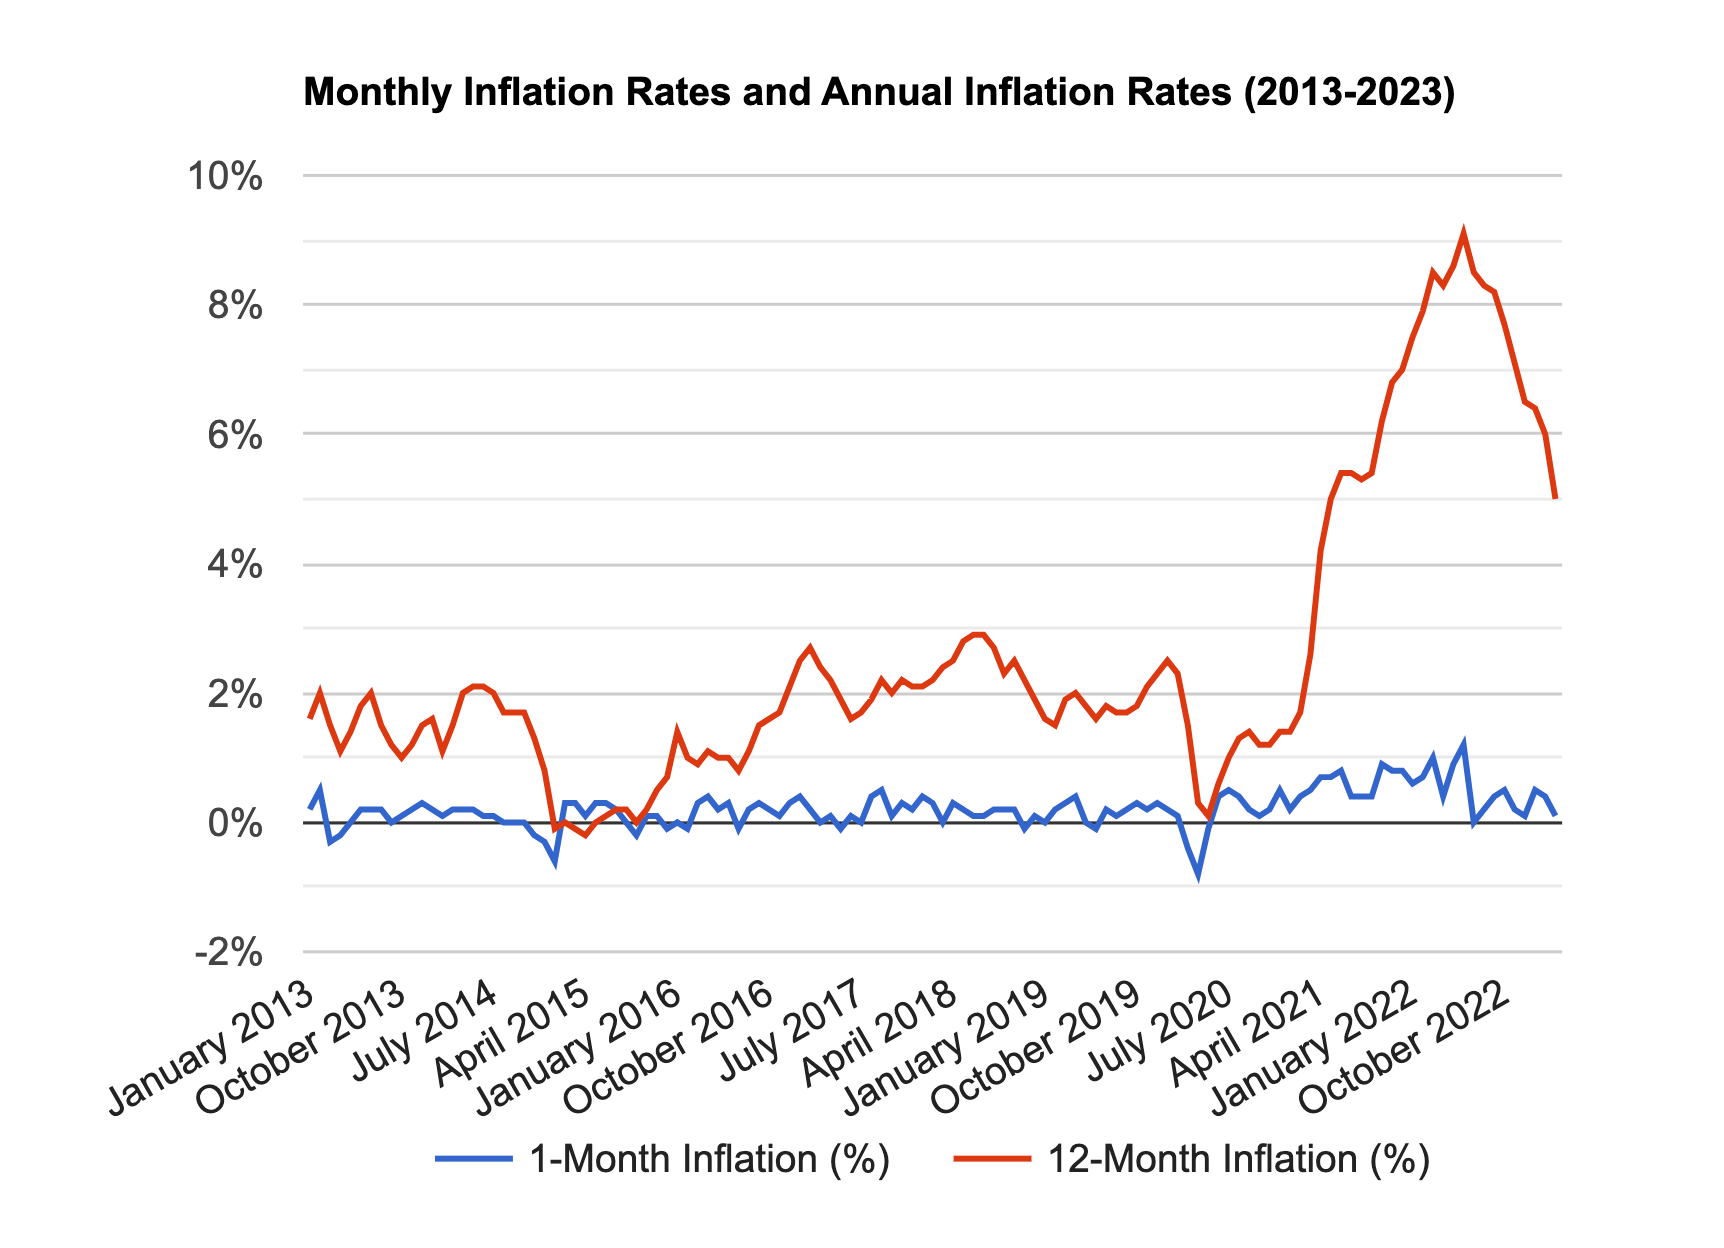
This unprecedented increase in liquidity caused inflation to skyrocket, reaching 9.1% in June 2022.
Graph showing the monthly and annual inflation rates in the U.S. between 2013 and 2023 (Source: U.S. Inflation Calculator)
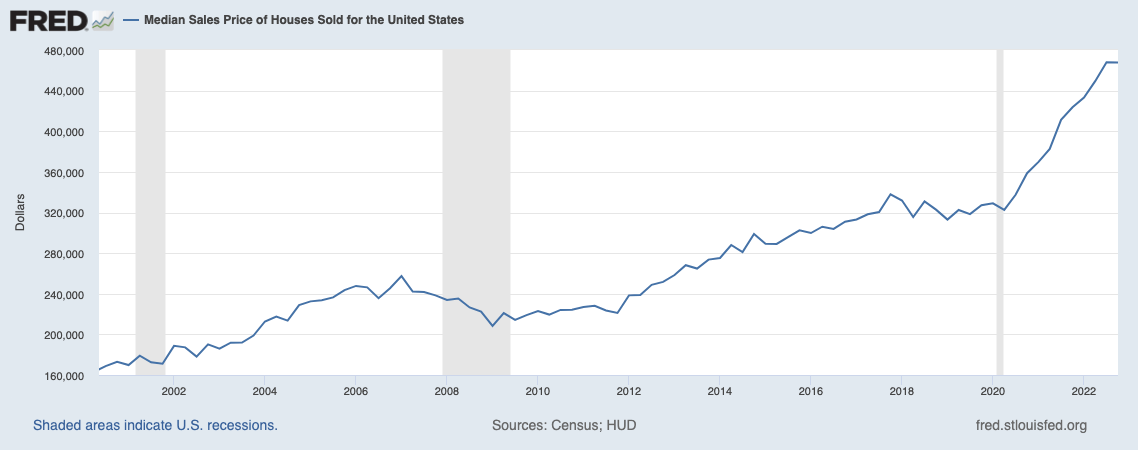
The median price for houses in the U.S. increased by over 45% between 2020 and 2022.
Graph showing the median sales price of houses sold in the U.S. between 2000 and 2023 9Source: St. Louis Fed)
However, rising inflation and living costs did little to curb market growth.
The financial market in the U.S. quickly recovered from the historical crash in March 2020 and went on to post all-time highs alongside the peak of the Fed’s balance sheet.
This led many analysts to hypothesize that the Fed lost its position as the main market driver in the U.S. Instead, it was replaced with the excess liquidity circulating in the economy.
Liquidity has long been one of the main indicators of a company’s health. Investors have used liquidity as a measure of a company’s ability to pay short-term obligations and make new investments without taking up additional financing
A company’s net liquidity is calculated by deducting current liabilities from its liquid assets, where liabilities usually include long-term debt, accounts payable, and income tax payable.
Applying this principle to the Federal Reserve allows us to determine its net liquidity and analyze its effect on the market.
Calculating net liquidity
There still doesn’t seem to be a consensus on how to calculate the Fed’s net liquidity. However, most agree that the best estimate of net liquidity requires deducting the amount in the Treasury General account and the value of overnight reverse repurchase agreements from the Fed’s balance sheet.
To understand why these two metrics become important when determining net liquidity, we must dive deeper into the Fed’s attempts to take back control over the market.
Until 2020, the Fed’s balance sheet and the Federal funds rate have been the most important indicators of market movements.
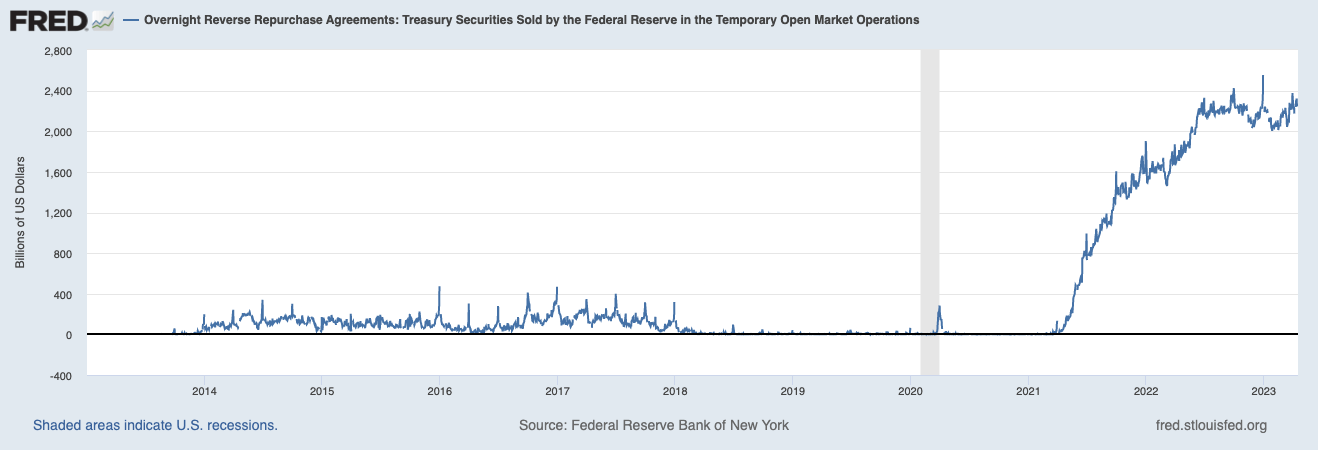
However, in 2020 the Fed began gradually decreasing the amount and value of outstanding Treasury bills. A shortage in the most popular short-term debt obligation created a hole in the U.S. market, which was quickly filled with reverse repurchase agreements (RRPs).
Between April 2021 and April 2023, the aggregated daily amount value of reverse repo transactions sold by the Fed increased by almost 6,300%.
Graph showing the value of the Fed’s overnight reverse repo agreements from 2013 to 2023 (Source: St. Louis Fed)
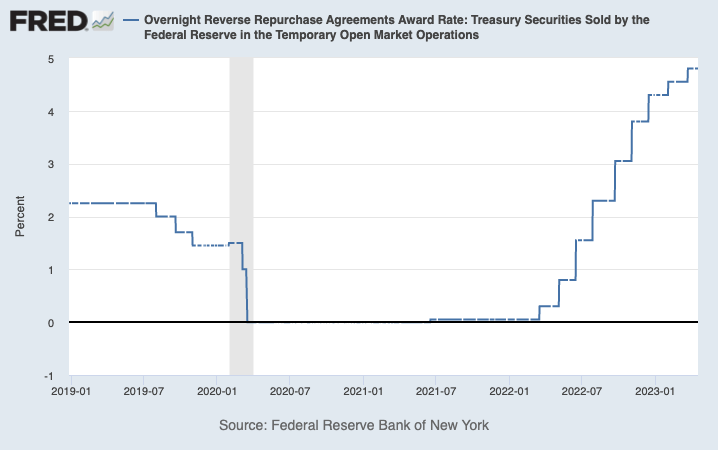
As the value of reverse repo transactions increased, so did the interest rate. The Fed’s award rate for overnight reverse repo agreements increased by 9,500% between March 2022 and March 2023, spiking from 0.05% to its current value of 4.80%.
Graph showing the overnight reverse repo agreement award rate from 2019 to 2023 (Source: St. Louis Fed)
The changes in the value of reverse repo agreements and the balance of the U.S. Treasury General account have been significantly larger than the changes seen in the Fed’s balance sheet.
While the total value of the Federal Reserve’s balance sheet doubled since 2020, the Treasury general account increased by fivefold. The daily amount value of reverse repo agreements increased 64 times in two years.
These jumps have been more in line with the broader market, which saw historical spikes throughout 2021 and 2022.
Tracking market movements with net liquidity
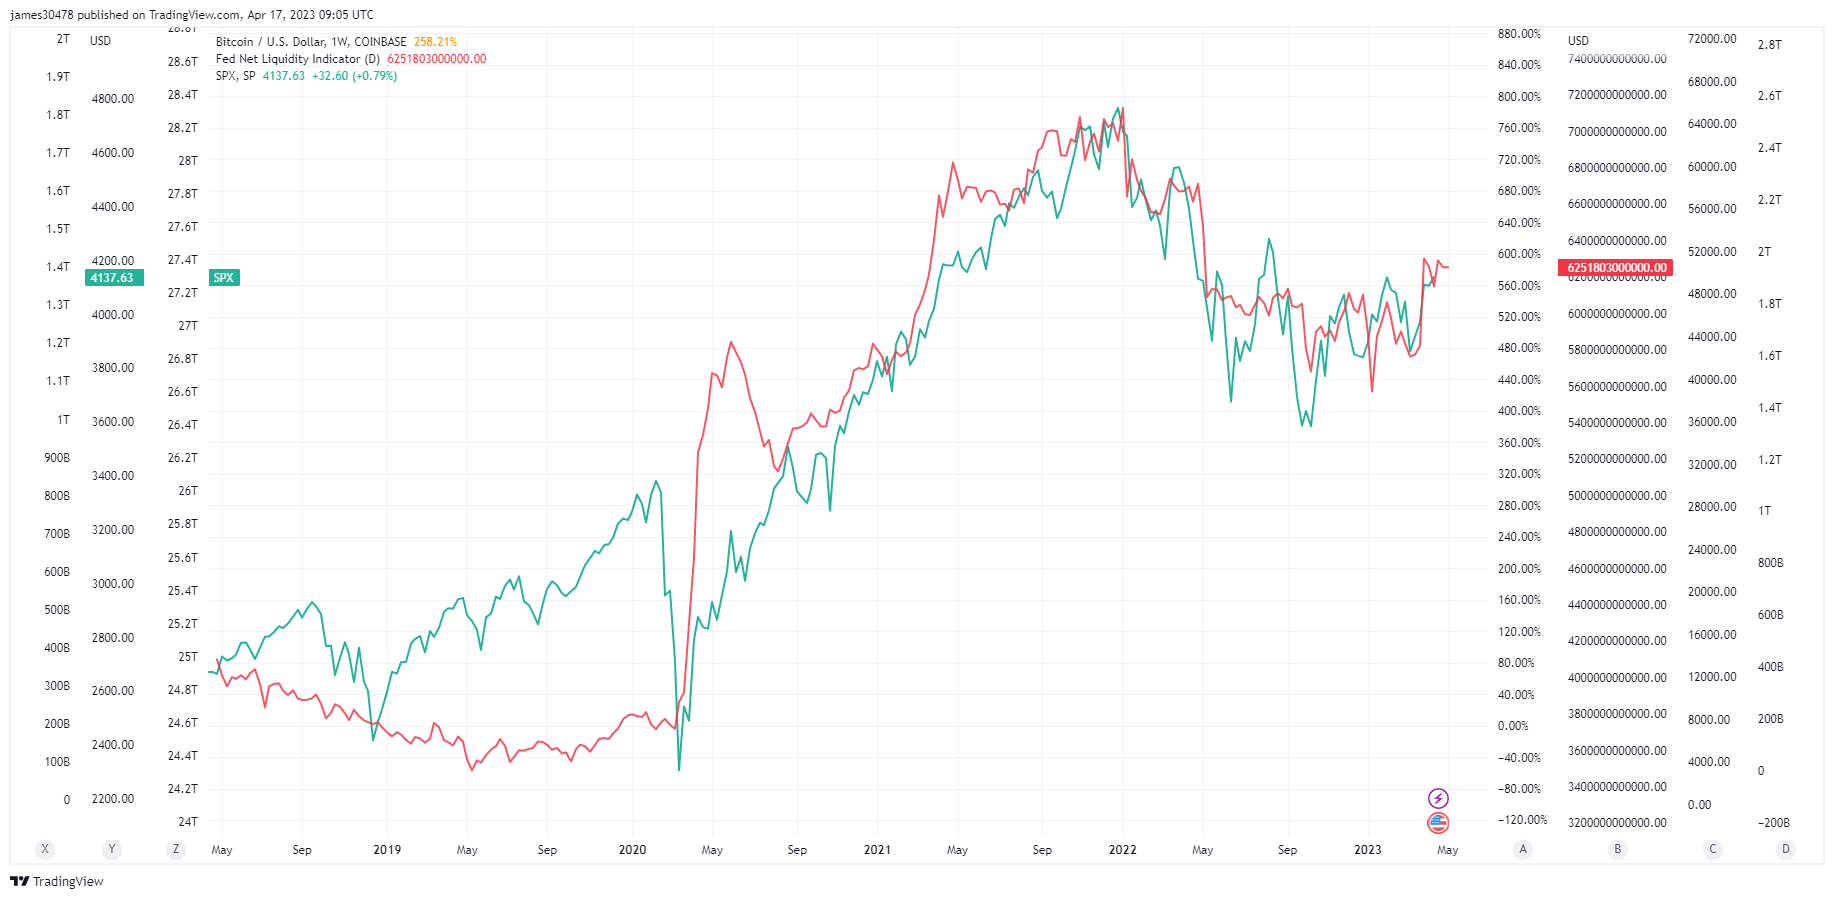
The importance of net liquidity becomes evident in its correlation to asset prices. CryptoSlate analysis found an extremely high correlation between the Fed’s net liquidity and the S&P 500.
Until late 2020, net liquidity had a relatively low correlation to the market, with asset prices moving independently. The correlation spiked at the end of 2020, with spikes in liquidity driving asset prices up.
Graph showing the correlation between the S&P 500 and the Federal Reserve’s net liquidity indicator from 2018 to 2023 (Source: Trading View)
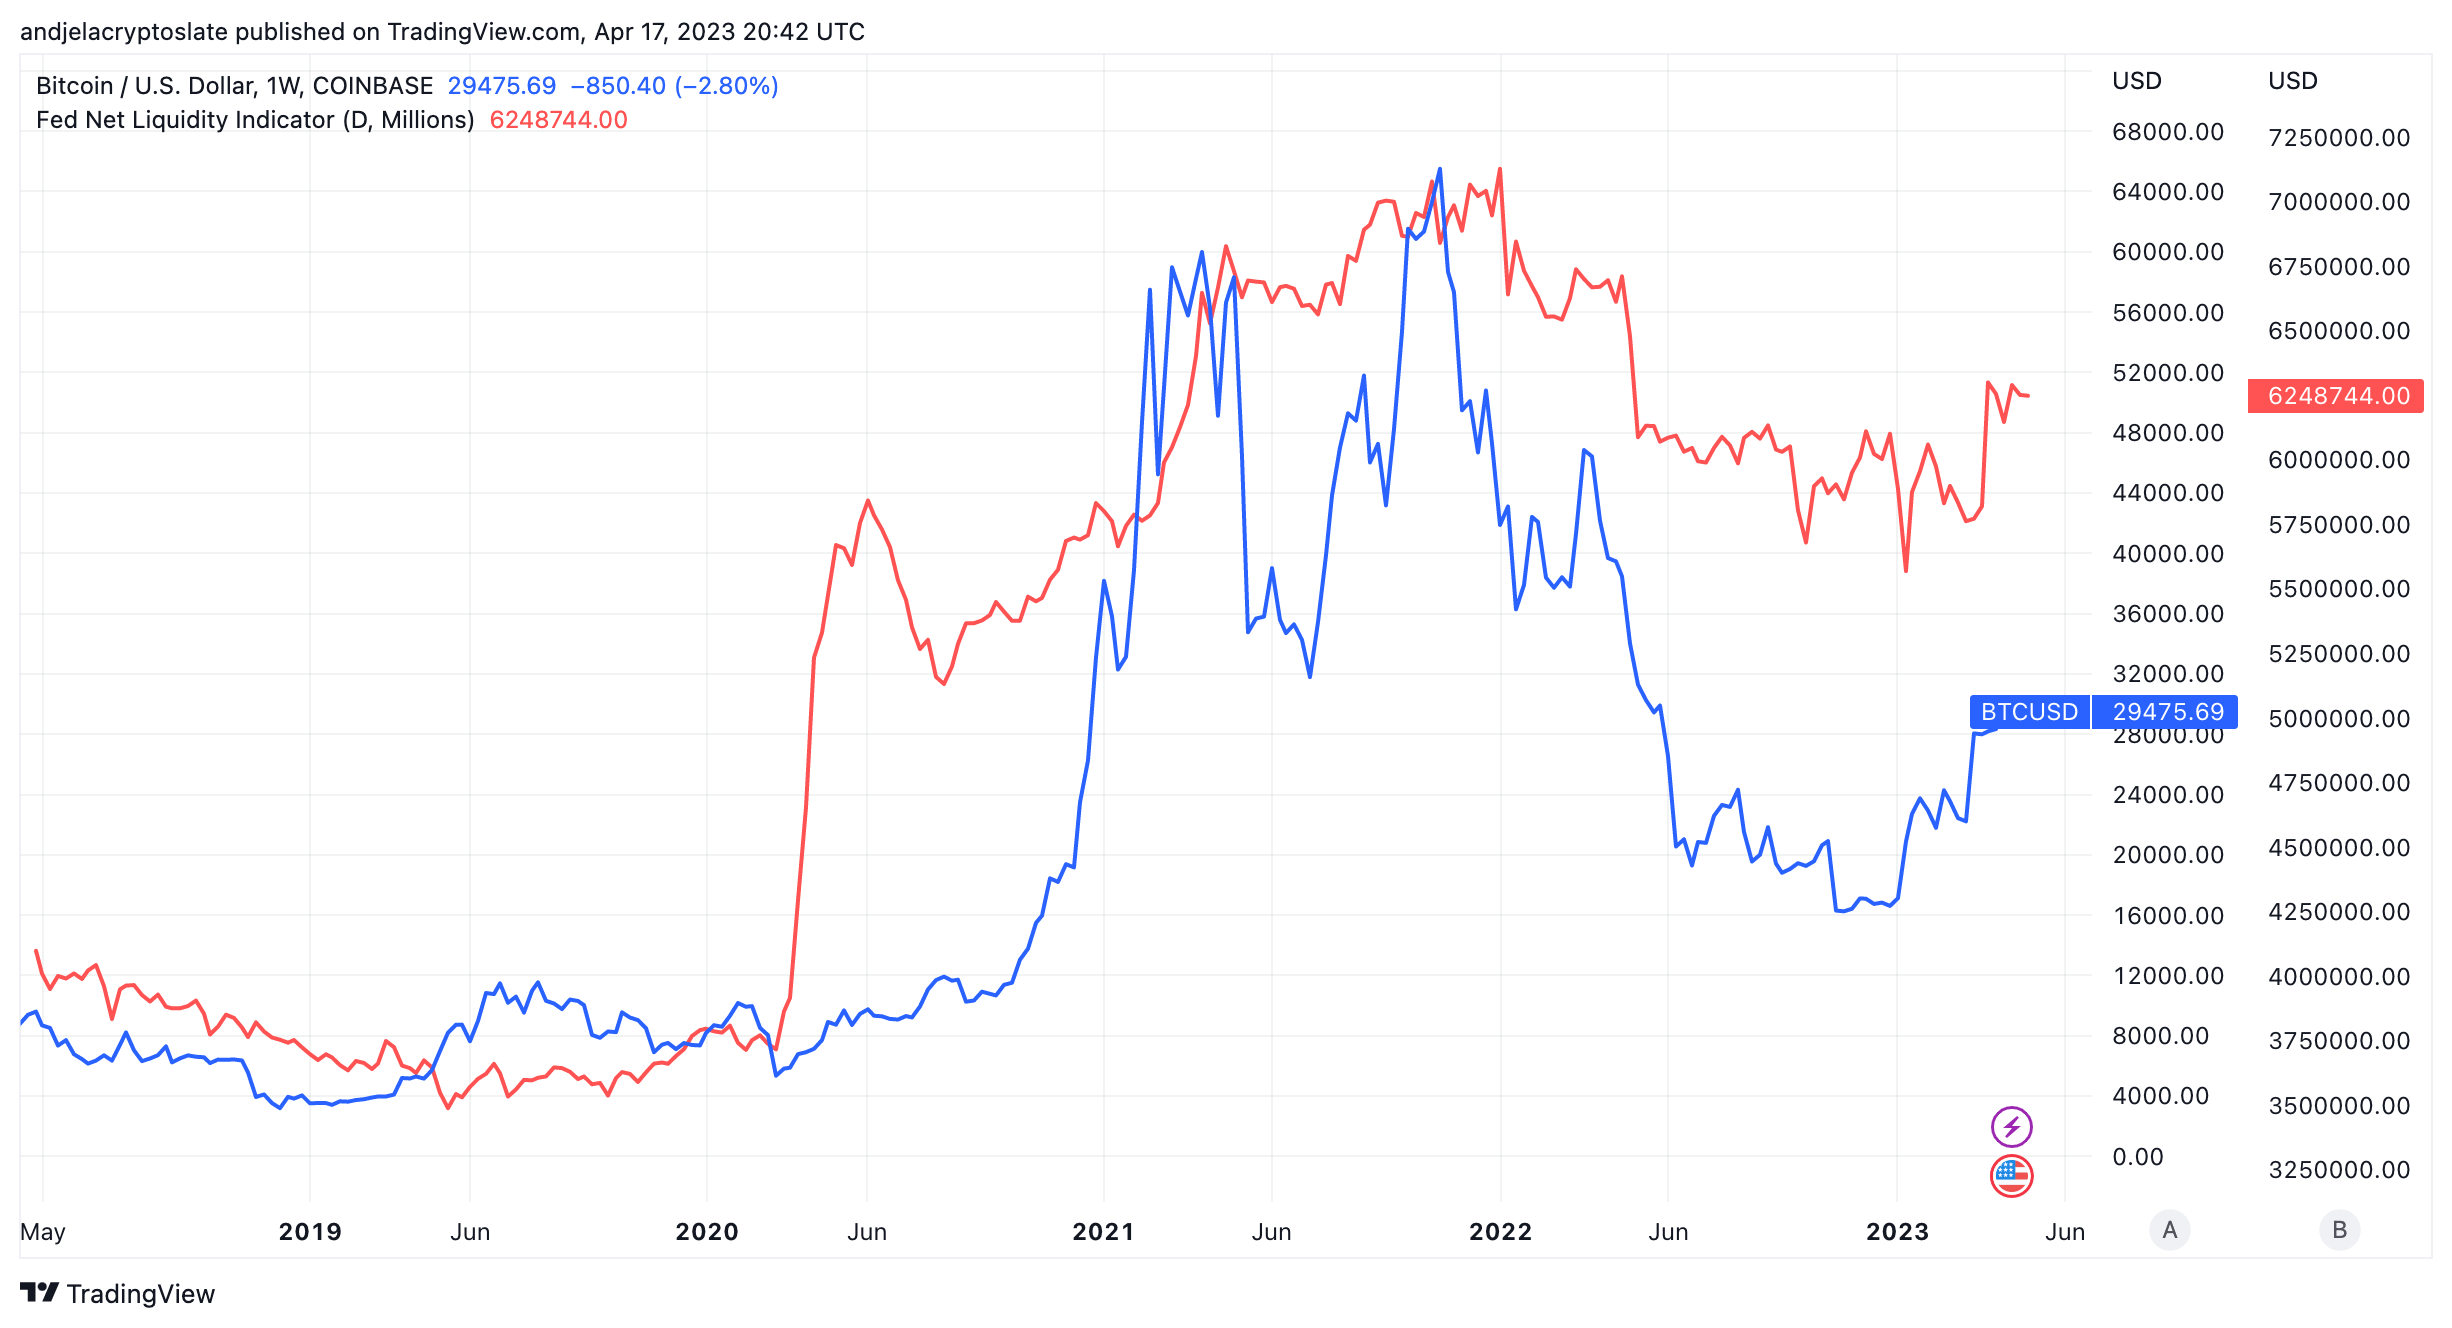
The same trend can be observed with Bitcoin (BTC), whose correlation with net liquidity began tightening around the same time.
Graph showing the correlation between Bitcoin (BTC) and the Federal Reserve’s net liquidity indicator from 2018 to 2023 (Source: Trading View
Conclusion
Being heavily correlated with past market movements, net liquidity can also be used to predict future ones.
CryptoSlate’s analysis of net liquidity showed that changes in the Fed’s liquidity took time before they manifested in the market. The reaction was usually offset between one and two weeks, depending on the asset and the change velocity.
Bitcoin reacted much quicker to drops and spikes in liquidity, usually experiencing movement around a week after. The S&P500 was much slower, taking approximately two weeks to respond to changes in net liquidity.
And while it’s important to note that correlation doesn’t equal causation, this particular one could be beneficial when determining market movements. Barring new major black swan events like the collapse of Silicon Valley Bank and FTX, following changes in the Fed’s net liquidity could be a solid gauge for volatility in traditional markets and the crypto industry.