Explore CryptoSlate’s Institutional Playbook, a 3-part guide series on exchange due diligence, crypto-as-a-service, and token listing strategy for institutional teams.
Explore CryptoSlate’s Institutional Playbook, a 3-part guide series on exchange due diligence, crypto-as-a-service, and token listing strategy for institutional teams.
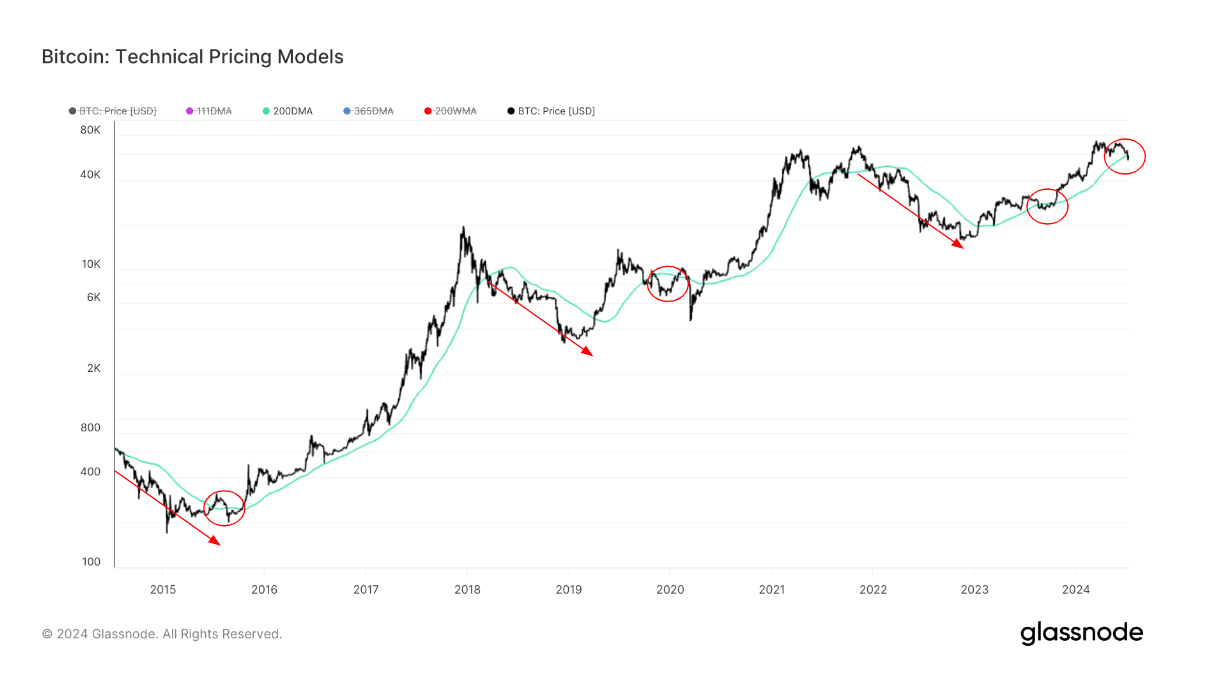
The 200-day Simple Moving Average (SMA) is a pivotal indicator in technical analysis, marking the transition between bull and bear markets. On July 4, Bitcoin dipped below this critical threshold for the first time since August 2023. The current 200-day SMA is at $58,720, and Bitcoin's price is hovering around $57,000.
Historically, Bitcoin has dipped below the 200-day SMA during bull markets, only to reclaim it and continue its upward trajectory. This pattern was evident before the 2016-2017 bull market, where Bitcoin fell below the 200-day SMA for three months before surging upward to start the bull market.
Similarly, during the 2018-2019 bear market, Bitcoin climbed above the 200-day SMA in mid-2019, fell back, and then ascended again. The COVID-19 pandemic briefly disrupted this trend, but without it, Bitcoin likely would have remained above the 200-day SMA.
In the 2022 bear market, Bitcoin reclaimed the 200-day SMA in early 2023, dipped below it in August, and stayed under until October before continuing its bull run. We now face a critical juncture: if Bitcoin can reclaim the 200-day SMA, it could signal the start of a new bullish phase.
The accompanying chart illustrates these historical trends, highlighting the importance of the 200-day SMA in Bitcoin's price movements. Notable points include the dips and subsequent recoveries in 2015, 2019, and 2023, highlighting the potential for a similar rebound if Bitcoin can rise above this key indicator again.