DEFINITION: The Spent Output Profit Ratio (SOPR) is computed by dividing the realized value (in USD) by the value at creation (USD) of a spent output. Or simply: price sold / price paid.
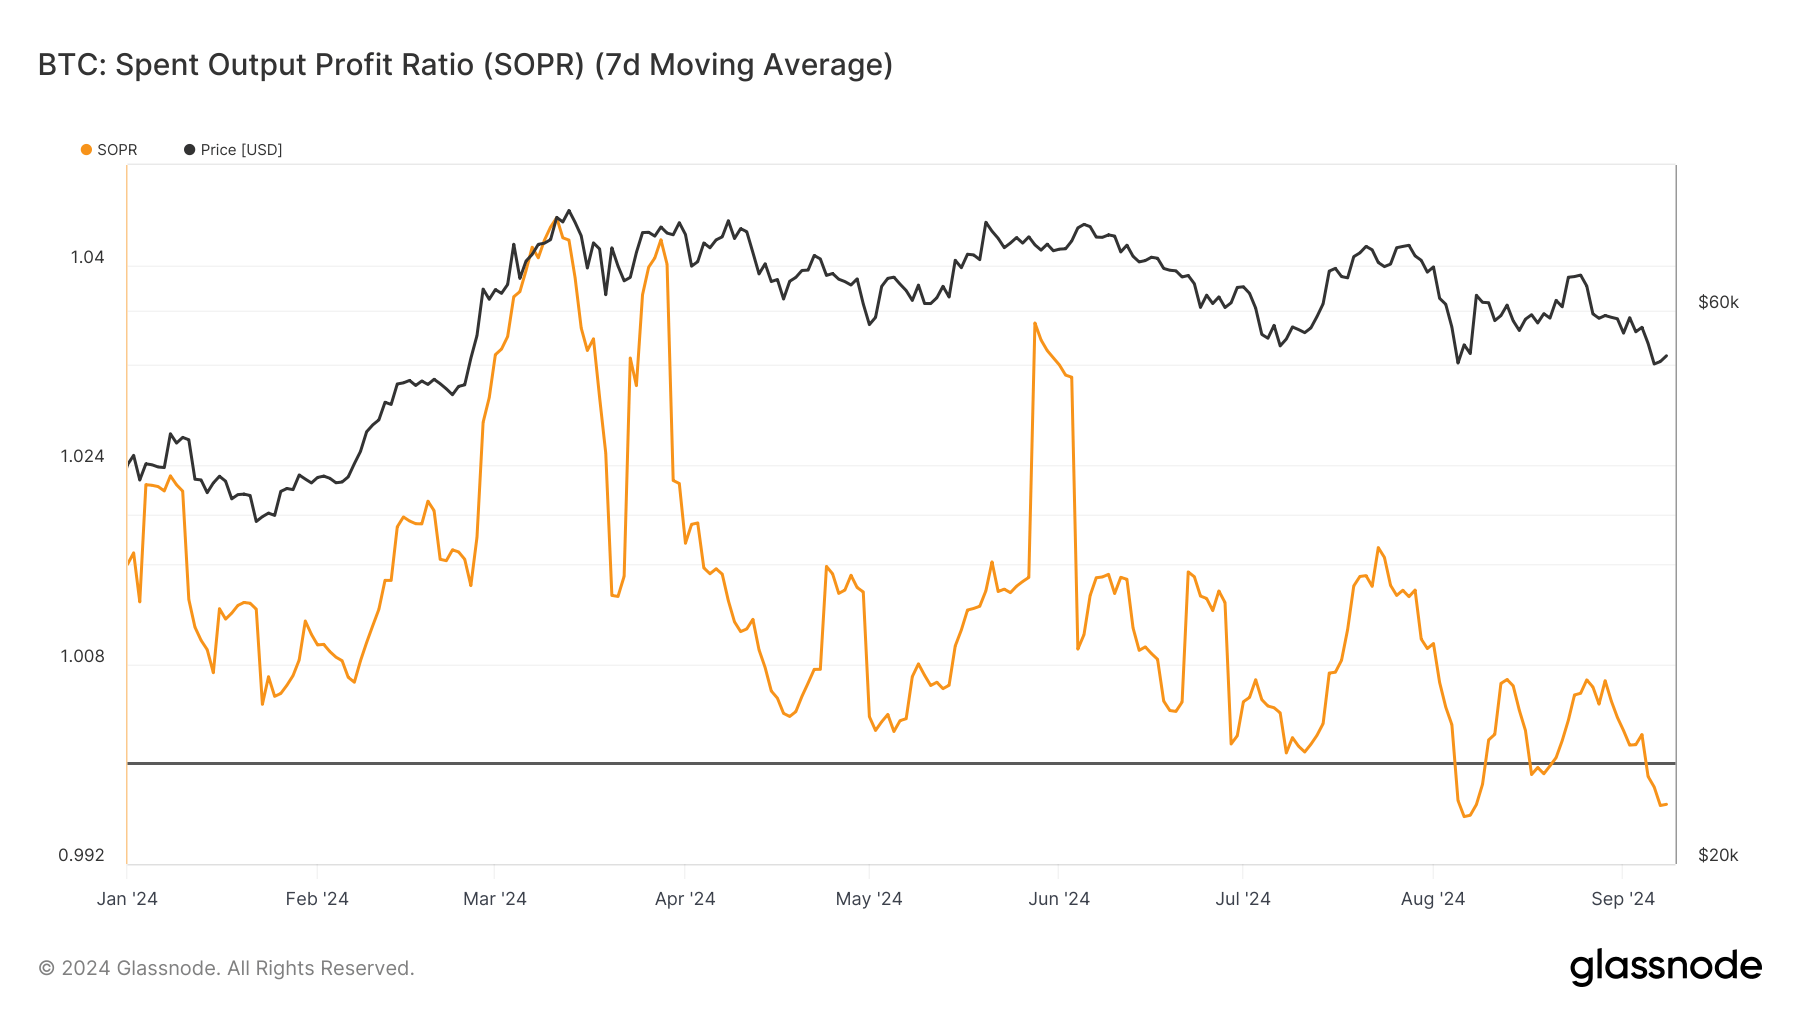
Bitcoin's 7-day moving average SOPR has fallen below 1.0, suggesting that a majority of spent outputs are being sold at a loss.
Historically, when SOPR drops below 1.0, it often reflects periods of market capitulation, as seen in early 2023 and late 2018. The recent decline comes despite the post-halving price stability between $25,000 to $30,000, signaling weakened market sentiment.
SOPR: (Source: Glassnode)
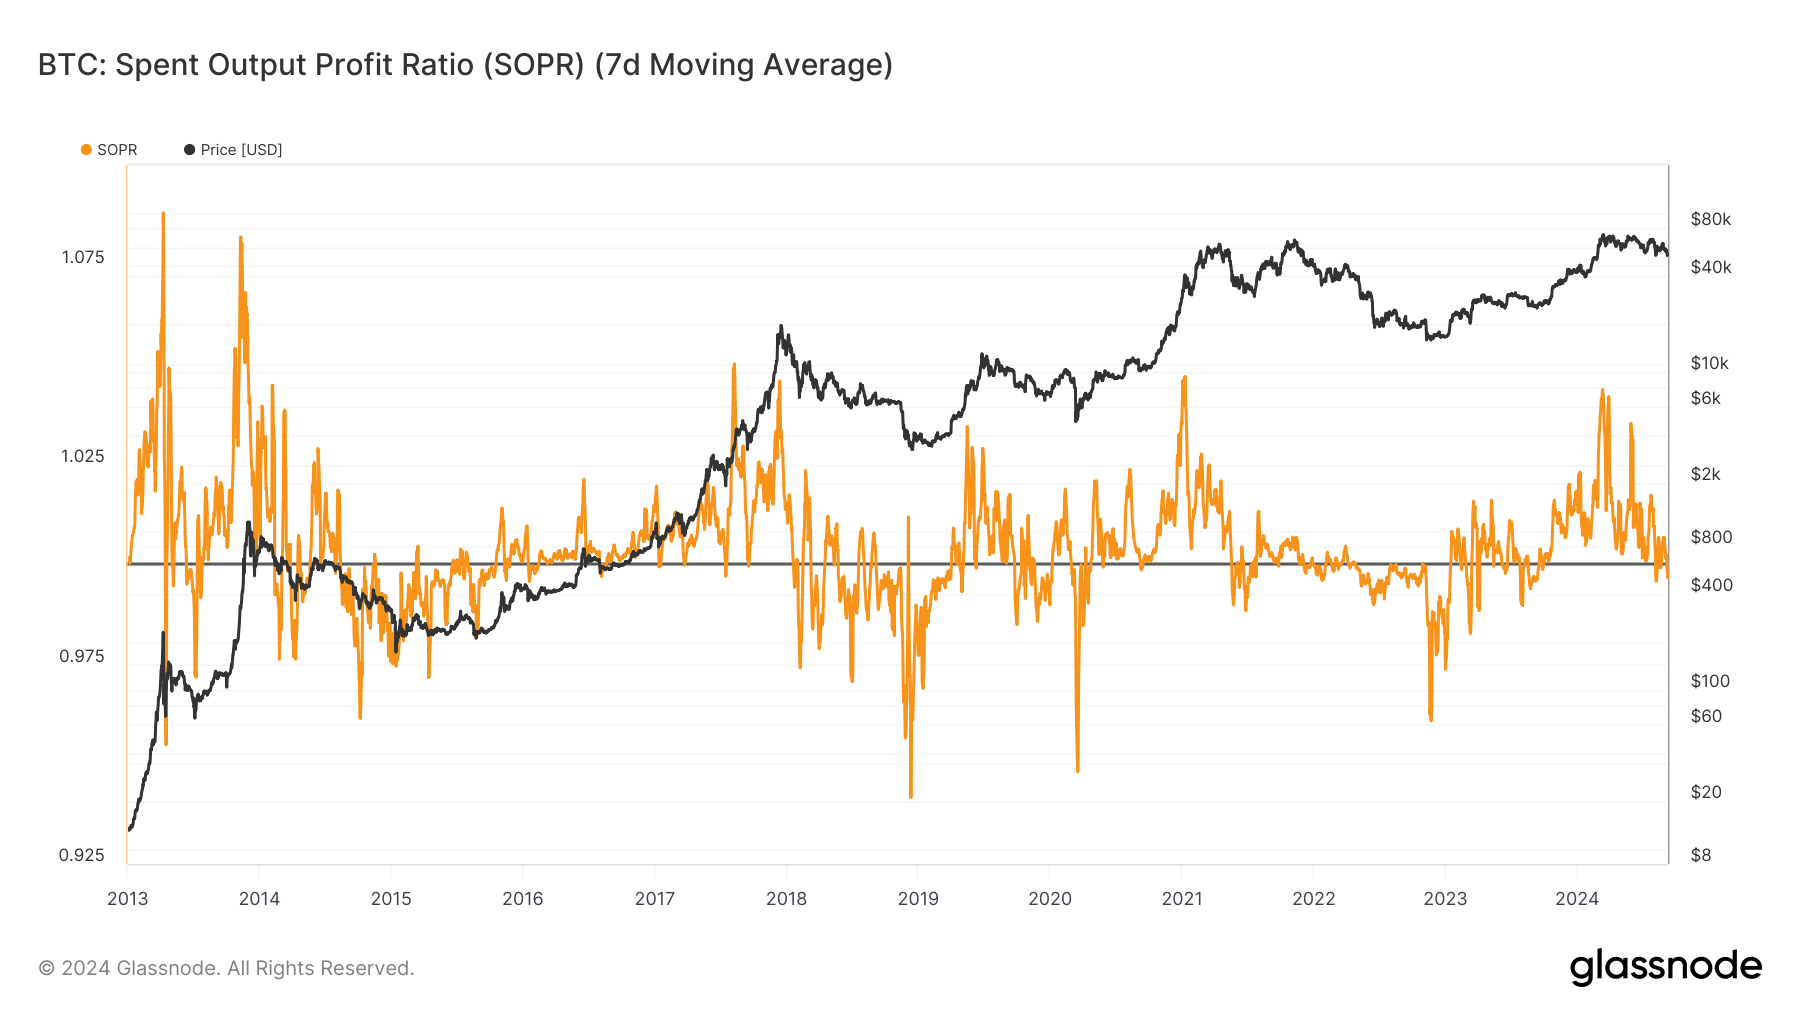
Comparing the current SOPR levels to prior cycles reveals similar patterns of investor behavior following major events. During these periods, SOPR tends to dip below 1.0 before market consolidation occurs, potentially paving the way for a price recovery.
The current decline parallels the bear market phases of 2018 and 2019, when prolonged periods of SOPR under 1.0 ultimately preceded a market reversal.