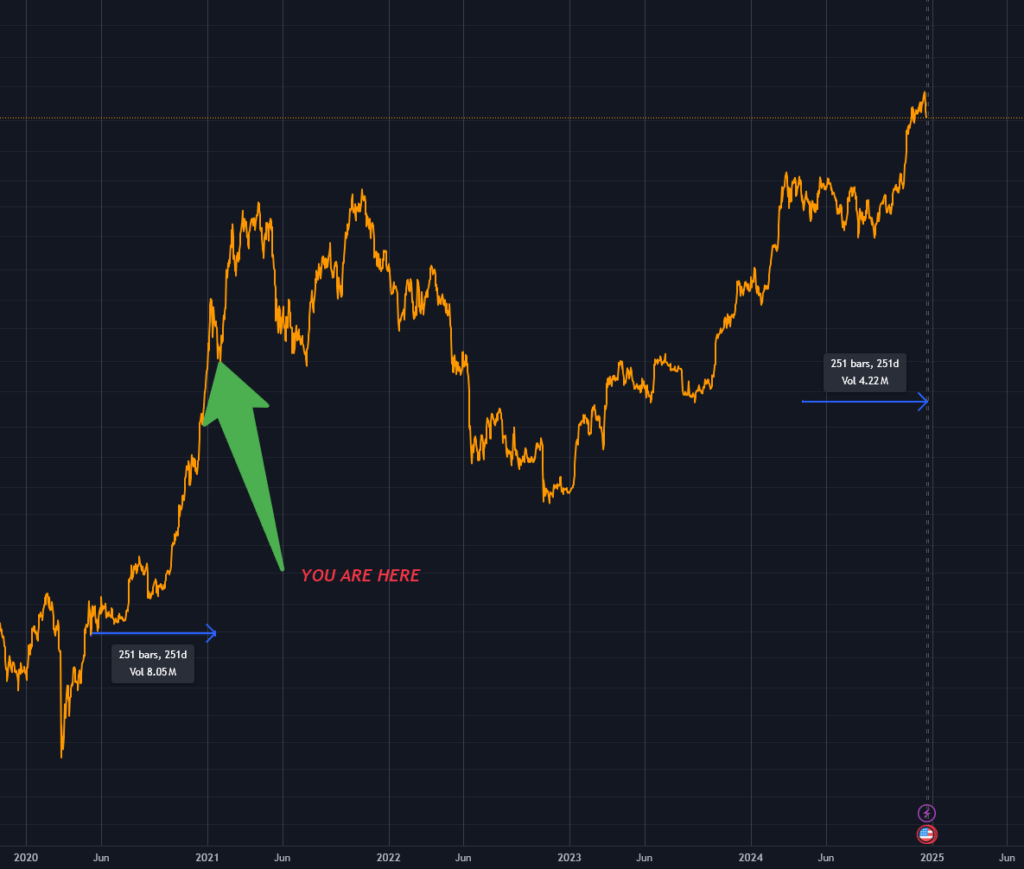
 Bitcoin pullback mirrors 2020 reversal 250 days post-halving, it then rose 140%
 Bitcoin’s price appears to be pulling back approximately 250 days after the April 2024 halving, aligning with patterns observed following the May 2020 halving.
Bitcoin has retraced around 13% over the past 48 hours from an all-time high of $108,600 to $94,700 as of press time.
Historical charts show a notable climb following the May 2020 event, which reversed briefly after about 250 days by around 30%. Following the retracement, Bitcoin increased by 140% over the next 290 days. The last cycle’s all-time high was 546 days after the halving.

The most recent Bitcoin halving took place in April 2024. Although the current pattern suggests a trajectory similar to prior cycles, past performance does not guarantee future price action.
A 30% drop would see Bitcoin go as low as $75,000, and a similar run from there would mean a final all-time high for this cycle of around $225,000 in October 2025. History is rarely repeated, but it often rhymes.
Market participants continue to monitor liquidity flows, network activity, and exchange order books to interpret any signals that align with the bullish sentiment coming out of the US. Satoshi Action recently produced a model that predicts Bitcoin will hit $1 million by 2027 based on global supply amid growing adoption of Bitcoin reserves.


