Bitcoin, Gold correlation nears 1 over past year, indicating a bottom
Bitcoin adoption increases as Bitcoin and gold achieve an 85% correlation since November 2021. Based on historical data, high correlation indicates a Bitcoin bottom.
Cover art/illustration via CryptoSlate. Image includes combined content which may include the use of AI tools.
Bitcoin (BTC) adoption has increased, and the largest cryptocurrency has become less risky as its correlation rate with gold reached 85% in the past year, which signals that a BTC price bottom could be near.
The correlation of assets measures how one asset moves compared to the other, and it is scored between 1 and 0. If both assets move in the same direction together, they'd be considered highly correlated, and their correlation rate would be 1. Similarly, if they move in opposite directions, their correlation rate would be 0.
The current correlation rate of Bitcoin and gold is at 0.85, which means that these assets move in the same direction with 85% accuracy.
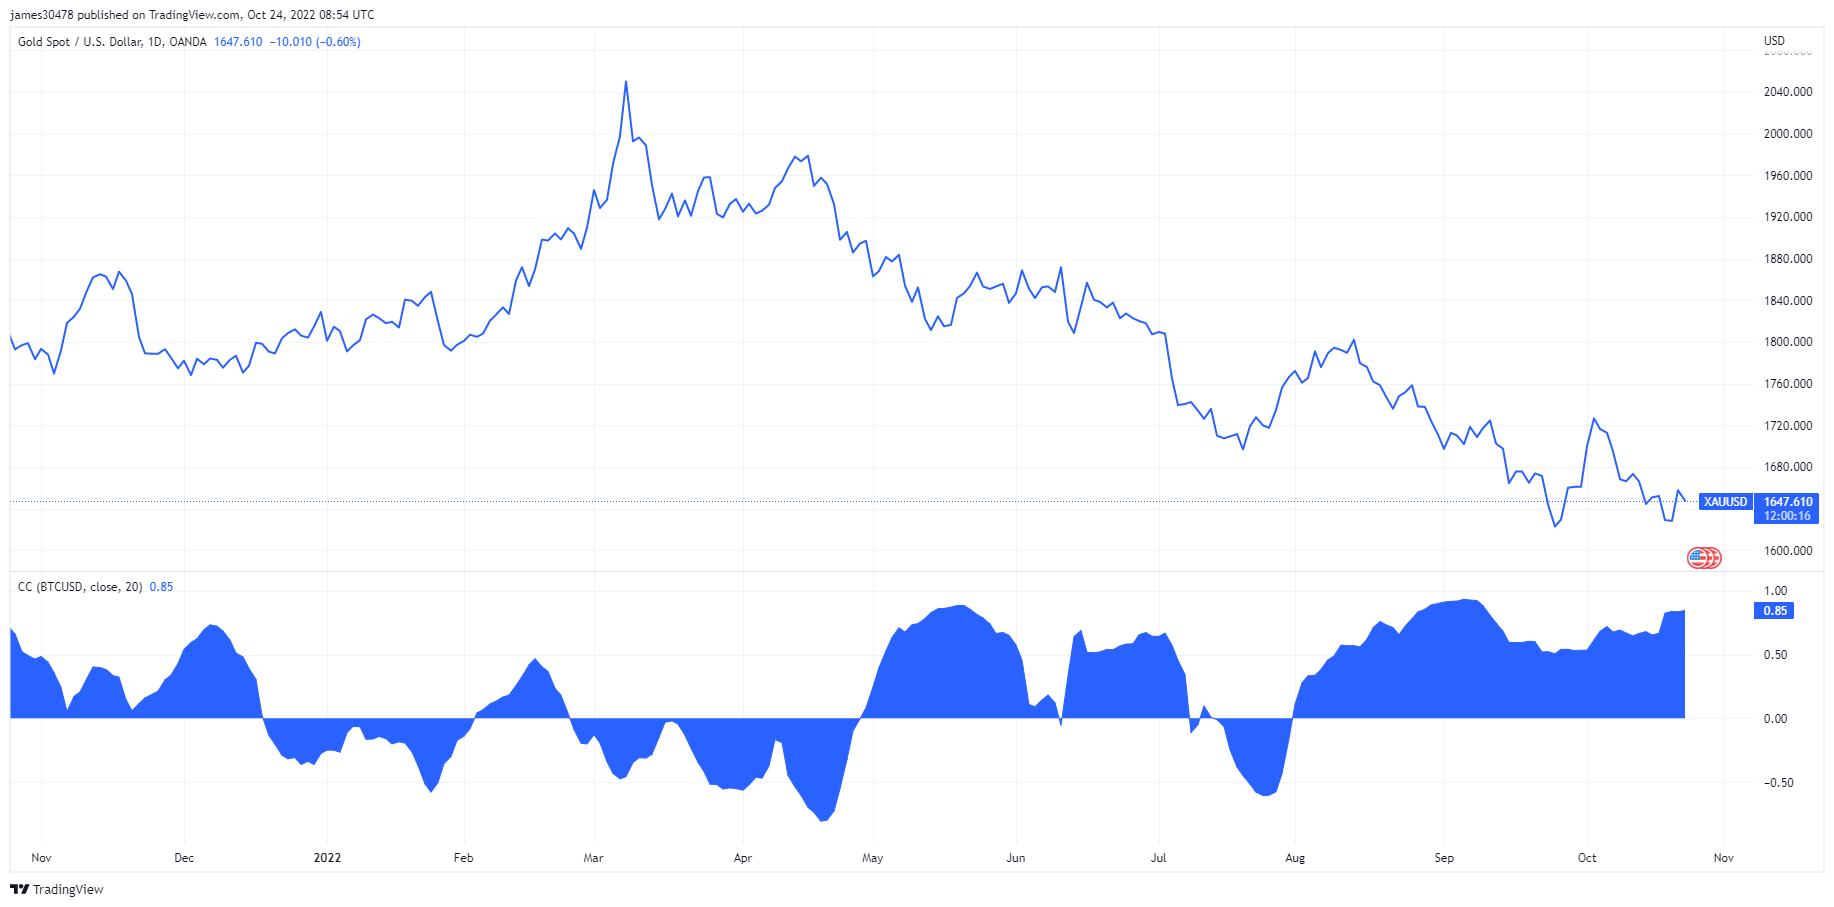
As the chart above also demonstrates, the price correlation of Bitcoin and gold has been above the 0.50 rate since early May, except for a short timeframe between mid-July and early August.
This increase in the correlation indicates that Bitcoin adoption has increased. Moving in the same direction as gold might mean that investors started seeing Bitcoin as digital gold, as their fundamentals are already similar.
Bitcoin mining company Argo's CEO, Peter Wall, mentioned this increase in adoption when the correlation rates started to increase. In an interview Wall gave on May 30, he referred to Bitcoin as Gold 2.0 and said that Bitcoin's limited cap resembled the limited nature of gold.
Nearing Bitcoin bottom
Historical data on the Bitcoin and gold correlation suggests that times of high correlation presage a price bottom for Bitcoin.
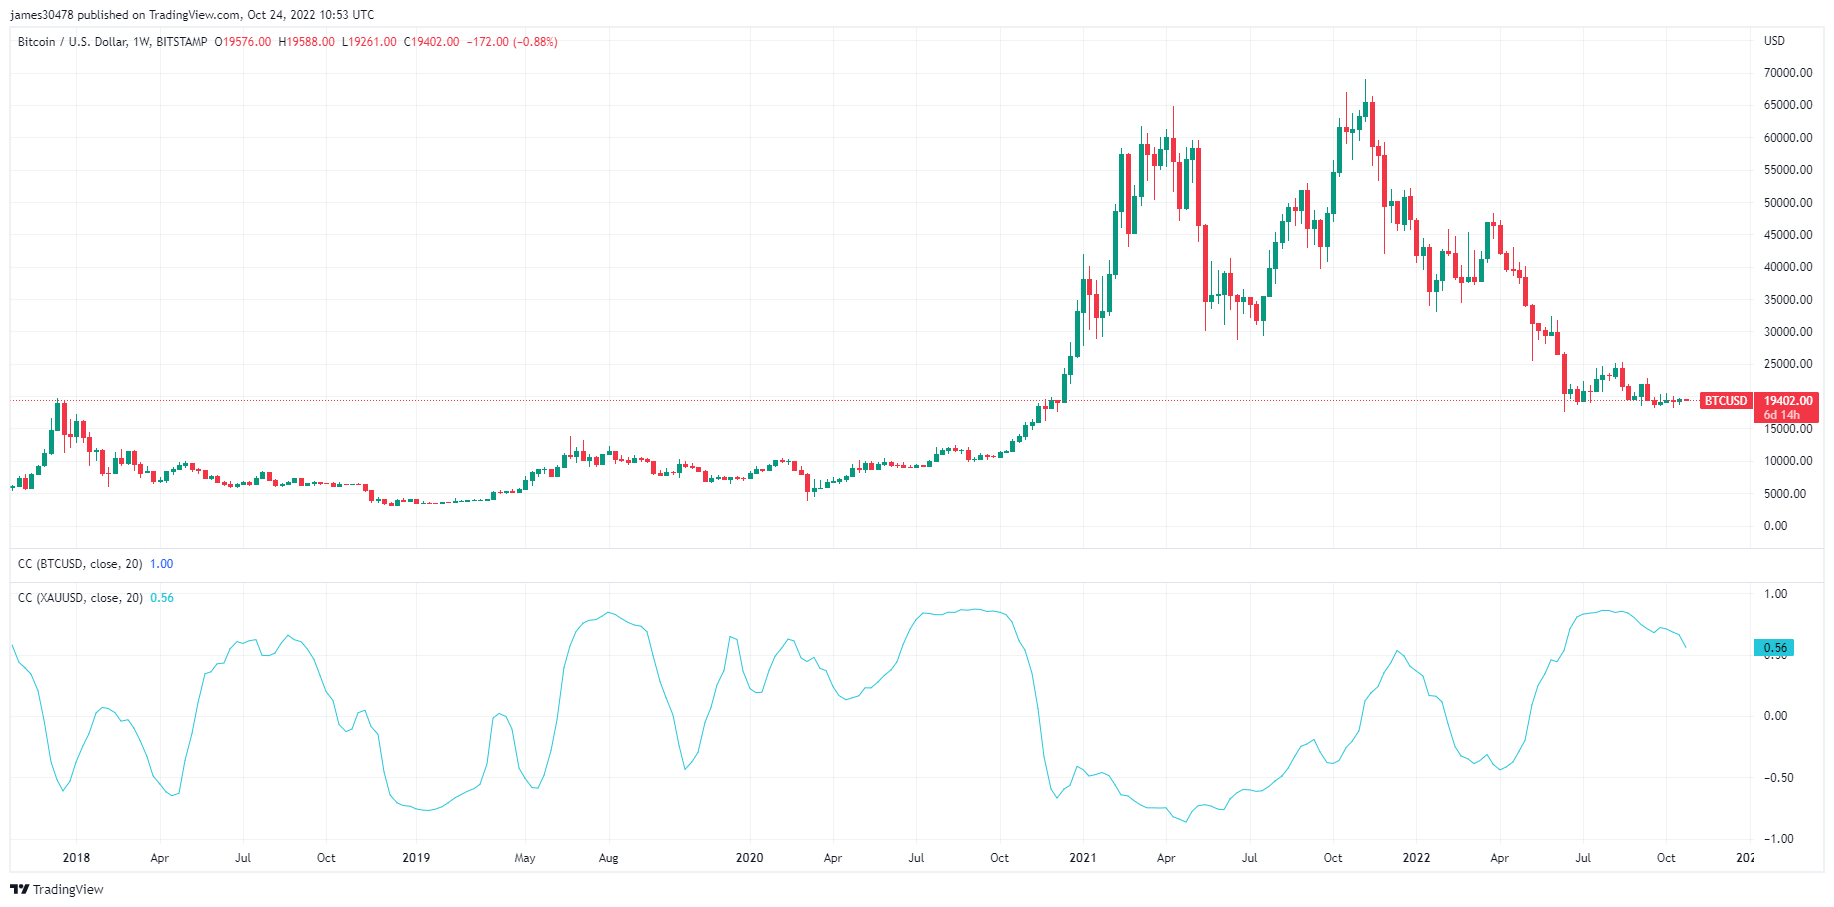
The chart above shows Bitcoin's price against the U.S. Dollar since 2018 and demonstrates the correlation rate between gold and Bitcoin with the blue line.
The chart's sections showing the price movements in late 2017, July 2018, September 2018, August 2019, January 2020, March 2020, July-October 2020, December 2021, and July 2022 correspond with a relatively high price correlation between gold and Bitcoin.