 Bitcoin price below penultimate resistance: can bulls break through?
 Bitcoin price below penultimate resistance: can bulls break through?

Cover art/illustration via CryptoSlate. Image includes combined content which may include AI-generated content.
There’s no doubt that Bitcoin has started off 2020 rather well. Since starting the year in the low-$7,000s, the price of the leading cryptocurrency has surged to a local high of $9,620, marking an increase of over 30 percent. Altcoins have followed suit, with Ethereum and XRP strongly breaking out of bearish chart formations.
Despite the strong surge in the price of the leading cryptocurrency and its ilk, BTC remains below a key resistance price, according to a prominent analyst, suggesting that bulls are not yet out of the woods.
Bitcoin faces key resistance just ahead in mid-$9,000s
Leading Bitcoin trader Hsaka recently noted that BTC remains below a key resistance level at $9,463.5—2.30 percent higher than the current price of $9,250—on the three-day chart, with the cryptocurrency failing to register a candle close above this key price point.
Hsaka joked that this is the “one line to rule them all,” referencing Lord of the Rings. The idea here: as long as Bitcoin hasn’t made a three-day close above the aforementioned penultimate level, it remains bearish.
$BTC 3D
One line to rule them all. pic.twitter.com/1FkP2amAcH
— Hsaka (@HsakaTrades) February 3, 2020
Indeed, as Hsaka’s chart indicates, Bitcoin’s price action around $9,463.5 has determined the asset’s directionality ever since the blow-off top in June 2019.
Indeed, after the price of Bitcoin began to fall after the surge to $14,000, the retracement held $9,463.5 on three distinct occasions, leading to a strong subsequent bounce in BTC. And, in the infamous October “China pump,” the price was strongly rejected by the resistance on multiple candles, which resulted in more bearish price action as 2019 came to a close because the downward trend failed to reverse.
Can bulls break past this level?
With this level being of obvious importance for Bitcoin, are analysts thinking the cryptocurrency can top Hsaka’s “one line to rule them all”?
Per some of the industry’s most accurate analysts, for sure.
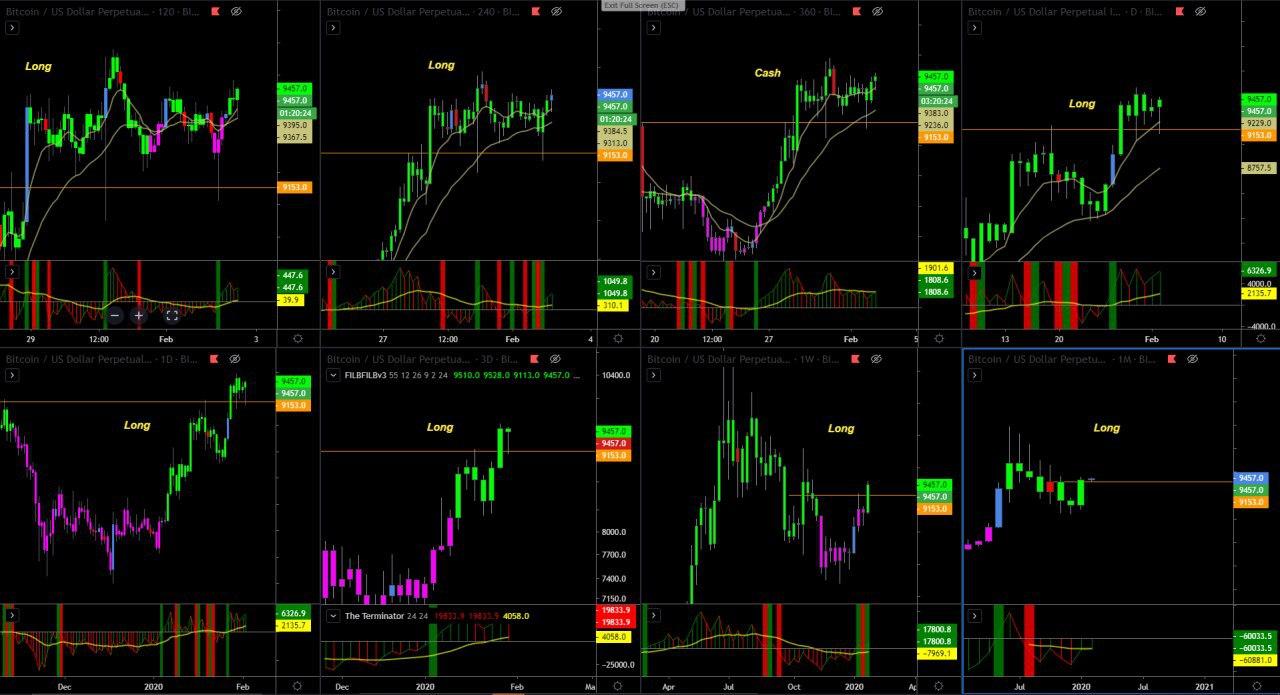
Filb Filb — the pseudonymous analyst who in October 2019 called Bitcoin’s price action from then until January 2020 effectively perfectly — recently posted the below chart to his Telegram channel. He wrote that these charts paint a “pretty bullish outlook” for BTC because the “volume indicators are good,” not to mention the “moving averages are trending up.”

Also, Dave the Wave, another cryptocurrency trader who has been extremely accurate in 2019, recently doubled down on a prediction that BTC will soon surge towards $11,500 by the end of the month.
And to put a cherry on the proverbial crypto cake, CryptoSlate reported earlier this month that Bitcoin’s performance in January printed an extremely positive “strong engulfing candle,” bouncing off a zone of high demand in the $6,000s. Analysts claim that January’s performance is a precursor to an even larger bull run in 2020.
Bitcoin Market Data
At the time of press 4:26 am UTC on Feb. 6, 2020, Bitcoin is ranked #1 by market cap and the price is up 4.42% over the past 24 hours. Bitcoin has a market capitalization of $175.11 billion with a 24-hour trading volume of $36.68 billion. Learn more about Bitcoin ›
Crypto Market Summary
At the time of press 4:26 am UTC on Feb. 6, 2020, the total crypto market is valued at at $272.64 billion with a 24-hour volume of $139.36 billion. Bitcoin dominance is currently at 64.23%. Learn more about the crypto market ›


 Farside Investors


 CoinGlass


