XRP just broke above this multi-year trendline
Cover art/illustration via CryptoSlate. Image includes combined content which may include the use of AI tools.
XRP just broke above a significant price hurdle that has been containing its price from advancing further since January 2018. Now, this cryptocurrency could be preparing to make higher highs.
XRP breaks decisively through resistance
After reaching an all-time high of $3.30 on Jan. 04, 2018, XRP entered a massive downtrend. The price of this cryptocurrency plummeted by nearly 95 percent and it recently hit a low of $0.176. This price level has not been seen since the week of Oct. 30, 2017.
Since XRP entered a bear market in early 2018, it has not been able to make a higher high. Instead, it continues making a series of lower lows. As a result, XRP became one of the worst-performing digital assets of 2019 with a negative year-to-date (YTD) return, as of today, of over 20 percent.
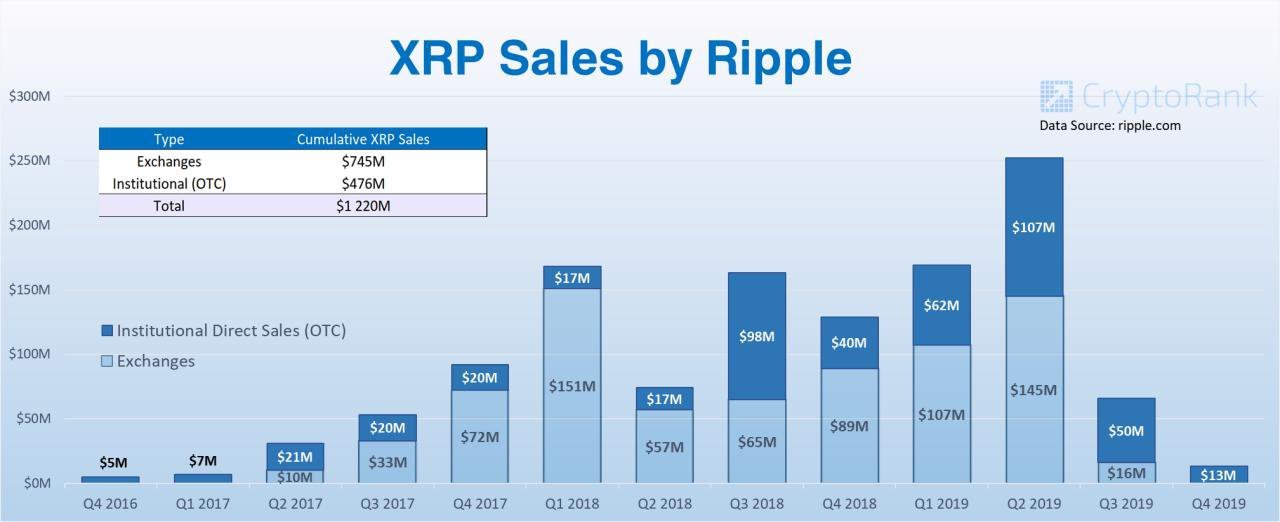
Different analysts claim that the steep decline is related to the $1,220 million worth of XRP tokens that Ripple has sold since 2016. Although Brad Garlinghouse, CEO at Ripple, maintains that the substantial sale of XRP is meant to help the company amplify the utility of this token, investors disagree. In fact, a petition with nearly 4,000 supporters is currently active asking Ripple to “stop dumping” XRP.
Nevertheless, the price action that this cryptocurrency experienced last week could be the catalyst that pushes it out of the current downtrend.
XRP went from trading at a low of $0.226 to a high of $0.263. The 16 percent bullish impulse was significant enough to allow this cryptocurrency to break above the infamous multi-year trendline. This barrier has been serving as a major resistance level for the past two years invalidating any bullish outlook.

Now that this price hurdle has been turned into support, XRP could be preparing to make the first higher high since 2018.
A parabolic advance approaches
In a recent tweet, TradingShot explained why XRP could be getting ready to “explode.” The technical analyst argued that the moving average convergence divergence (MACD) is “printing the same sequence” that has led to a bull run before, based on the 1-week chart.
Now, TradingShot is waiting for the 50 and 100-week moving averages to form a golden cross. Such a bullish formation could serve as the last piece of confirmation needed for a potential rally.

Although many investors view golden crosses as one of the strongest buy signals that could start a long-term bull market, this technical pattern is far from developing. Therefore, it seems too early to call for a parabolic advance, but there are other technical patterns that anticipate a correction before XRP enters a new bullish trend.
A retracement could be underway
XRP has been contained within an ascending parallel channel since Dec. 17, 2019. Since then, every time this cryptocurrency hits the bottom of the channel, it bounces off to the middle or the top. But, when it surges to the upper boundary of the channel, it falls back to the middle or the lower boundary.
At the moment, XRP is trading around the middle parallel line of the channel. A further increase in sell orders could take it to test the lower boundary of the pattern once again. Conversely, a spike in demand could push XRP to the upper boundary of the channel.
Based on the TD sequential indicator, it seems like a retest of the bottom of the ascending parallel channel could come first. This technical index is currently on a green eight candle on XRP’s 1-day chart. A sell signal would likely be presented in the following 12 hours in the form of a green nine candle. Such a bearish formation estimates a one to four candlestick correction before the continuation of the uptrend.
If the 200-day moving average continues to hold, XRP could plunge to test the 100-day moving average for support. This is also where the lower boundary of the parallel channel sits. Breaking below this significant level of support would likely trigger a steeper correction down to the 50-day moving average.
Nonetheless, a spike in volume that allows XRP to close above the 200-day moving average could jeopardize the bearish outlook. Moving above this price barrier could push this cryptocurrency up to the upper boundary of the parallel channel at around $0.280.
Overall sentiment
Over $80 billion have flooded the cryptocurrency market since Jan. 3. The massive inflow of capital allowed most cryptos to post significant gains. XRP, for instance, surged by nearly 42 percent since then.
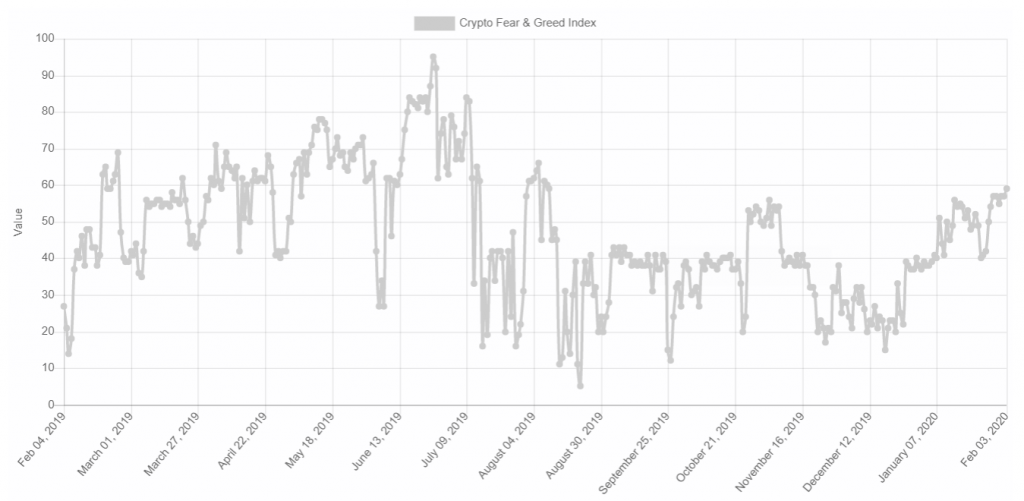
The entire crypto market has been trending up since the beginning of the year and investors appear to be overwhelmingly bullish about the future. As a result, the Crypto Fear and Greed Index (CFGI) is noticing high levels of greed among market participants over the past few days.
This fundamental indicator analyzes the emotions and sentiments in the crypto market from different sources, such as volatility, volume, social media, surveys, and market dominance. These values are combined into one simple number. A value of 0 means “extreme fear” while a value of 100 represents “extreme greed.”
The CFGI is currently on a 59 (greed), which is the highest value it has reached since last year. The last time this index hit such a high value was in Nov. 03, 2019, when it was at 56. During that time, XRP dropped nearly 45 percent from $0.315 to $0.176.
Based on historical data, greed is perceived as a negative sign and tends to indicate that a selling opportunity is coming soon. Following the recent 40 percent rally that XRP went through, investors should now be aware of the bearish signs that are being presented before going bullish.
As Warren Buffett once said:
“Be fearful when others are greedy and greedy when others are fearful.”