 Litecoin leading the crypto-market suggests a potential bullish breakout; here’s why
 Litecoin leading the crypto-market suggests a potential bullish breakout; here’s why

Cover art/illustration via CryptoSlate. Image includes combined content which may include AI-generated content.
Litecoin seems to be leading the recent run-up in the cryptocurrency market. Based on historical data, the last time LTC behaved this way it marked the beginning of a full-blown bull run.
Litecoin leads the crypto-market
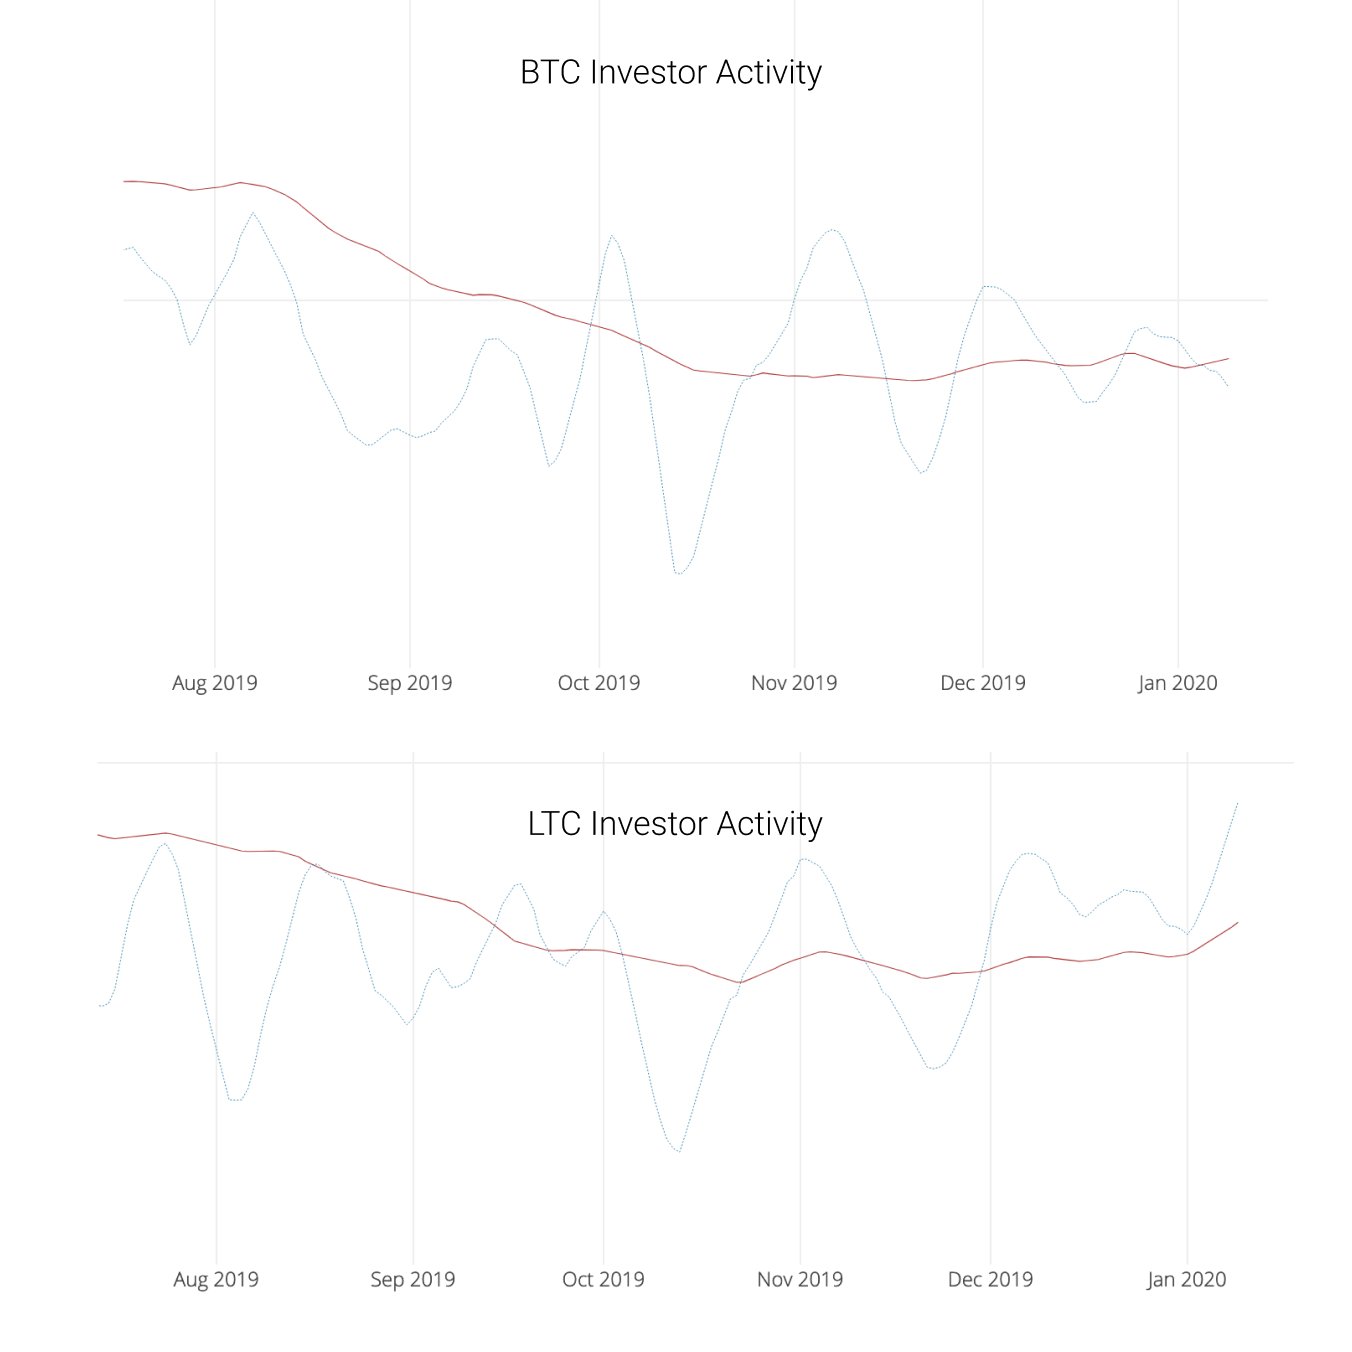
In a recent tweet, on-chain analyst Willy Woo stated that Litecoin’s price action could be used as a “confirmation signal” of where Bitcoin is heading next. From a low time frame, the analyst determined that LTC was leading BTC’s price.
According to Woo, Litecoin had already broken a significant resistance level hours before Bitcoin did.
Woo added:
“Using on-chain investor activity, which gives a read of where this may go; LTC is already very bullish, while BTC is still consolidating around an early bullish swing.”

This is not the first time that Litecoin leads the uptrend in the cryptocurrency market. On Feb. 8, 2019, LTC broke out of a consolidation phase where it had been trading for nearly a month. The upswing allowed it to test the $49 resistance level, which was shattered 12 days later. Breaking this significant resistance cluster allowed Litecoin to surged 200 percent and peak at a high of $147 on June 2, 2019.
Meanwhile, Bitcoin was able to break the $4,220 resistance level on Apr. 2, 2019. Closing above this price hurdle was essential for the flagship cryptocurrency to gain the $6,100 level as support on May 8, 2019. From that point, BTC went through a 126 percent rally topping at nearly $14,000. This happened 24 days after LTC peaked.
Although Litecoin’s price action cannot be considered definitive proof of where Bitcoin is heading next, it certainly serves as guidance about the future market valuation. Now, this cryptocurrency is testing a significant resistance level that could signal the beginning of a new bull run.
Litecoin technical analysis
After bottoming at $36 on Dec. 18, 2019, Litecoin is making a series of higher highs and higher lows. The upward momentum took this cryptocurrency to test the $48.50 resistance level. At the moment, this price point is containing LTC from a further advance. But, if this crypto is able to break above $48.50 with enough volume it would likely trigger the beginning of a new bull market.
A spike in the buying pressure behind Litecoin could take it to test the next levels of resistance at $53, $57.70, and $64.
Adding to the bullishness, the moving averages on LTC’s 1-day chart formed a golden cross. As the 7-day moving average crossed above a 30 and 50-day moving average the potential for a significant bullish breakout increased exponentially. Many investors see this technical pattern as one of the most definitive and strong buy signals that could start a long-term bull market.
Moving forward
Based on historical data, it seems that Litecoin could be used as an indicator to determine whether Bitcoin will surge or reach a market top. The recent bullish impulse was lead by LTC. As seen in 2019, this cryptocurrency could now provide valuable information to asses the beginning of the next bull market.
Willy Woo stated that the recovery of LTC’s difficulty ribbon was a clear sign that this cryptocurrency will enter an uptrend. Now, the analyst expects Litecoin to move in an upward direction even before Bitcoin does. It remains to be seen if the demand for this cryptocurrency will increase to allow it to break above the $48.50 resistance level.
Litecoin Market Data
At the time of press 5:54 pm UTC on Jan. 10, 2020, Litecoin is ranked #6 by market cap and the price is up 6.1% over the past 24 hours. Litecoin has a market capitalization of $3.02 billion with a 24-hour trading volume of $3.51 billion. Learn more about Litecoin ›
Crypto Market Summary
At the time of press 5:54 pm UTC on Jan. 10, 2020, the total crypto market is valued at at $211.02 billion with a 24-hour volume of $90.38 billion. Bitcoin dominance is currently at 68.18%. Learn more about the crypto market ›


 Farside Investors


 CoinGlass


