Trading Tips: Introduction to Ichimoku Clouds

Photo by Chris Barbalis on Unsplash
Ichimoku clouds are a charting indicator created by Goichi Hosoda, a Japanese trader, that wanted to create a quick and easy way to look at a chart and be able to tell what is going on.
Ichimoku clouds allow support and resistance levels to be seen more easily, while also showing key information like momentum and trends. The main indicators to look for on a trade are TK crosses, Kumo breaks and Kumo Twists.
Technical analysis tools such as Ichomuku Clouds are used to help make more educated guesses on price action. We'll proceed to break down the key elements of Ichimoku Clouds and explain how they can be used to trade profitably.
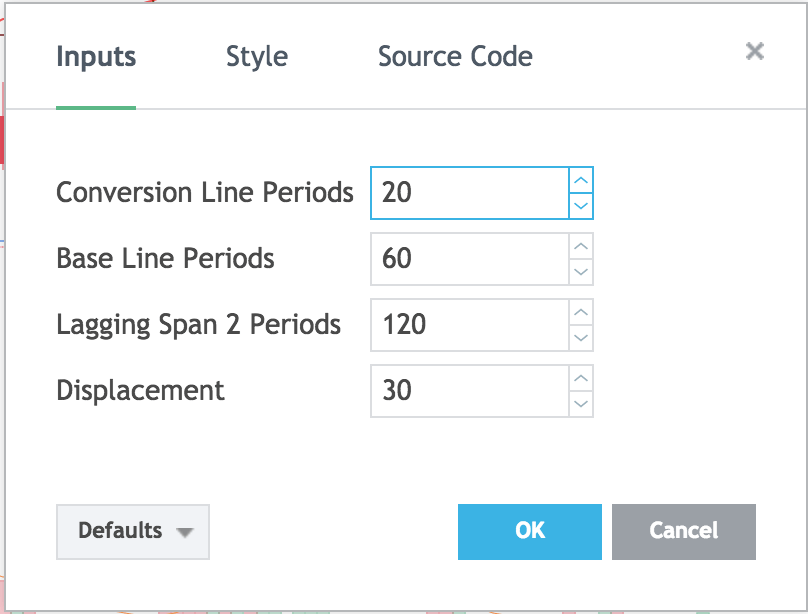
On Tradingview, add the Ichimoku Cloud indicator by clicking the indicators and strategies button. From here, click the gear next to “Ichimoku” to change your indicators setting to your liking.
The Tenkan-Sen
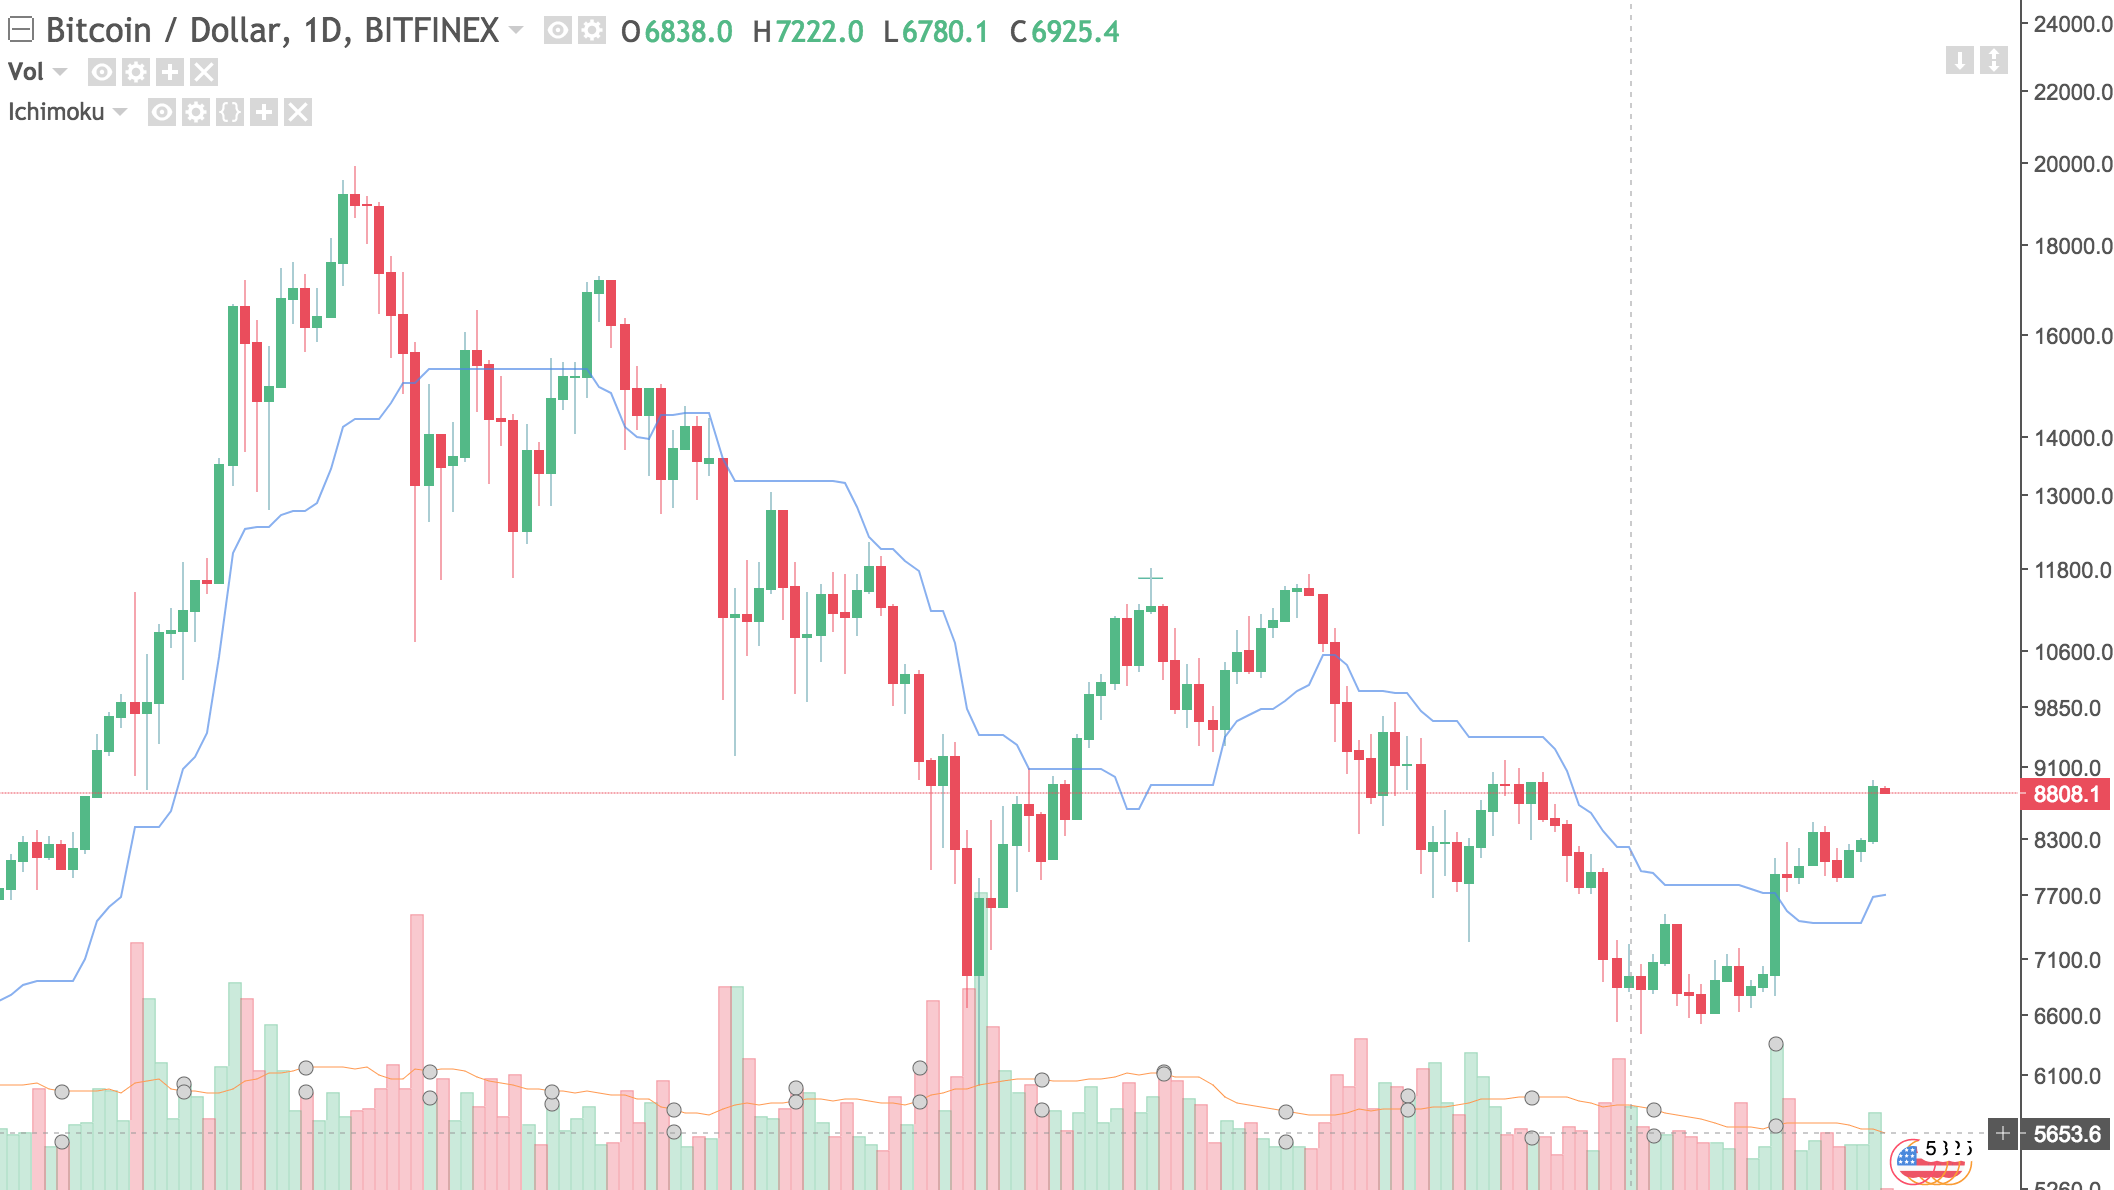
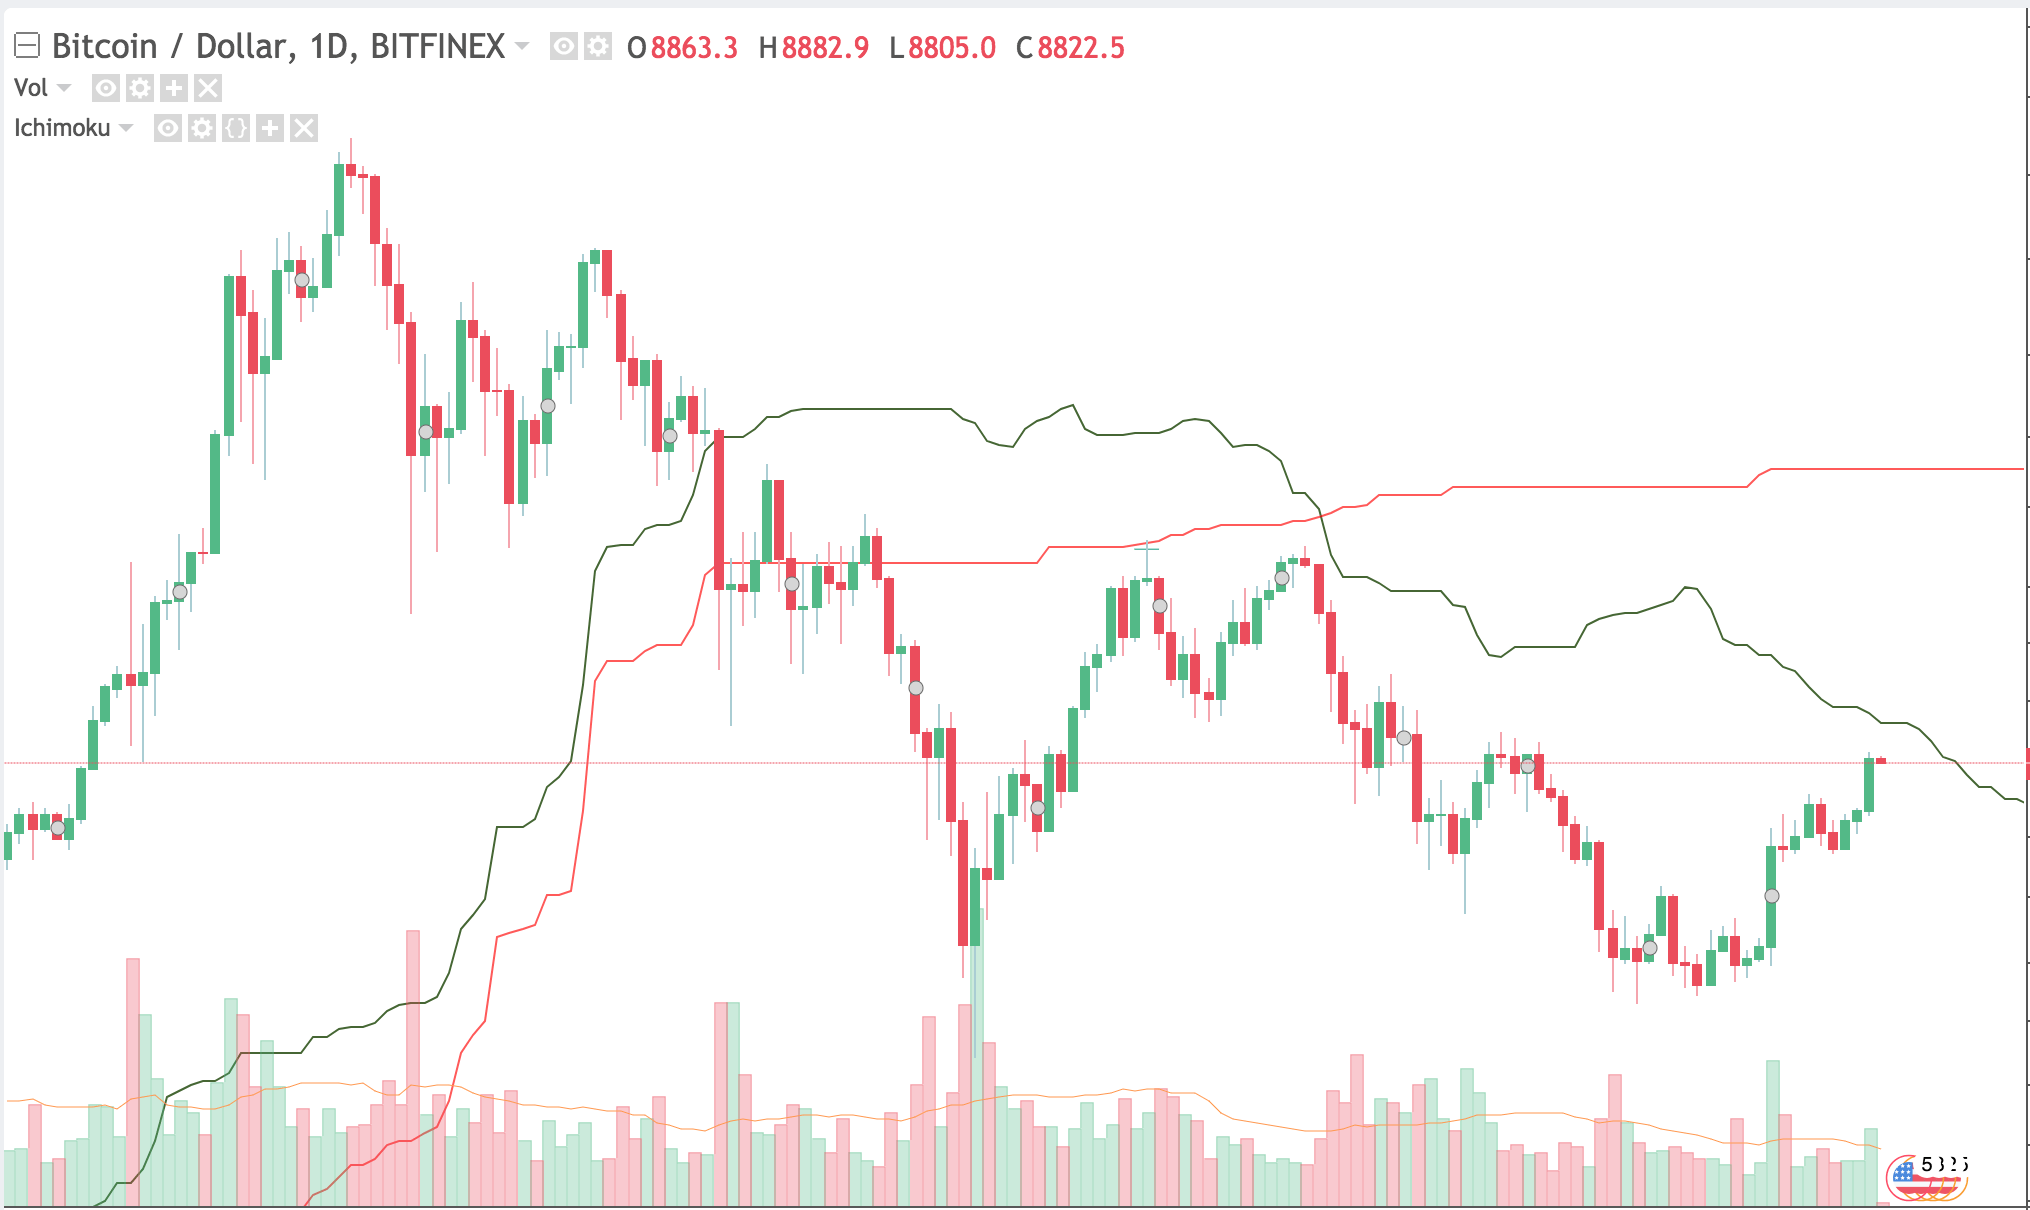
The first component of the Ichimoku Cloud charting indicator is the Tenkan-Sen. The Tenkan-Sen is measured by taking the average of the highest high and lowest low for the last x periods. Other guides may refer to the Tenkan-Sen as the conversion line, but they are the exact same thing.
On traditional markets, the period length is typically set at 10. Due to cryptocurrencies increased volatility, cryptocurrency traders compensate by doubling the length to 20. The Tenkan-Sen often creates bounces, as people look to it as a support level.
A flat Tenkan-Sen indicates that the short-term momentum is low in the market. A sloping Tenkan-Sen indicates short-term high momentum. When charting, momentum can be defined as the rate of acceleration of the price or volume.
By taking an average of a cryptocurrencies highest high, and lowest low, we can identify the chart's range. A chart that has low momentum would indicate the price isn’t moving much, which would create a similar average over a time period. This is what creates a flat Tenkan-Sen.
The Kijun-Sen
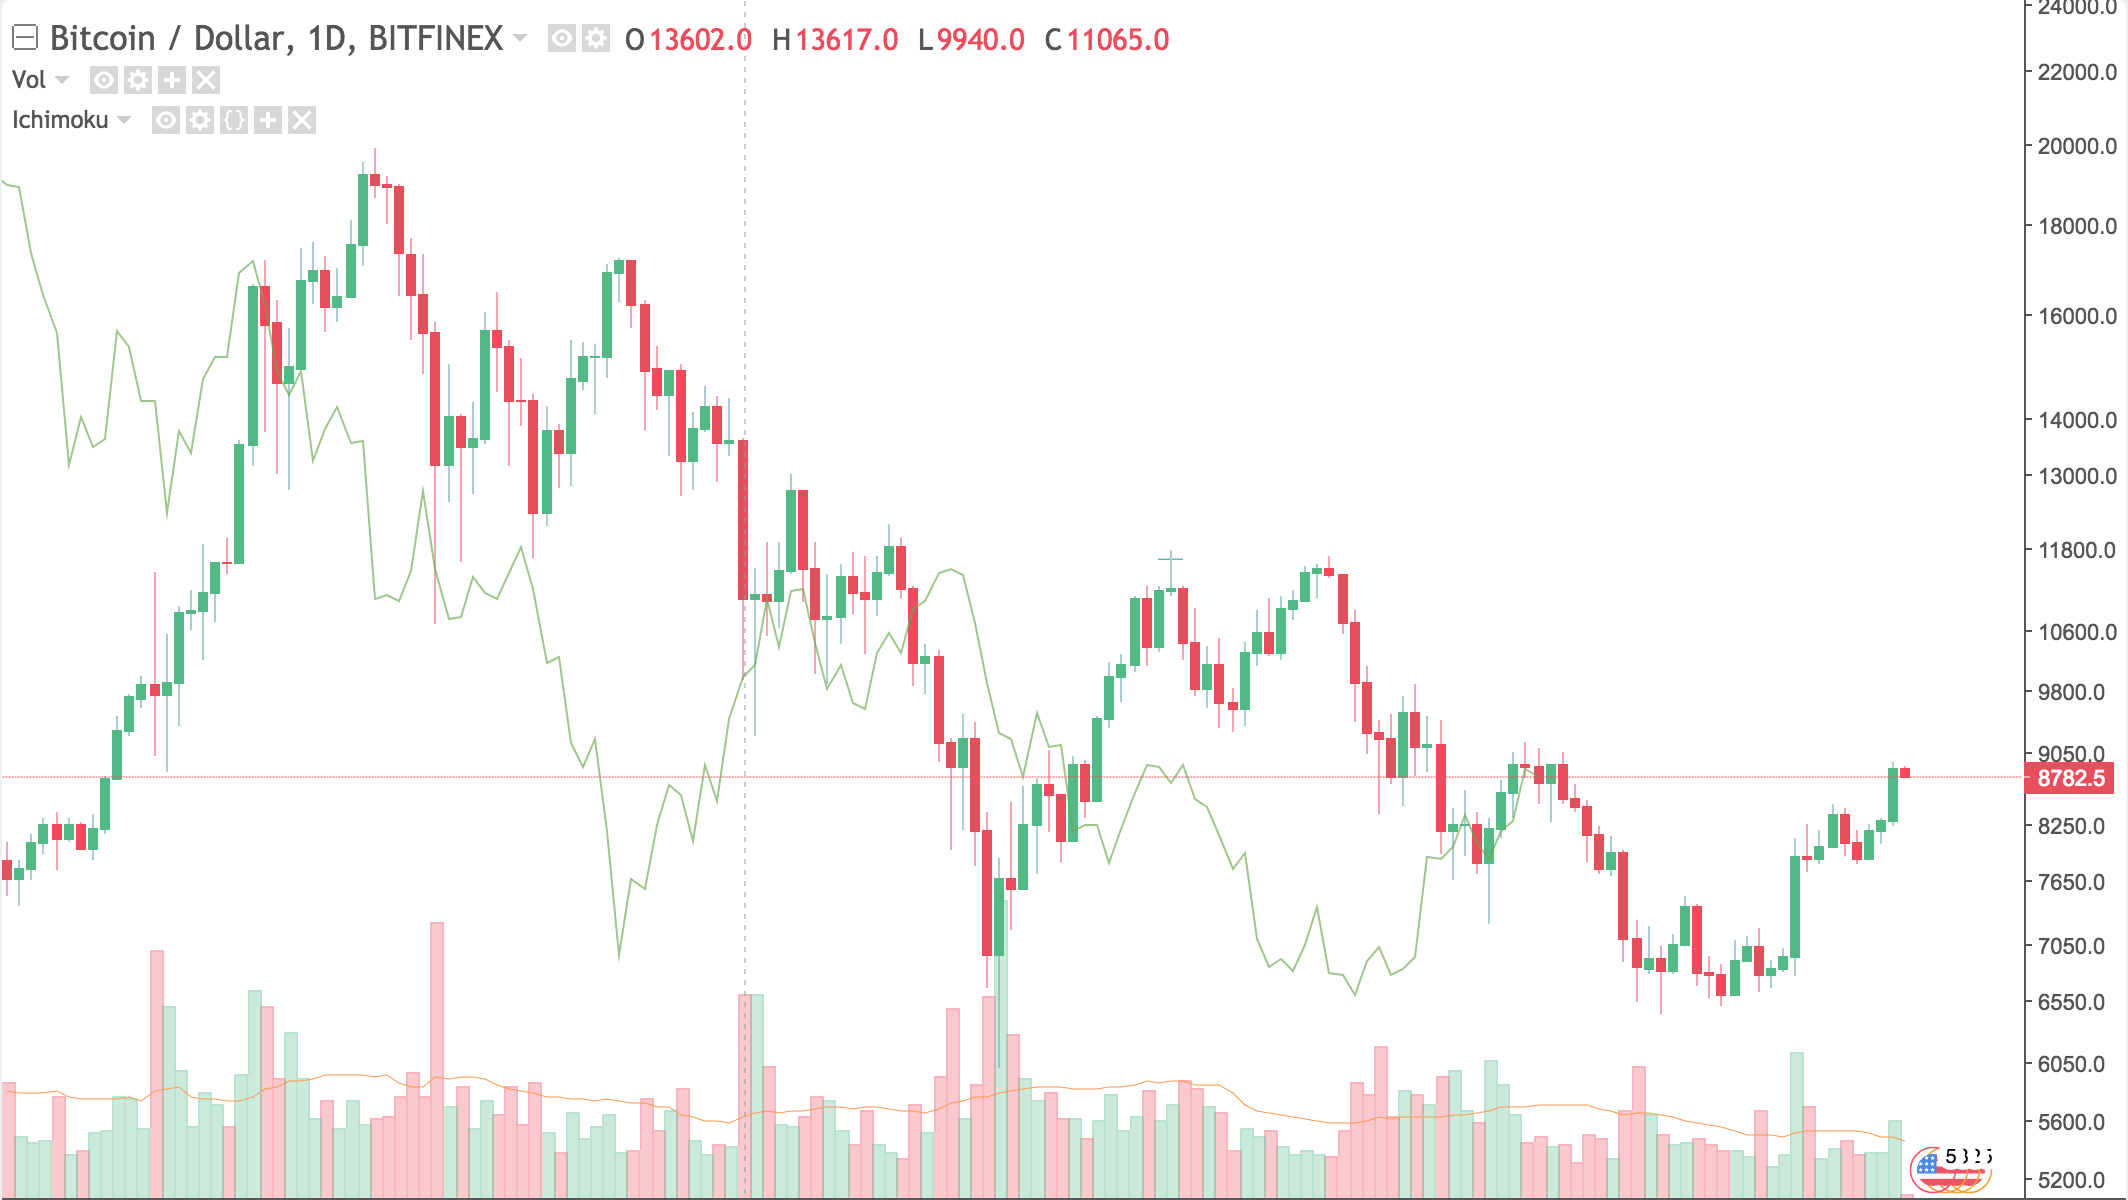
The Kijun-Sen, also known as the baseline, is measured by taking the average of the local highs and lows for the last x periods. This is similar to the Tenkan-Sen but set to a larger period. Many successful traders set the Kijun-Sen period length to 60.
Averages calculated over a long period of time are less affected by outliers. The Kijun-Sen also represents momentum but over a longer time frame.
In general, a Tenkan Sen on top of the Kijun-Sen is considered a bullish indicator. A Kijun-Sen below a Tenkan Sen is considered a bearish indicator.
Both the Kijun Sen and the Tenkan Sen calculate an average over a time period. A faster-moving average on top indicates the price is changing rapidly in an uptrend. A faster-moving average dropping below the slower moving average indicates the price is trending lower in the short term than the medium term.
The Kijun Sen is used as a support level, so some traders decide to put their stop losses at or around the area.
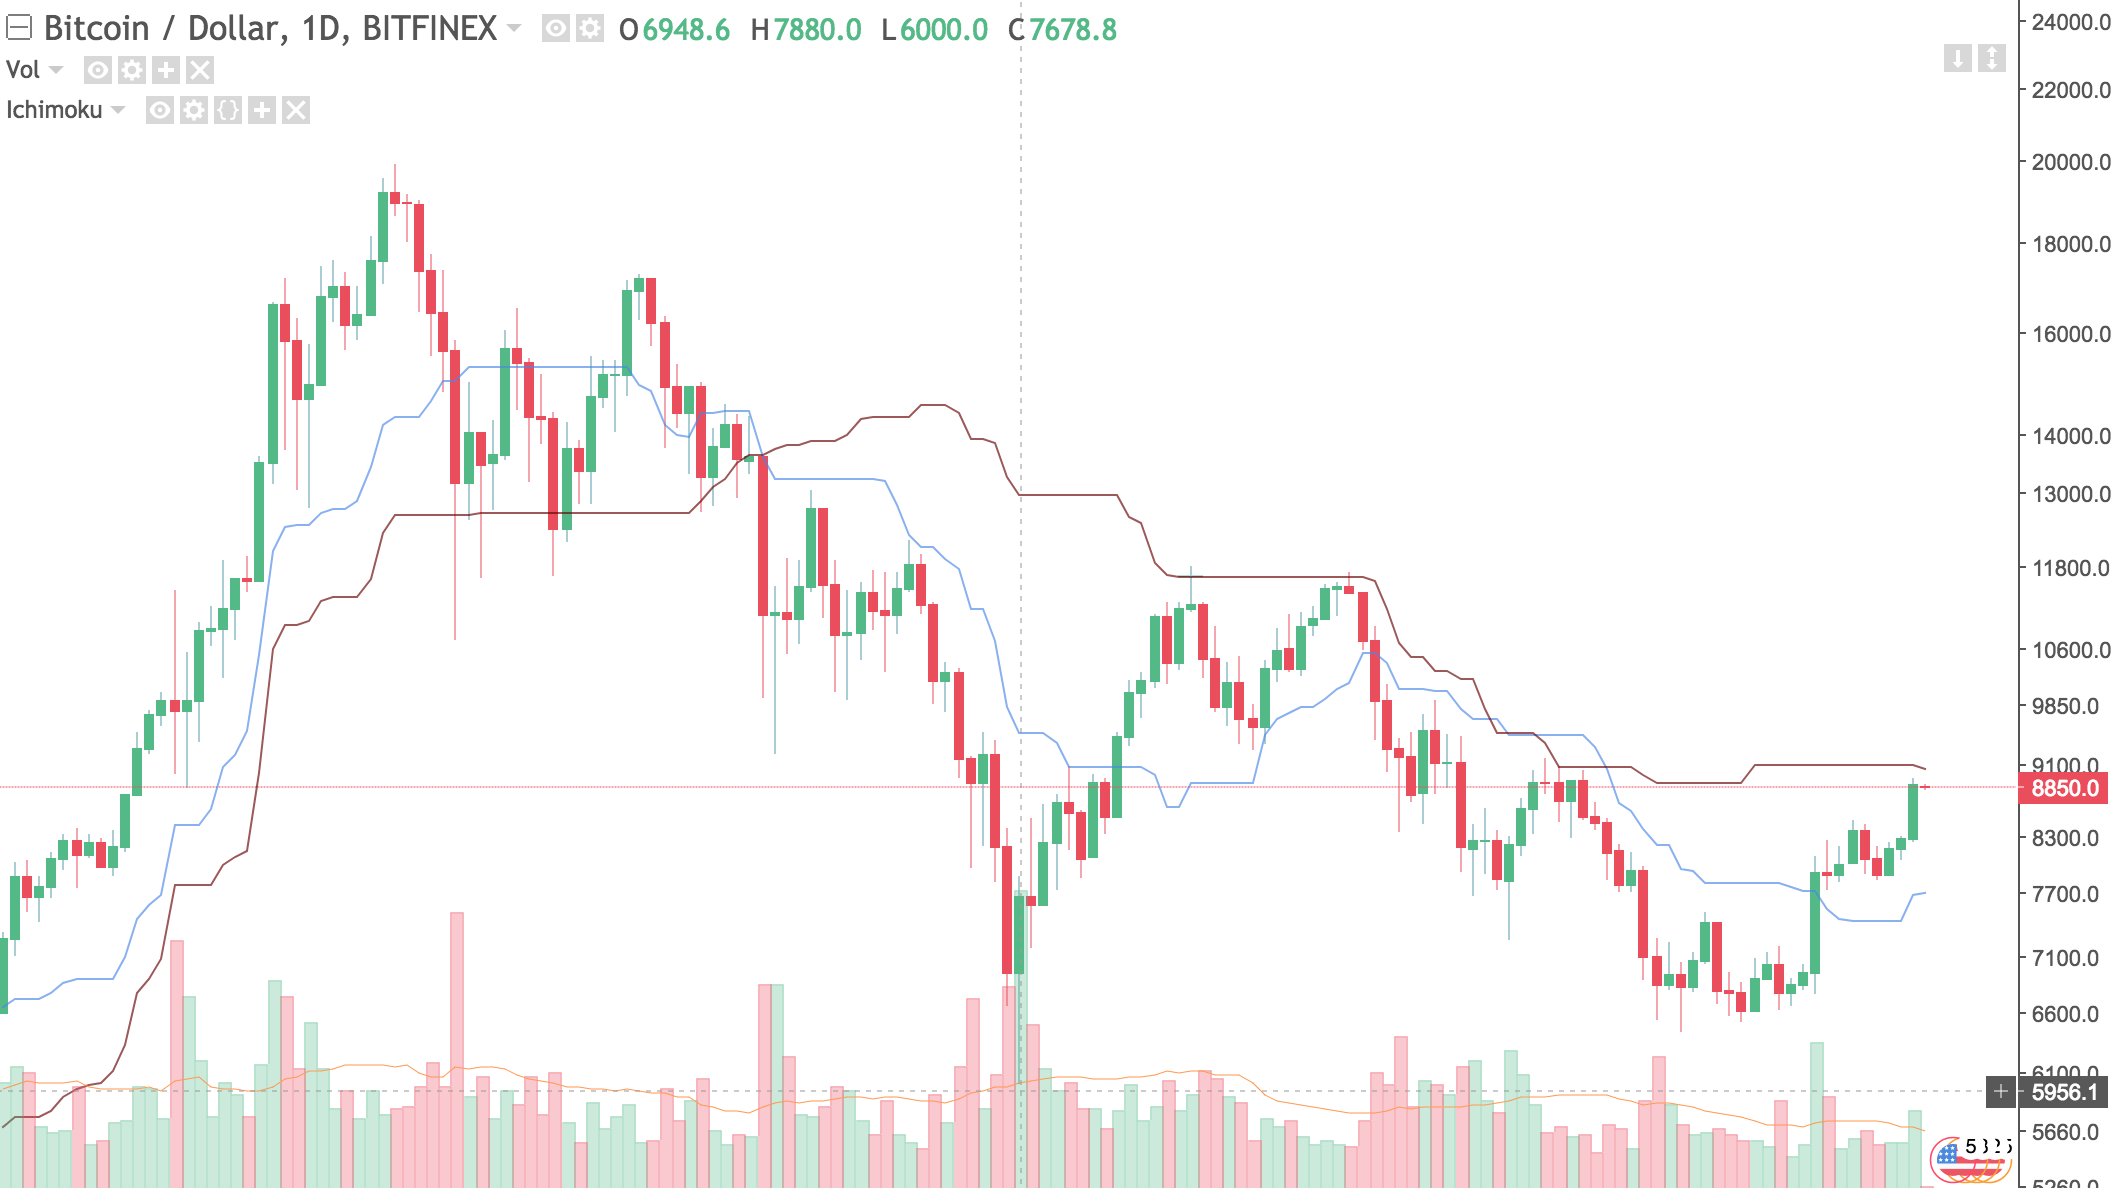
Senkou Spans A and B
Next up are the Senkou Spans. These lines are represented as the midpoint of the Tenkan-Sen and Kijun-Sen with a forward phase shift. Try setting your lagging span periods to 120. Both the Senkou Span A and B are common support and resistance levels.
Chikou Span
The Chikou Span is a lagging indicator, which is formed by taking the current price and shifting it back. A Chikou Span displacement setting of 30 periods will allow your trades to be more valid.
A Chikou span that is near the current price level is considered a neutral signal. This means that 30 periods back, the price is still at the same level. The Chikou Span is used for confirming direction, so a Chikou Span that stays in an area can't be trending upwards.
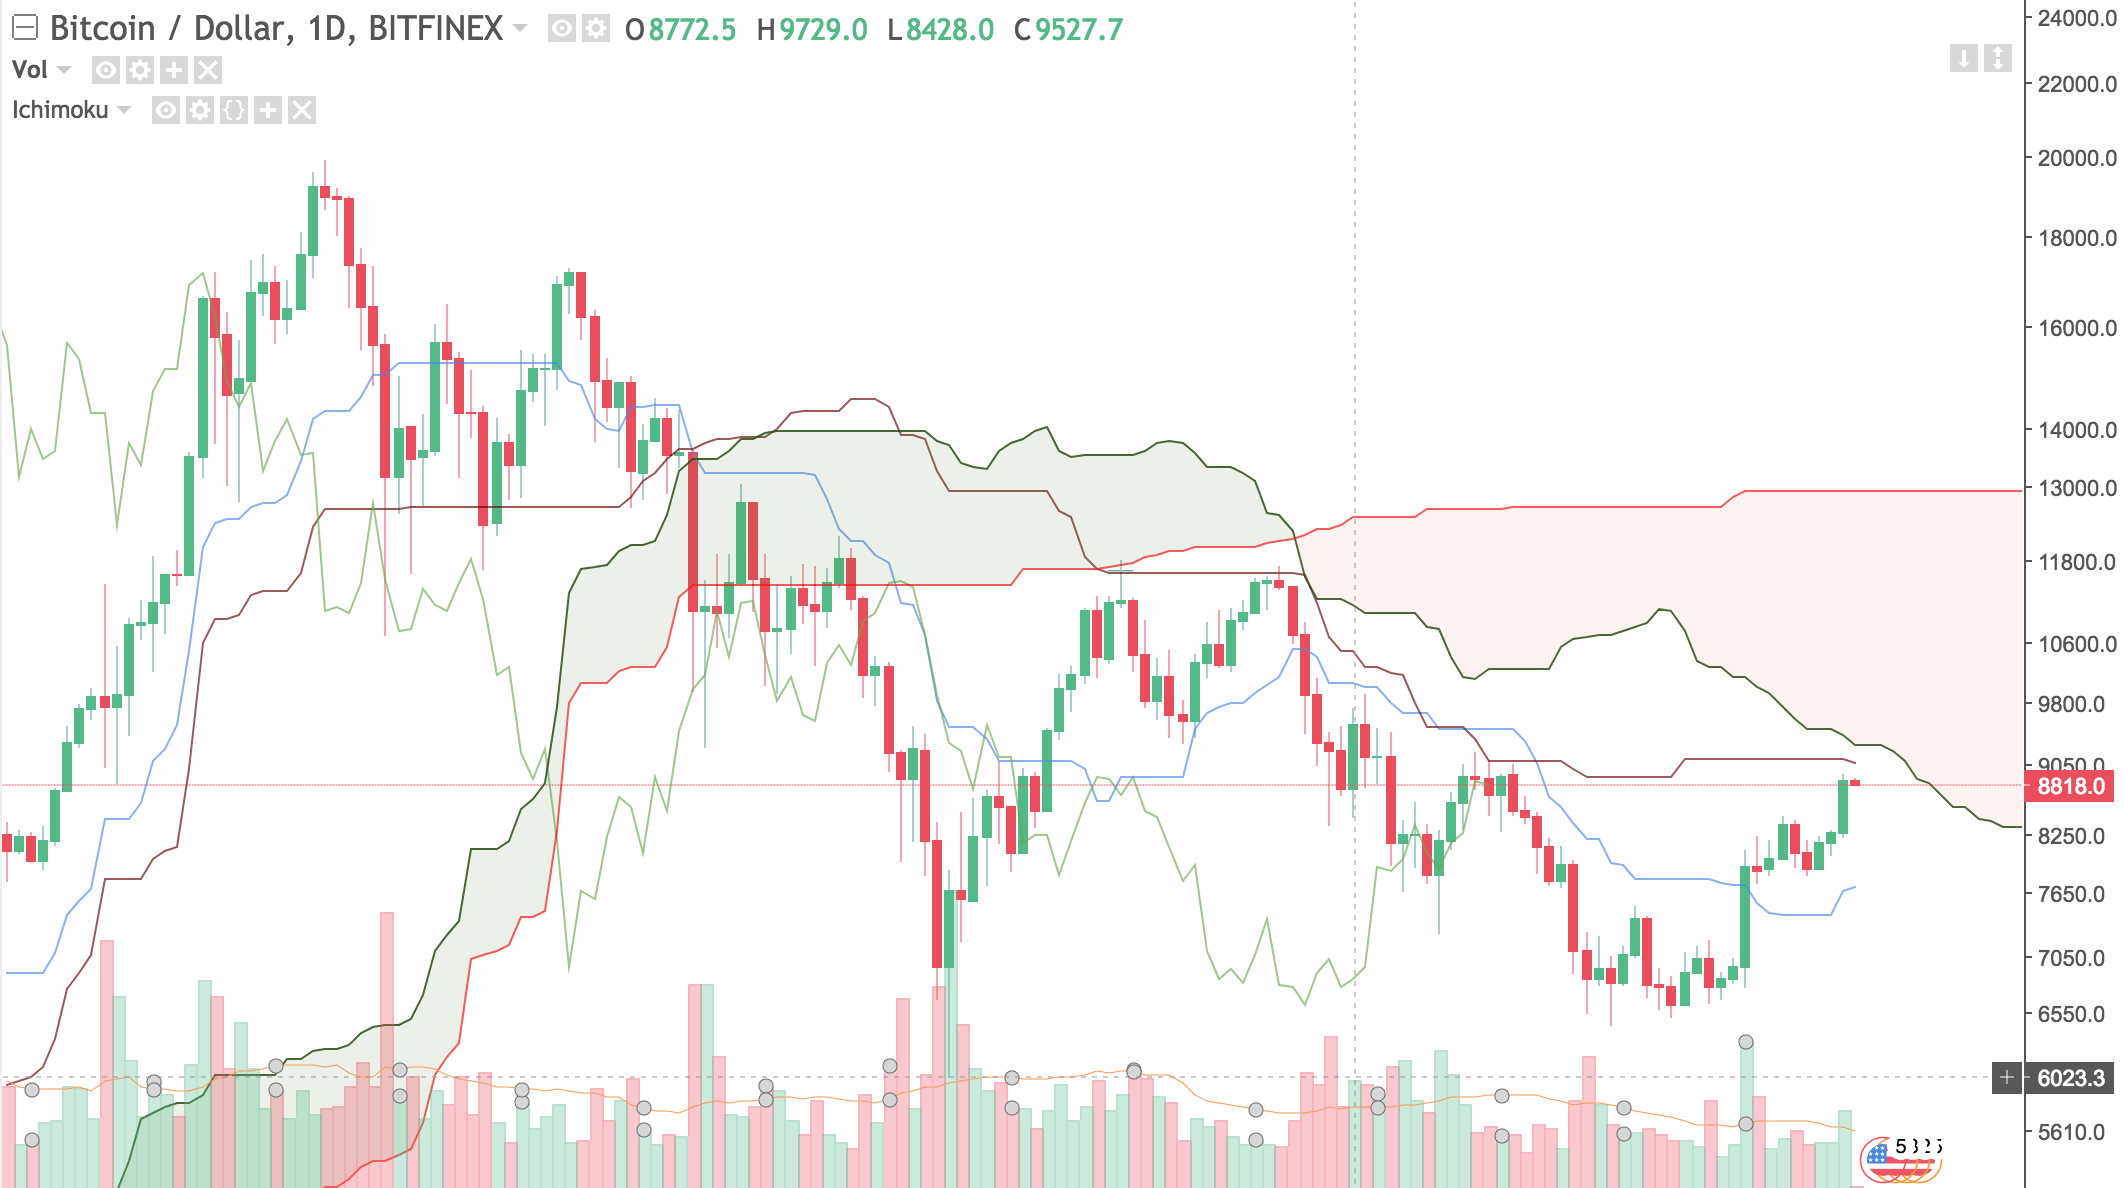
The Cloud
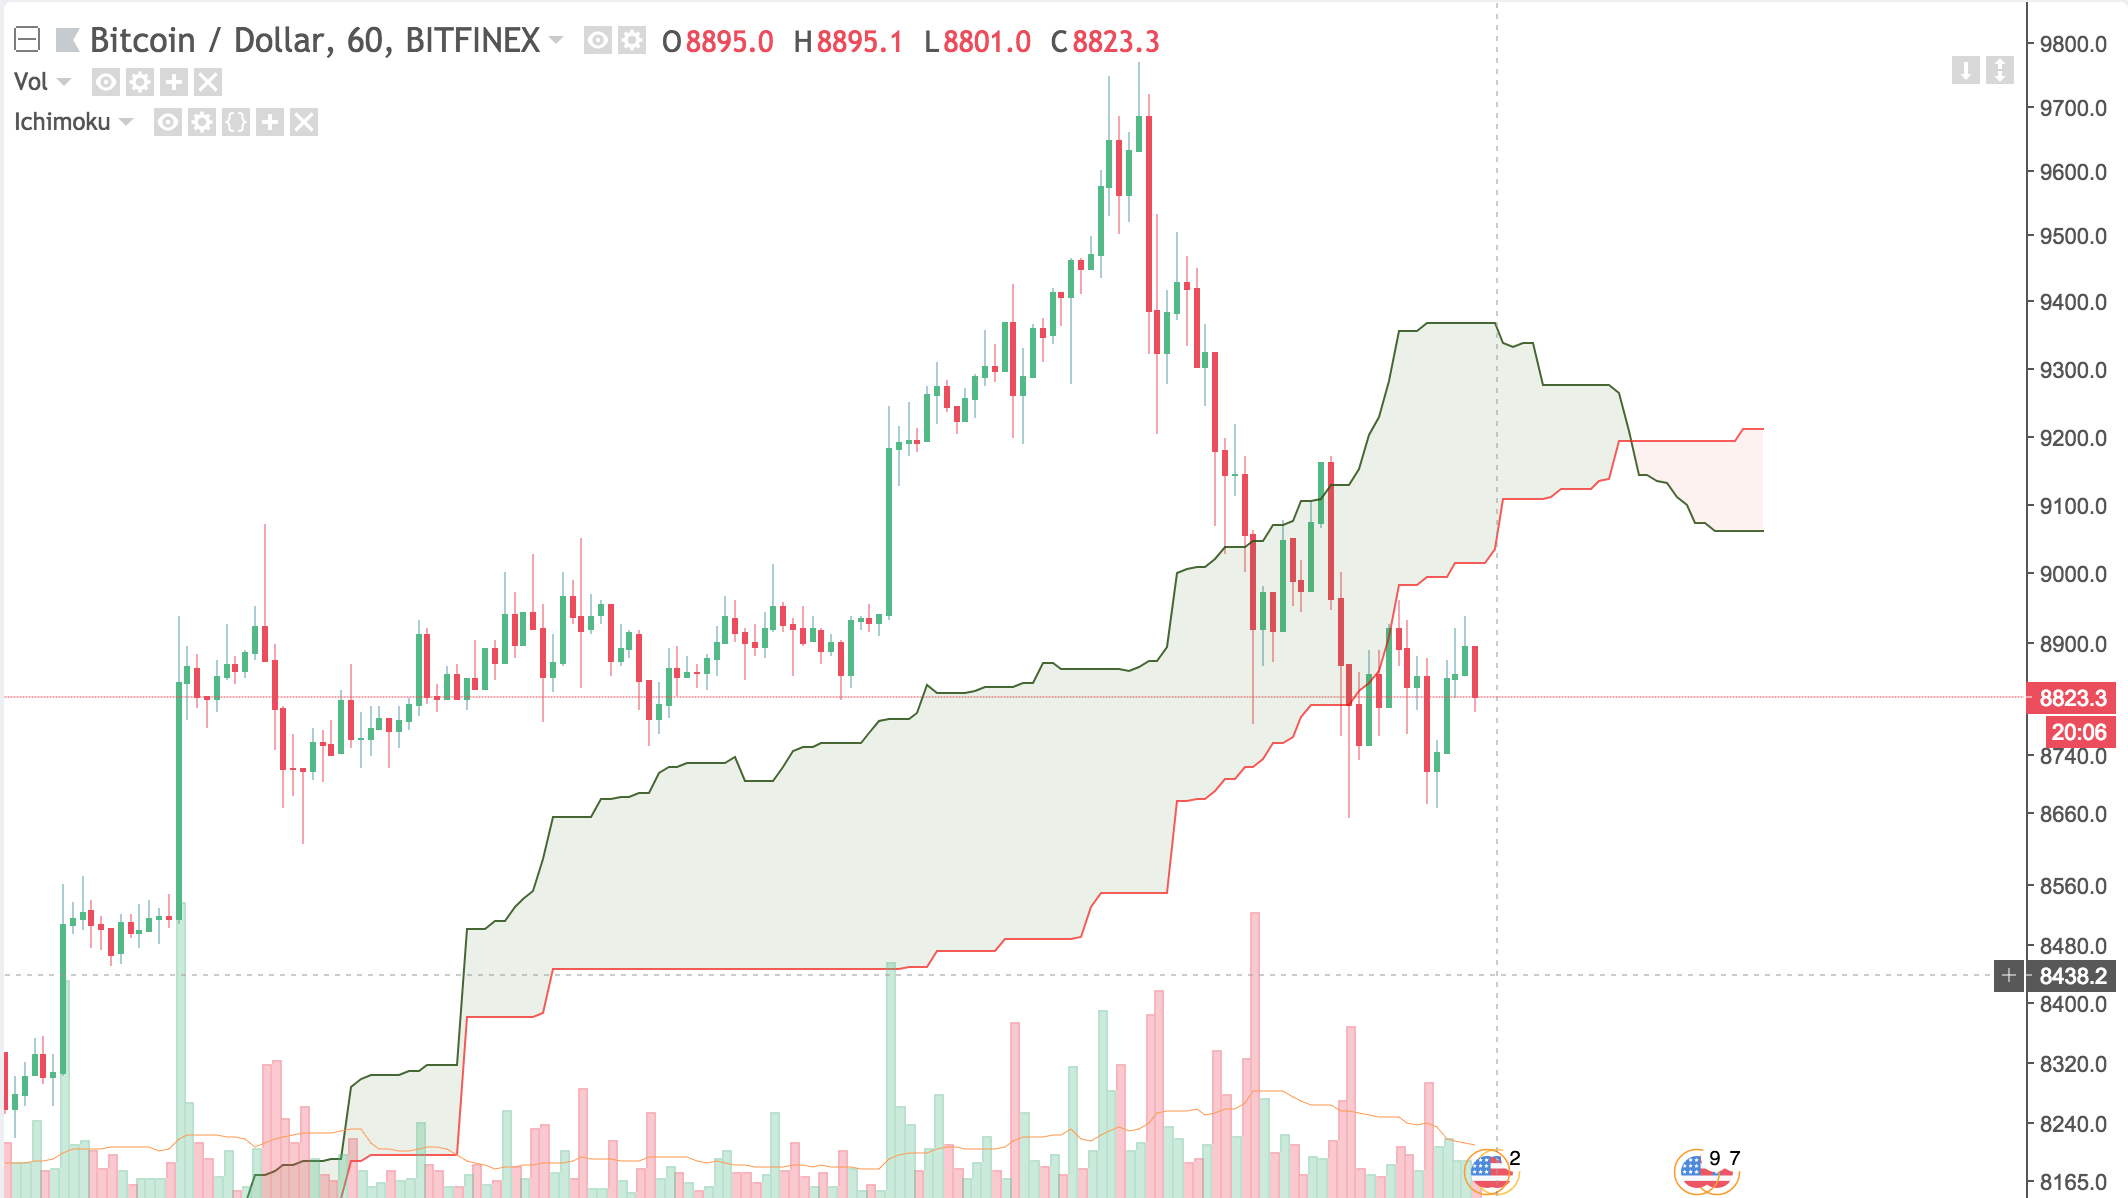
The cloud is created by filling in the area between the Senkou Span A and B. Price above the cloud is a bullish signal while the price below a cloud is a bearish signal.
Price action inside the cloud is considered a neutral signal or “turbulence” and is usually not traded in.
The top and bottom of a cloud, which are formed from Span’s A and B, are support and resistance levels. A price close above the cloud can sometimes infer a breakout is on the way. A cloud that is skinny usually means its support and resistance are weak. The fatter the cloud, the harder the support.
A cloud that has a flat top is tough resistance. The top of the cloud is formed from the Senkou Spans, which are a measure of the charts high and lows. A flat top would indicate that there wasn’t much momentum. Less momentum would mean the price is less likely to breach the cloud because the price has been consolidating sideways.
The Signals
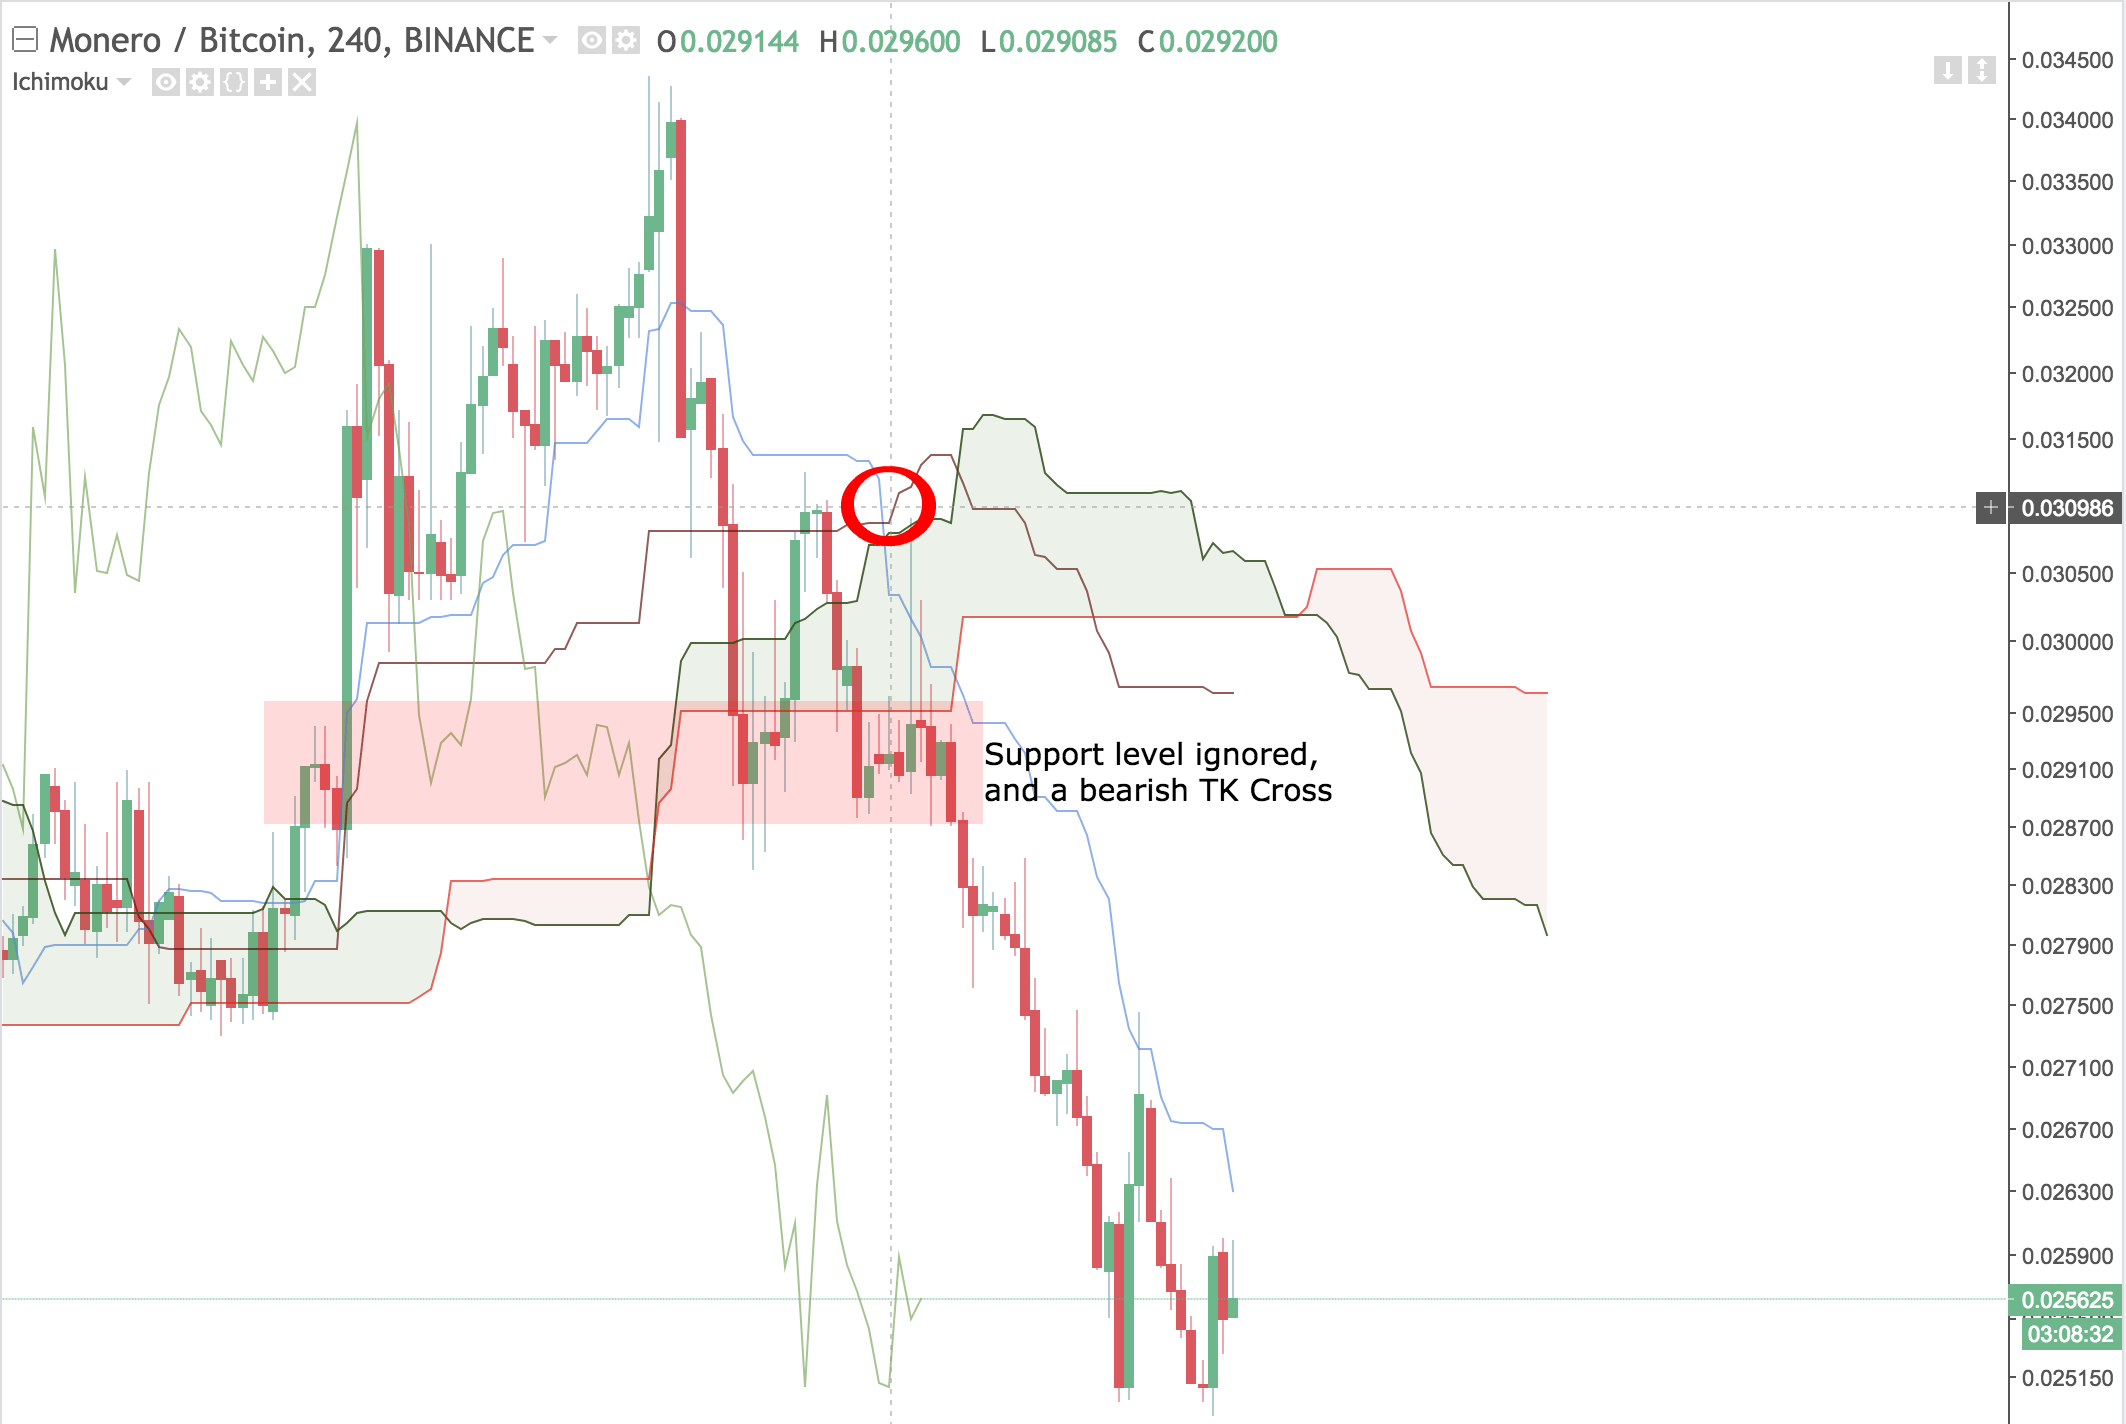
TK Crossover
A TK Crossover takes place when the Tenkan Sen and the Kijun Sen flip or cross. When the Tenkan Sen moves above the Kijun Sen, consider going long. A Kijun Sen move above the Tenkan Sen could be an indicator to go short.
A bearish crossover when under the cloud is usually a strong short signal while a bullish crossover in bull territory is a strong long signal. These crosses are a way of showing that the current trend is continuing.
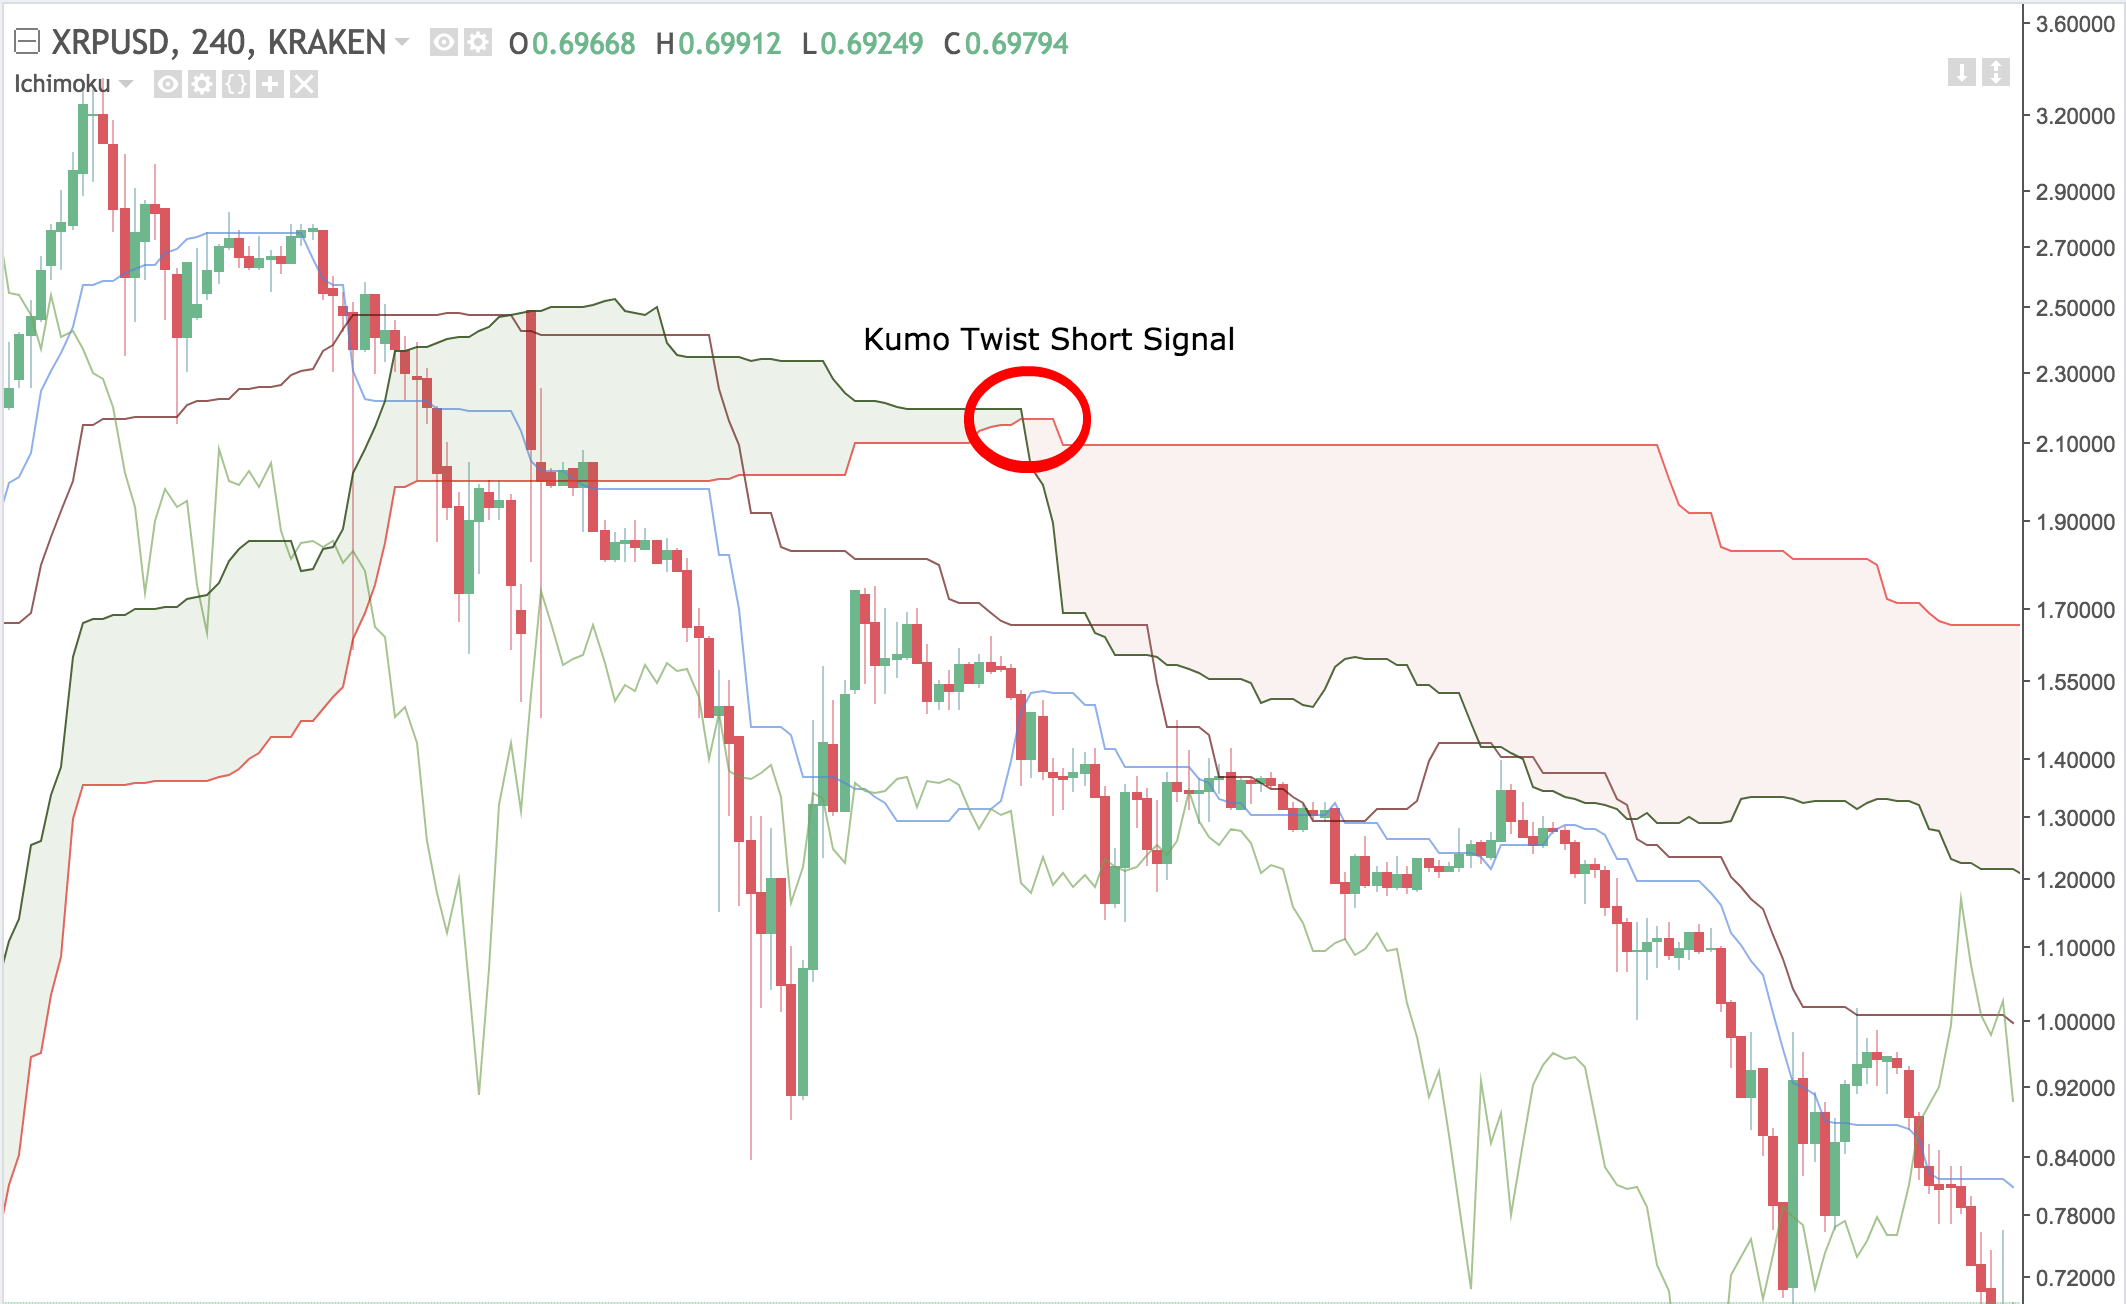
Kumo Twist
A Kumo Twist occurs when the Senkou Spans flip their orientation. It indicates a change of trend and can lead to profitable trades when traded correctly. Here's a recent example from Ripple.
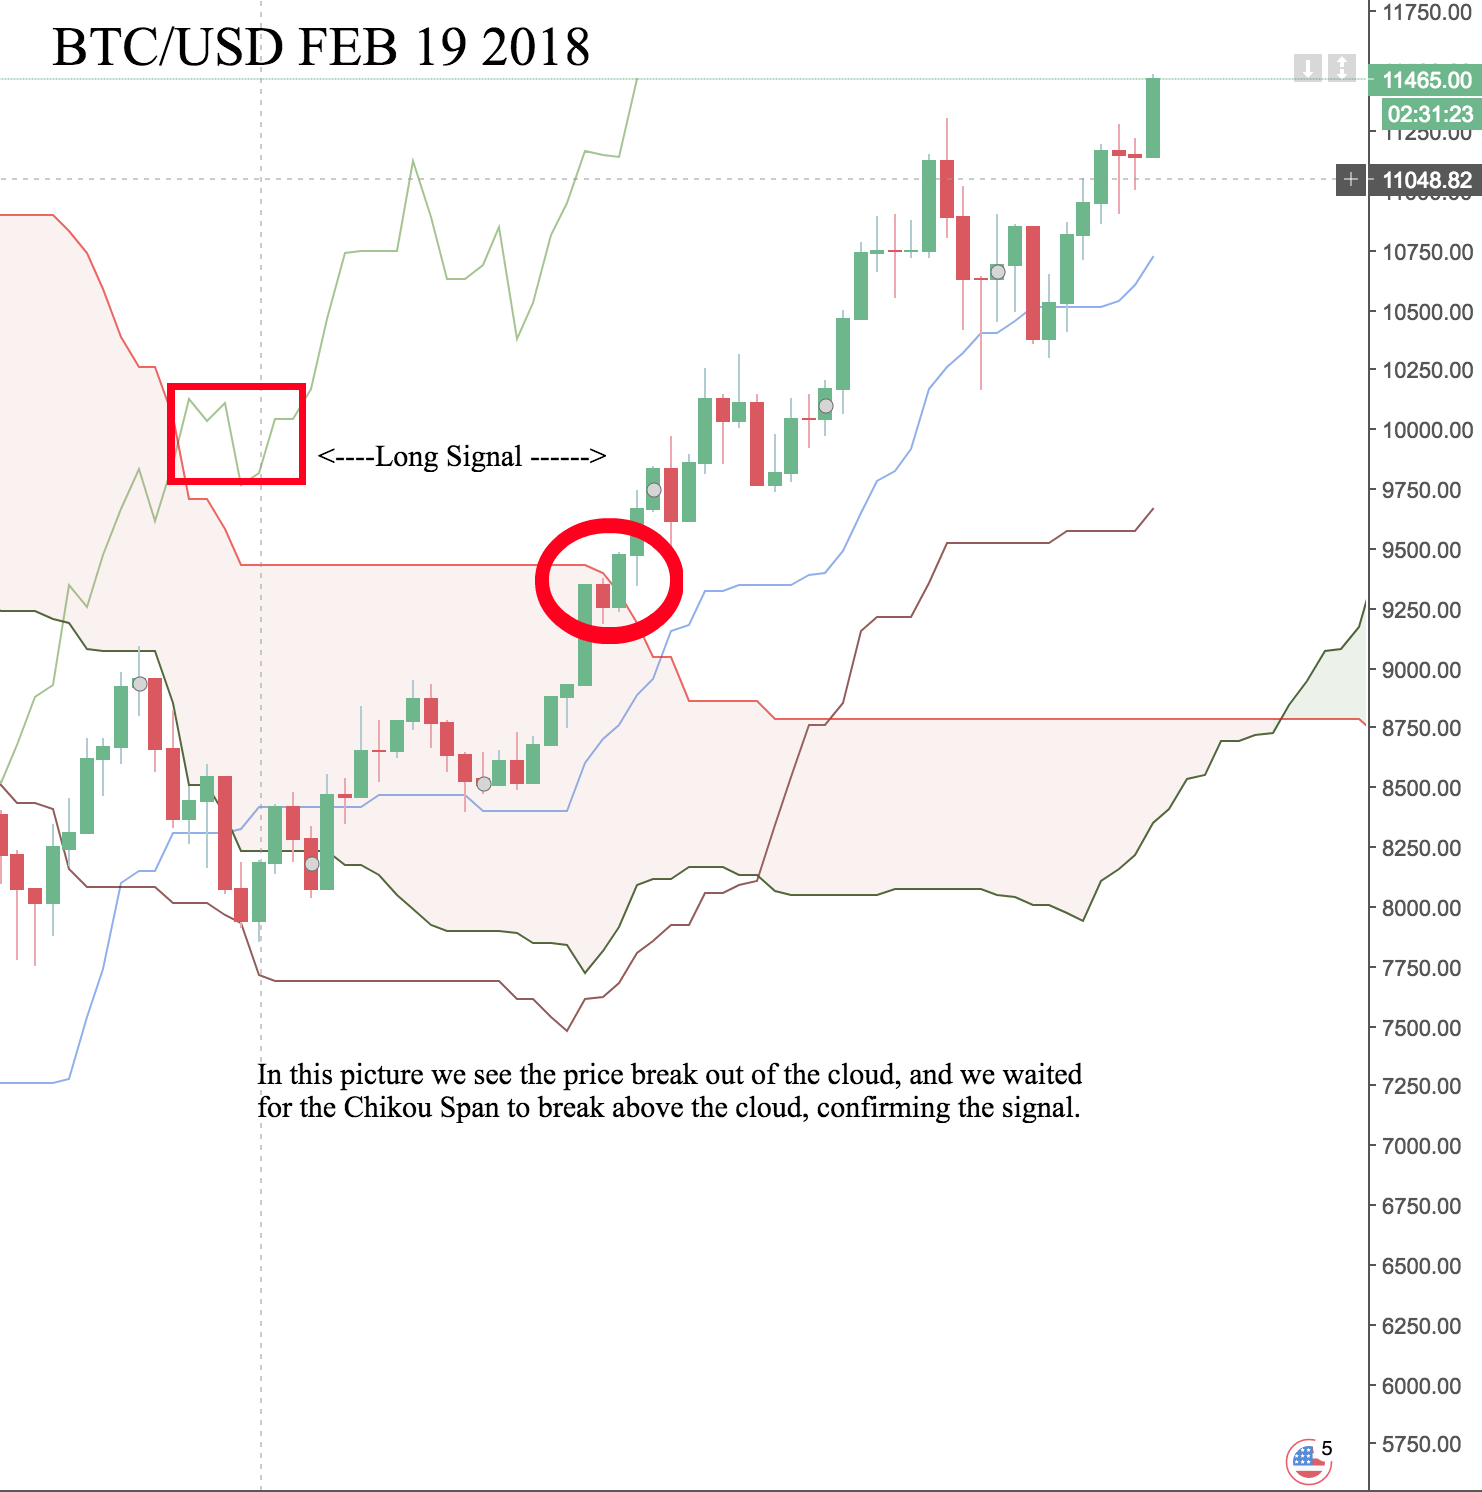
Kumo Breakout
Kumo Breakouts occur when the price breaks out of the cloud. The Chikou span should be referenced upon a breakout, and if that too is above the cloud, then this is a very strong signal that the trend is continuing. Below is an annotated example of Bitcoin.
Conclusions
The Ichimoku Cloud charting system is simply an indicator and will not always play out as expected. A combination of technical analysis and fundamental analysis allows for more consistent calls. Other indicators such as basic support and resistance, relative strength index (RSI), moving averages, and Bollinger Bands can also be used to help traders make higher probability decisions.