Technical Analysis May 20: Bitcoin, Ethereum, Bitcoin Cash, Litecoin and Ripple
Photo by Austin Neill on Unsplash
This week, cryptocurrency markets saw a severe drop as Bitcoin fell under the significant support level of $8,000. Although the markets appear to be recovering, traders are encouraged to remain extremely cautious. Using technical analysis, we will look deeper into the current price action of Bitcoin, Ethereum, Litecoin, Bitcoin Cash, and Ripple.
Disclaimer: This article is not meant to constitute trading/investment advice. Please use extreme caution when trading any cryptocurrency.
For this article, we will be using a handful of terminology that non-technical traders may not be familiar with. These terms are at the end of this article under “Glossary.” If you would like to read those terms now, click here.
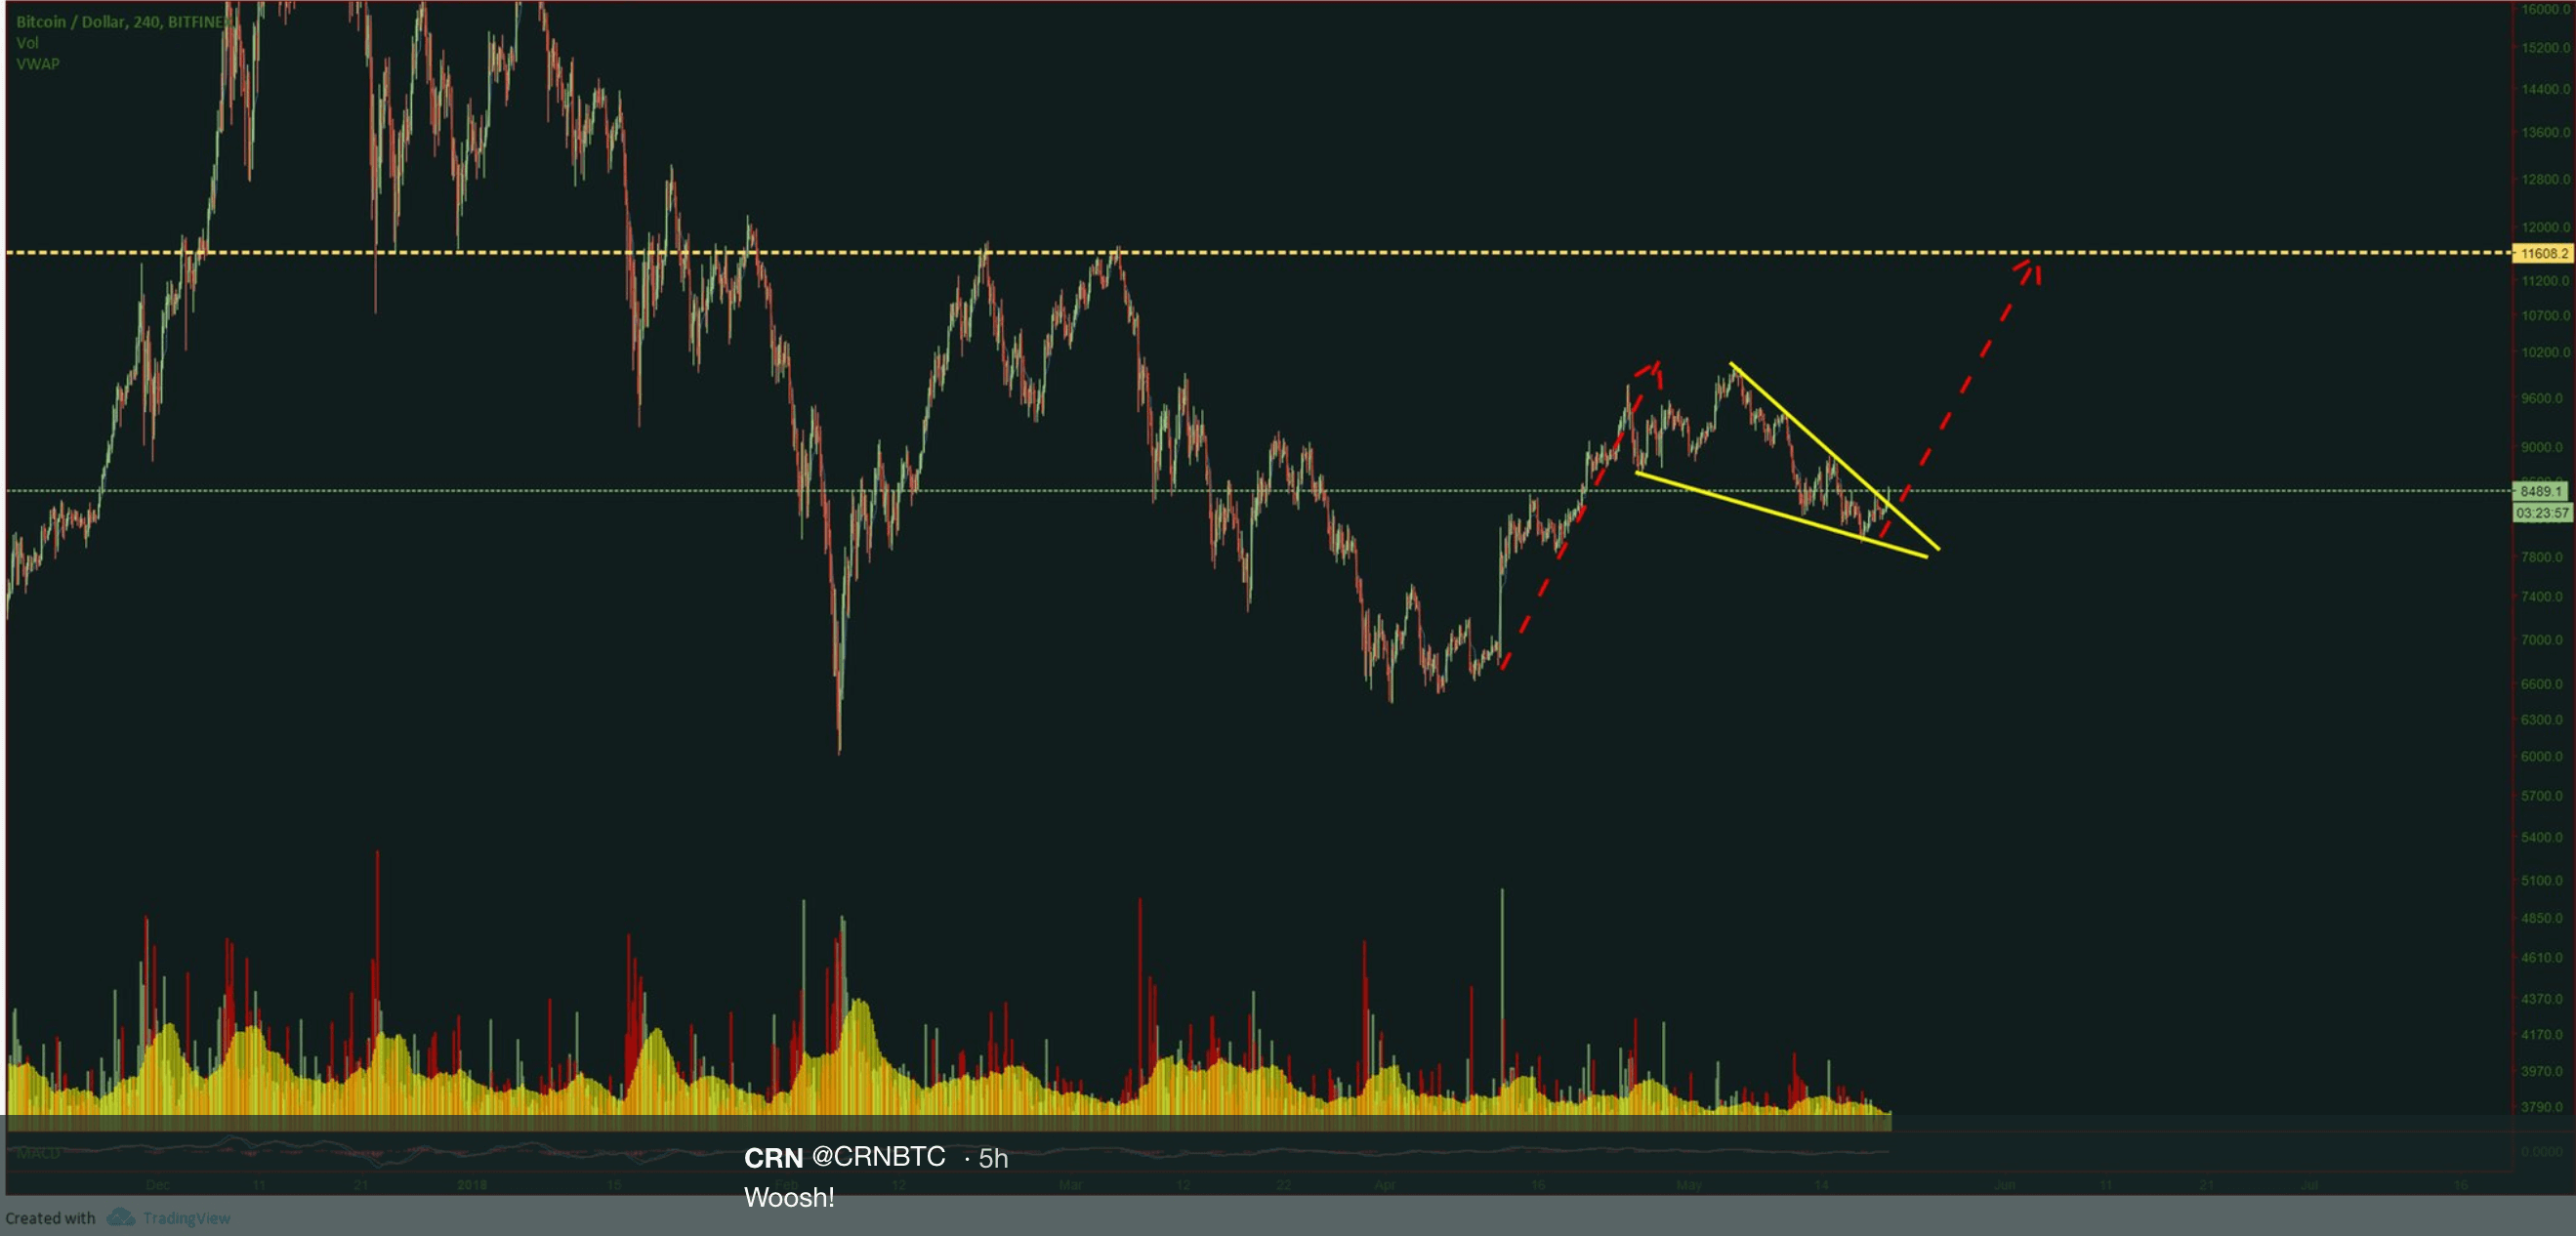
Bitcoin (BTC)
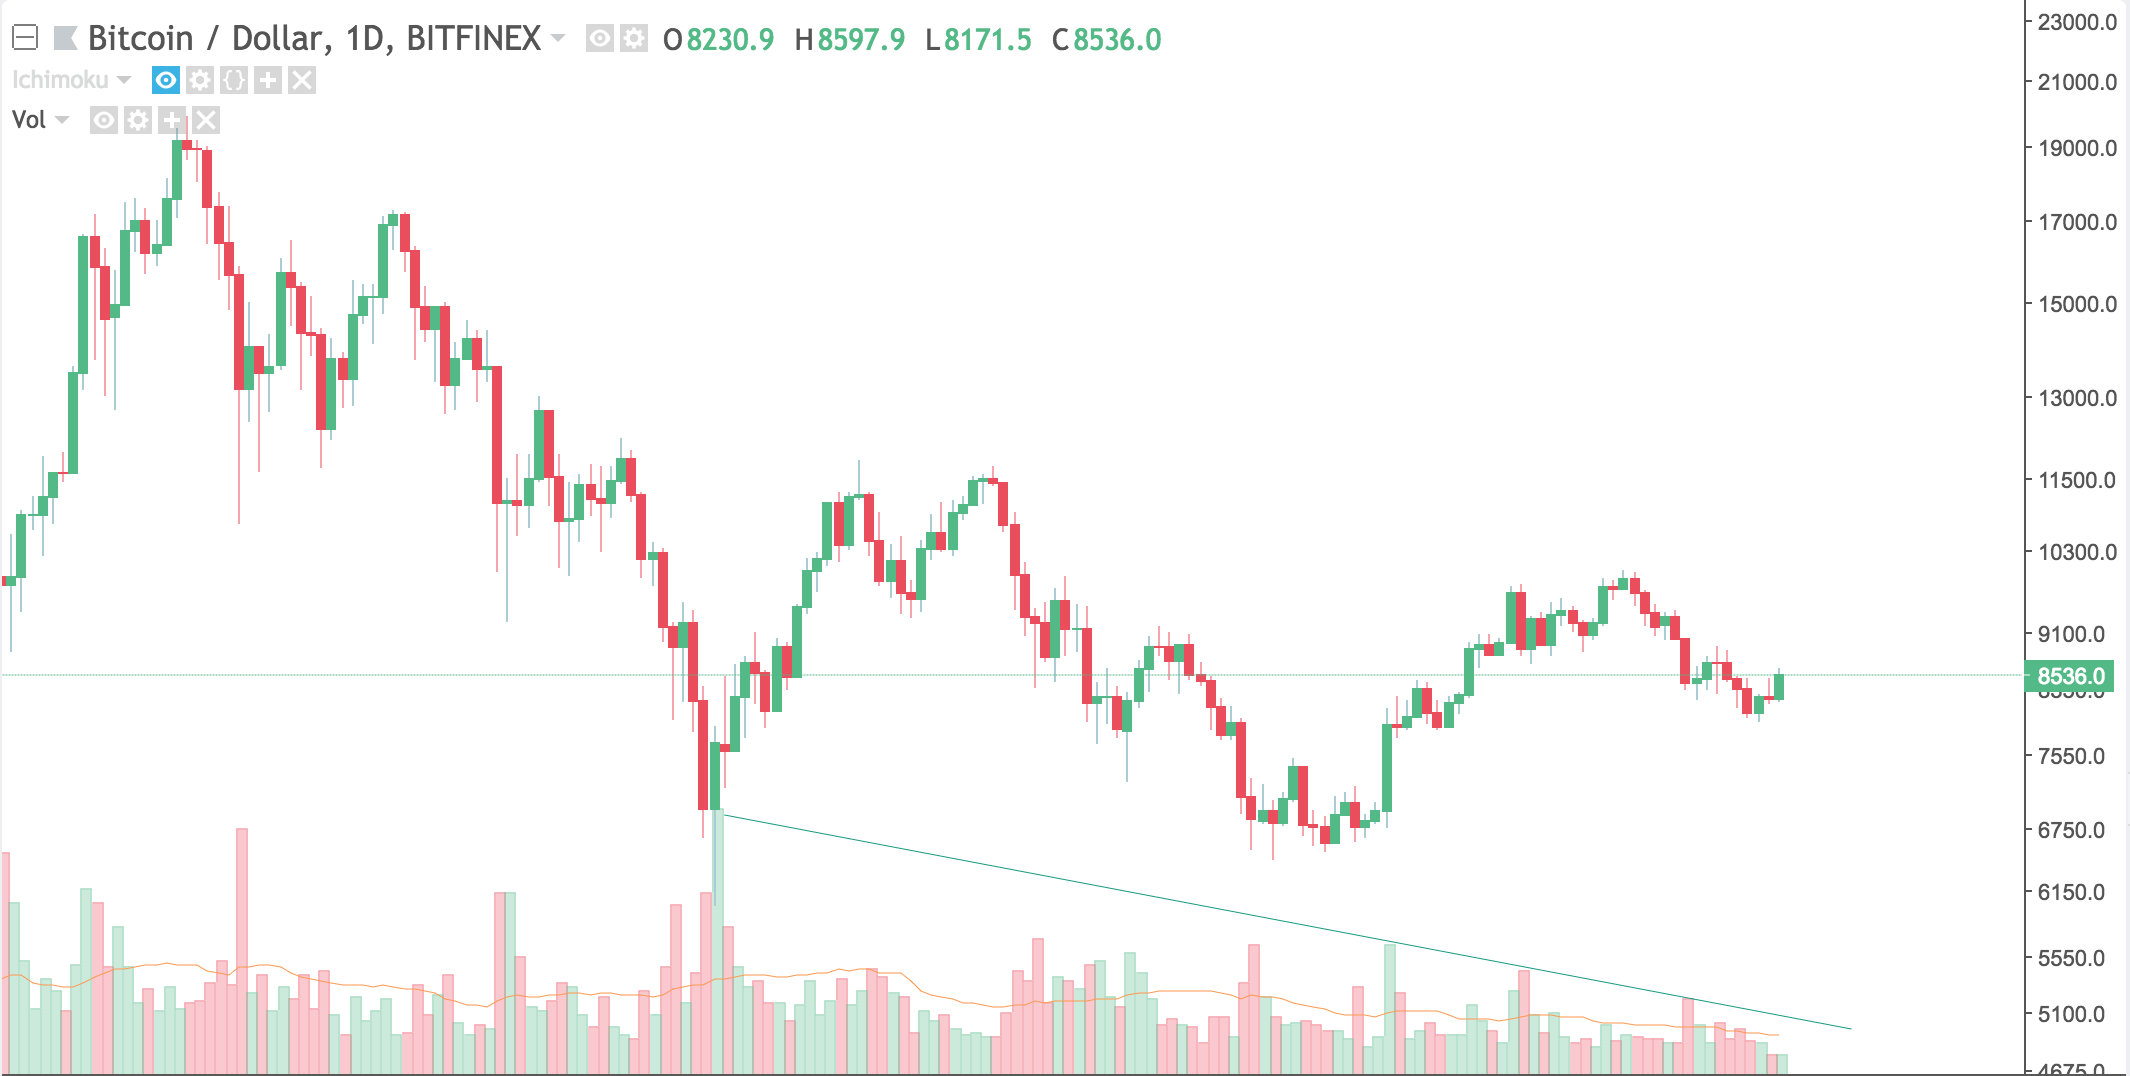
Bitcoin is currently sitting at $8,500, with a low of $7940 for the week. The local support level of $8,000 has held up remarkably well, meaning there are very few people willing to sell at that price. The trading volume is also extremely low, and in a clear downtrend since February.
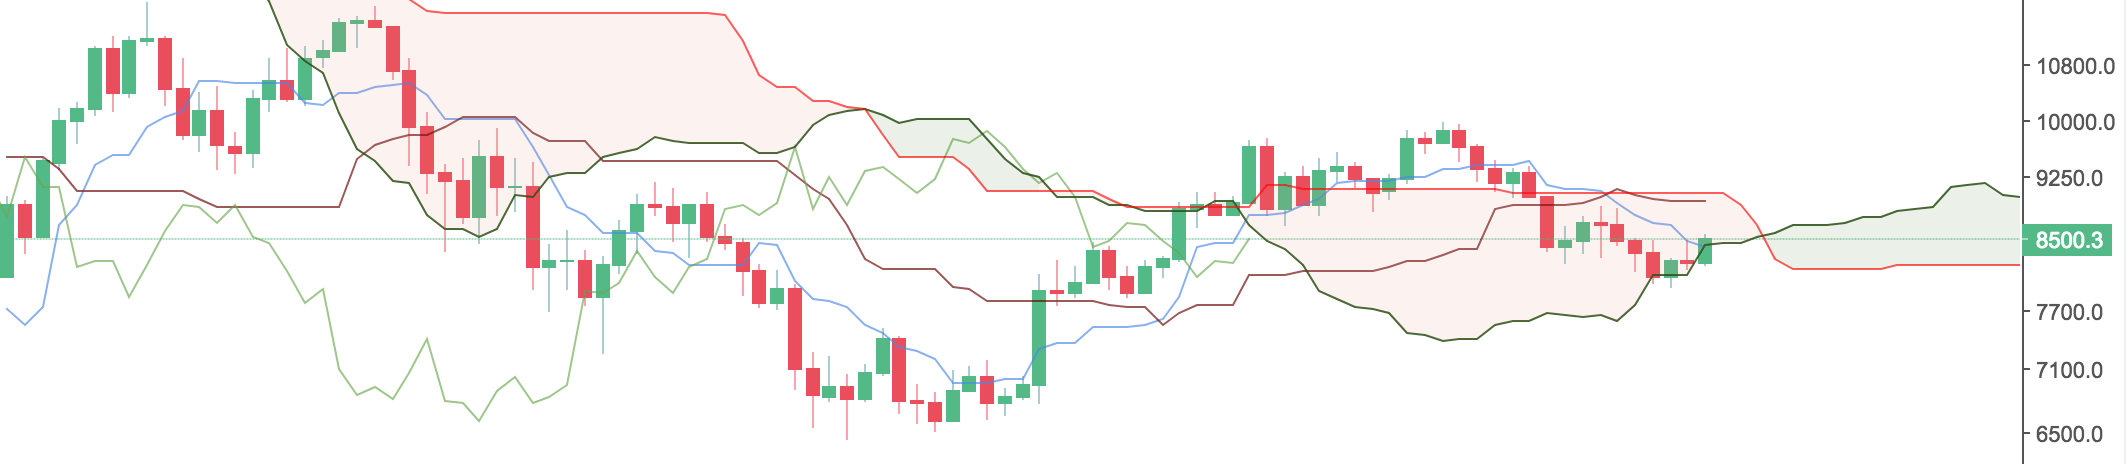
Looking at the cloud, we see that $8,000 was the bottom of a flat cloud. Once again, the cloud is here to save the day – the longer the time frame of a chart, the more significant TA tools will be. This is because information is collected over a longer period, making outliers less effective.
The TK cross we discussed last week ended up forming inside the cloud, leading to some downside. Bitcoin is currently moving above Tenkan-Sen and could be attracted to the current flat top of the Kumo Cloud.
Bitcoin recently broke out of a falling wedge, which is a bullish pattern indicating a possible reversal.
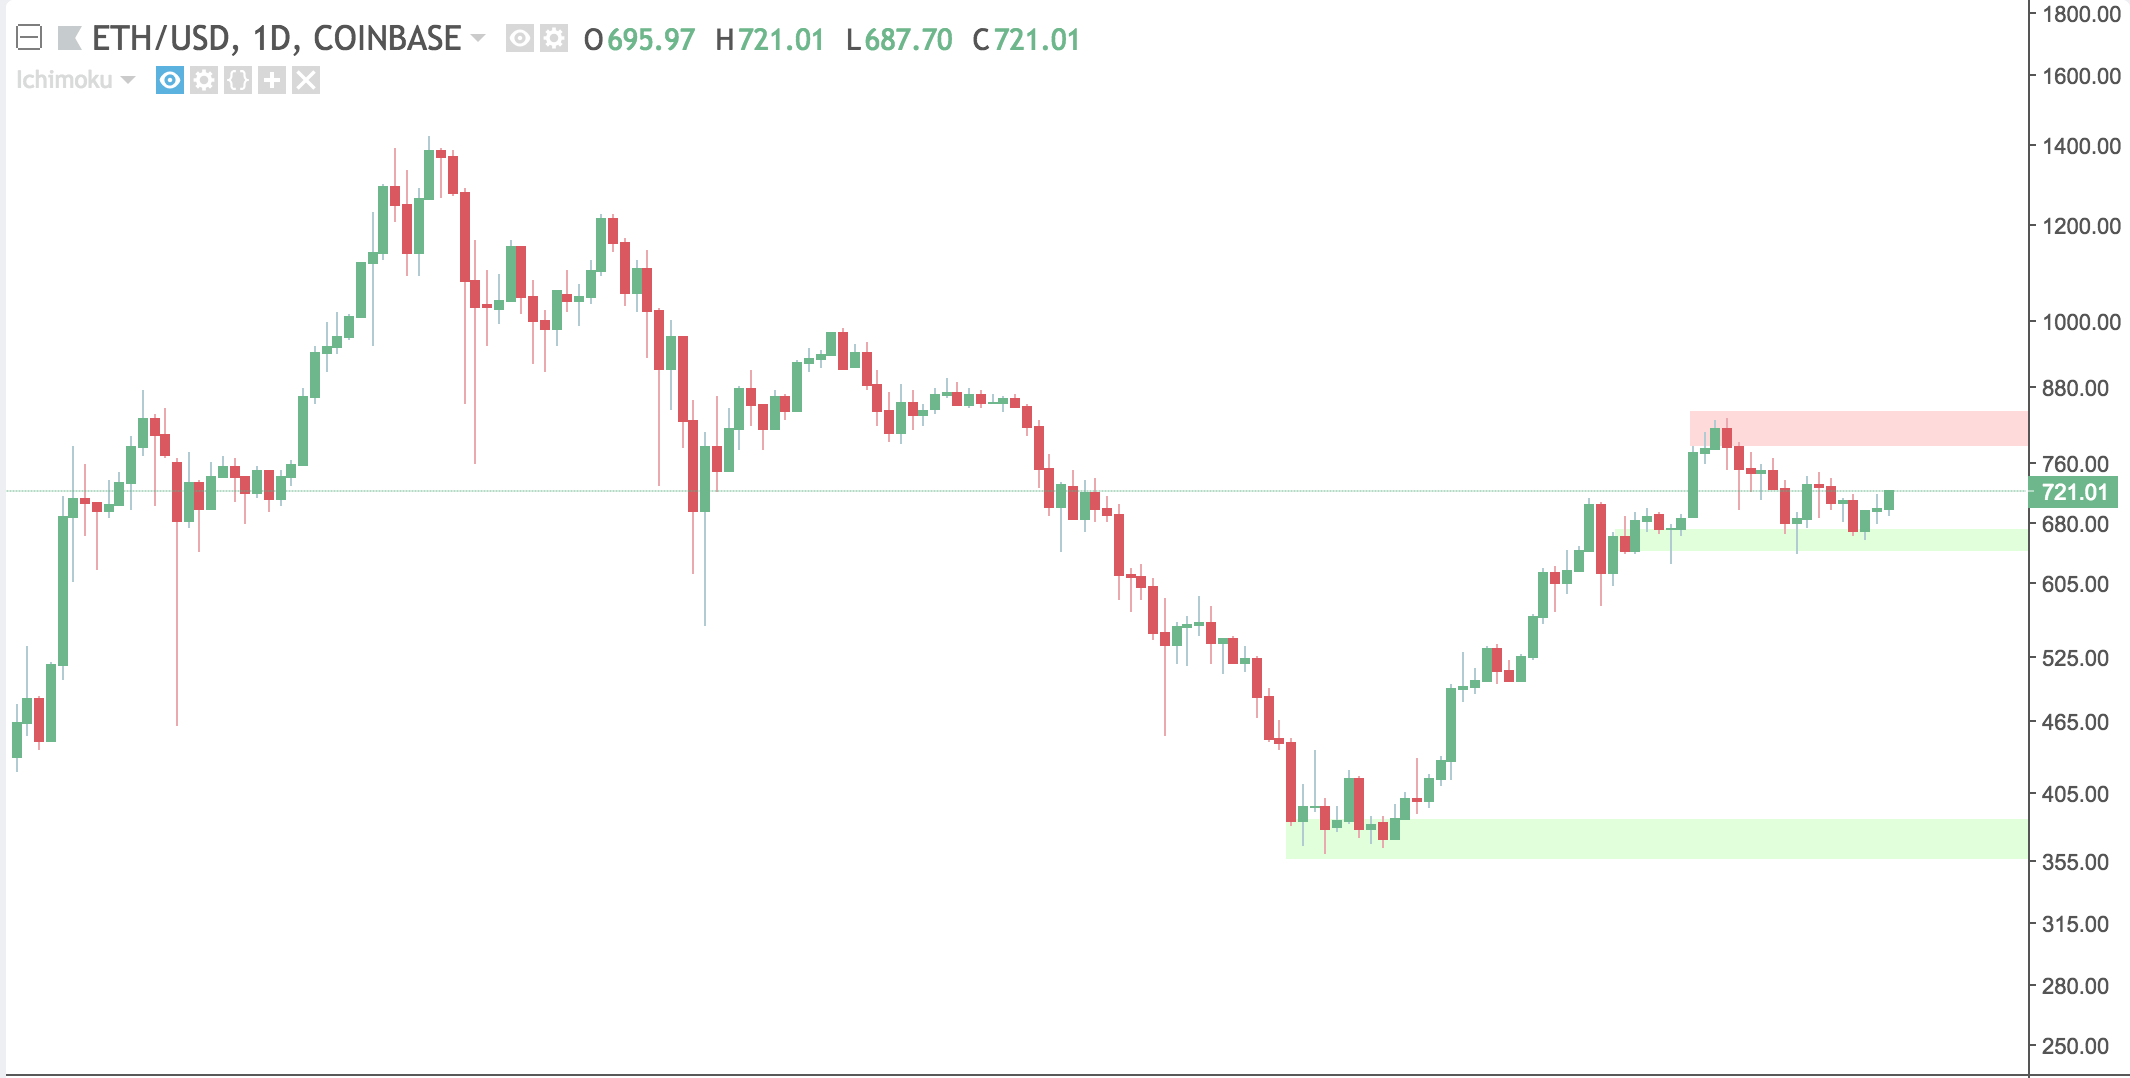
Ethereum (ETH)
Ethereum dipped under $650 briefly and is back at $720. Ethereum's next price challenge will be its local high of $820. It has clear support around $355, and local support of around $650.
Ethereum made a move above the Tenkan-Sen and Kijun-Sen and looks to be heading towards the earlier mentioned local high of $820. Currently, the slower moving average is on top, indicating a bear trend.
This most recent move is causing the Tenkan-sen, which is the faster moving average, to slope back upwards. A TK cross above the cloud is a clear sign of a bullish trend. In combination with the bullish cloud and lagging span exiting the cloud, I would start looking for a trade on Ethereum if a TK cross occurs.
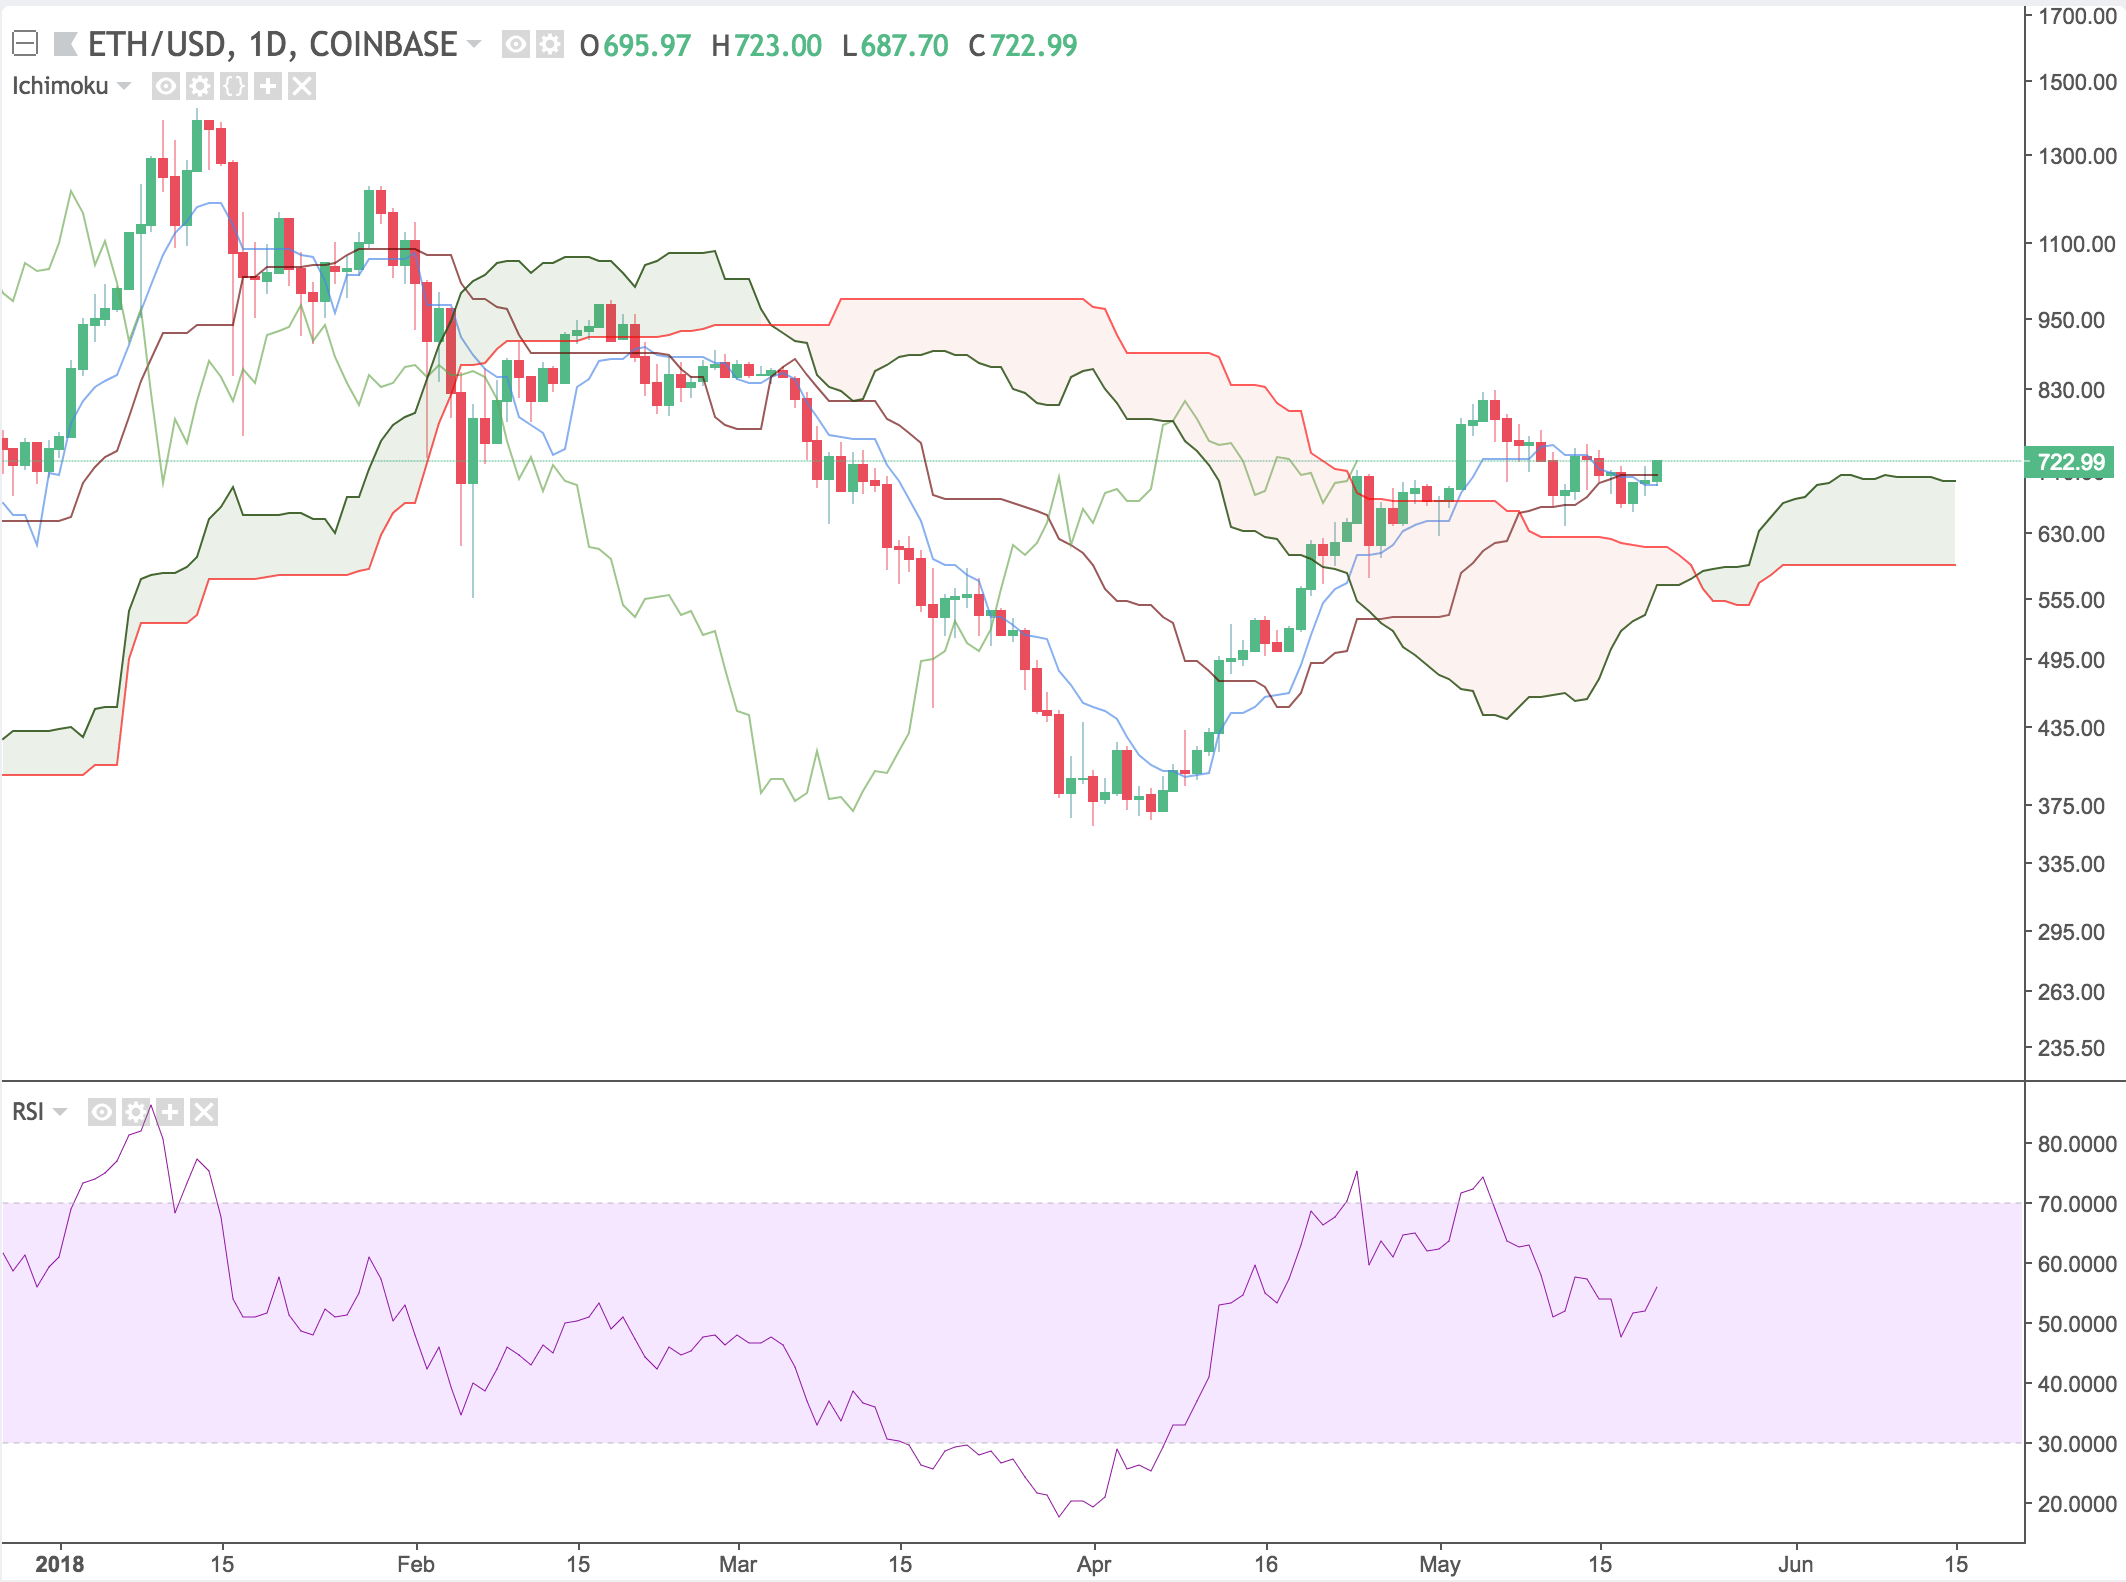
RSI is used to tell if an asset is oversold or overbought. While being overbought or oversold alone isn't the greatest indicators, it's more useful case is to find hidden divergence. This week, however, there are no major divergences.
Litecoin (LTC)
Litecoin fell to $128 after bouncing off the cloud support. It has strong support at the $110 level and the next major obstacle will be around $180, which is the top of the cloud.
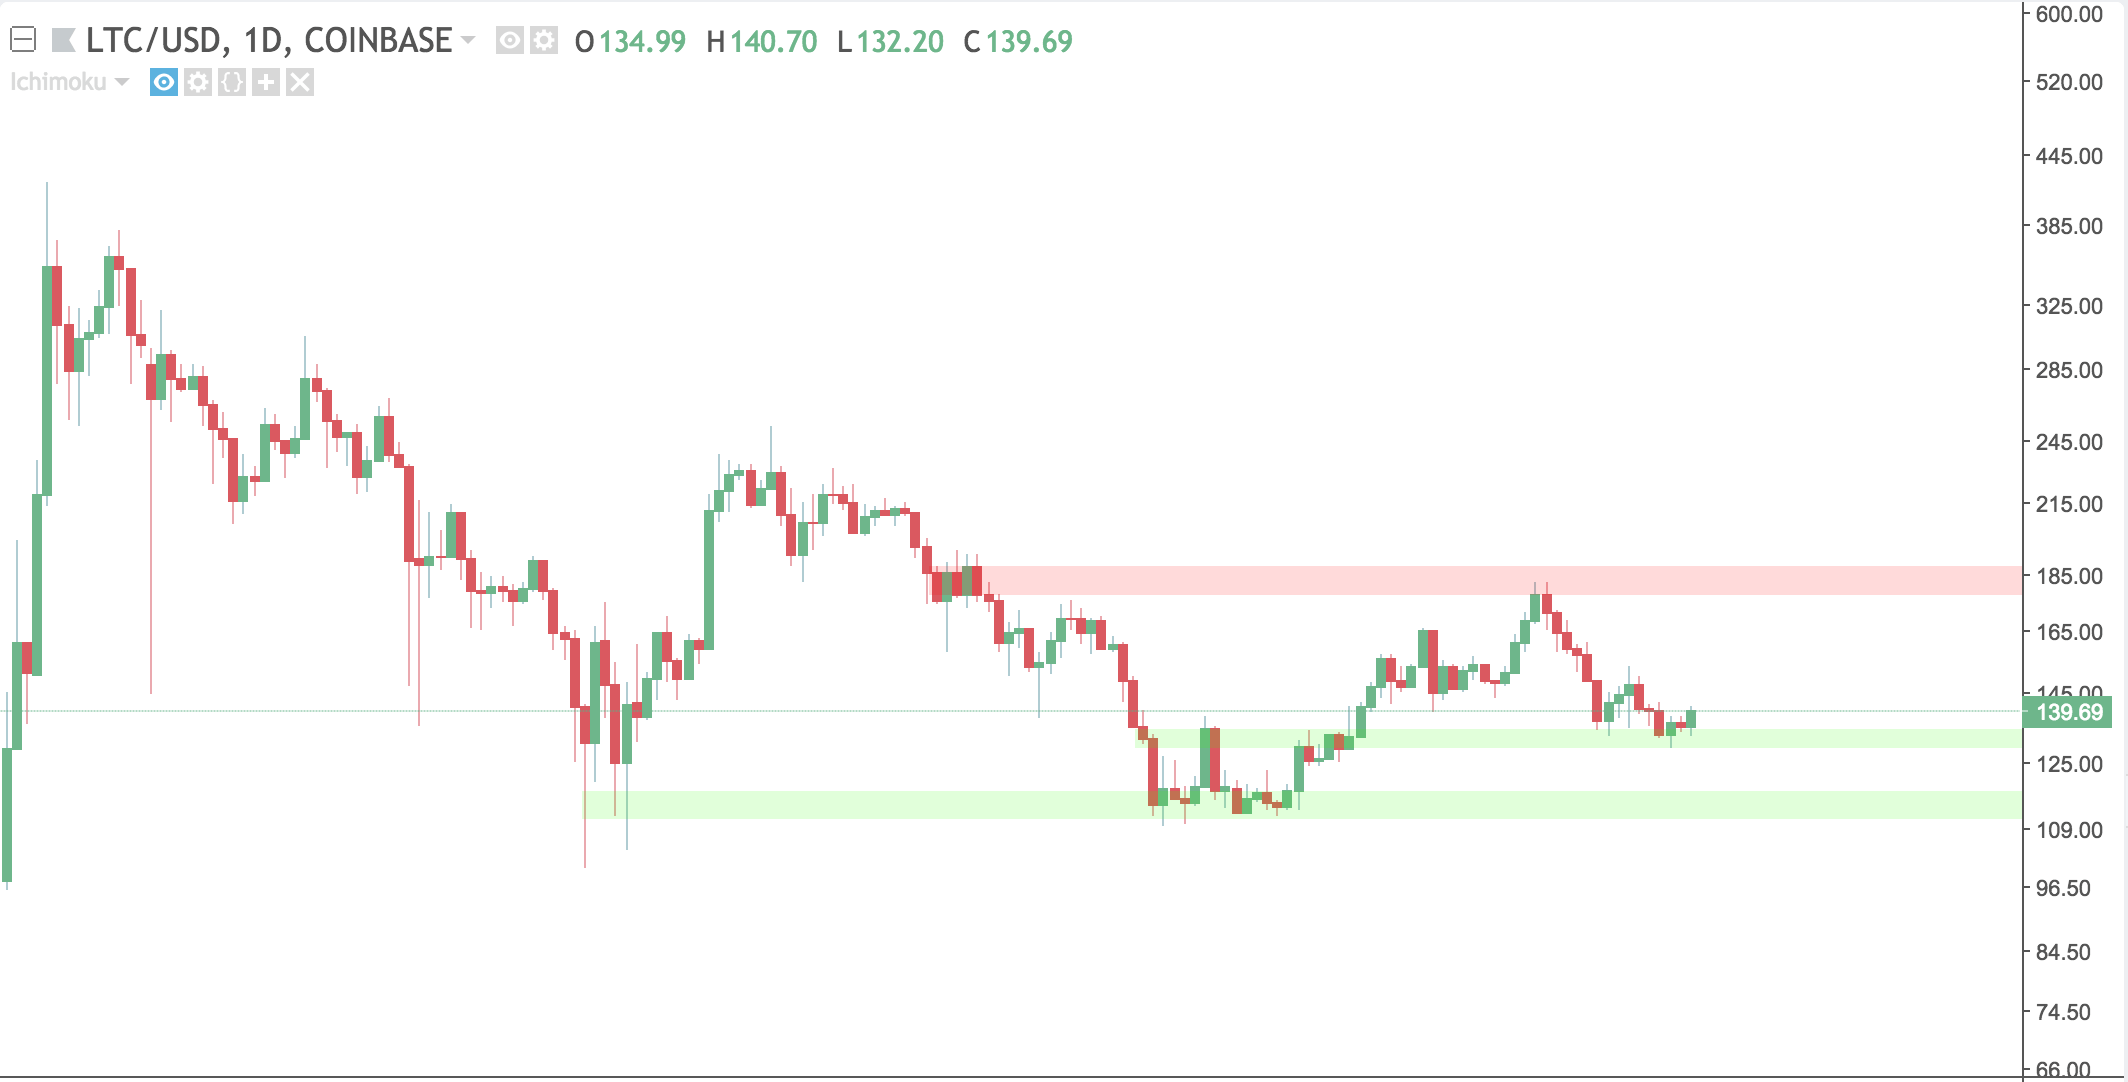
Adding Ichimoku Clouds to the picture, we learn a little bit more – the cloud is looking like it is going to flip bearish, and with price struggling to make it back into the cloud, this could indicate some more downside.
The cloud is formed by the Senkou spans, which are calculated by finding the midpoints between the Tenkan-Sen and Kijun-Sen over a period. Depending on the price action over the few days, we could see Litecoin flip even more bearish.
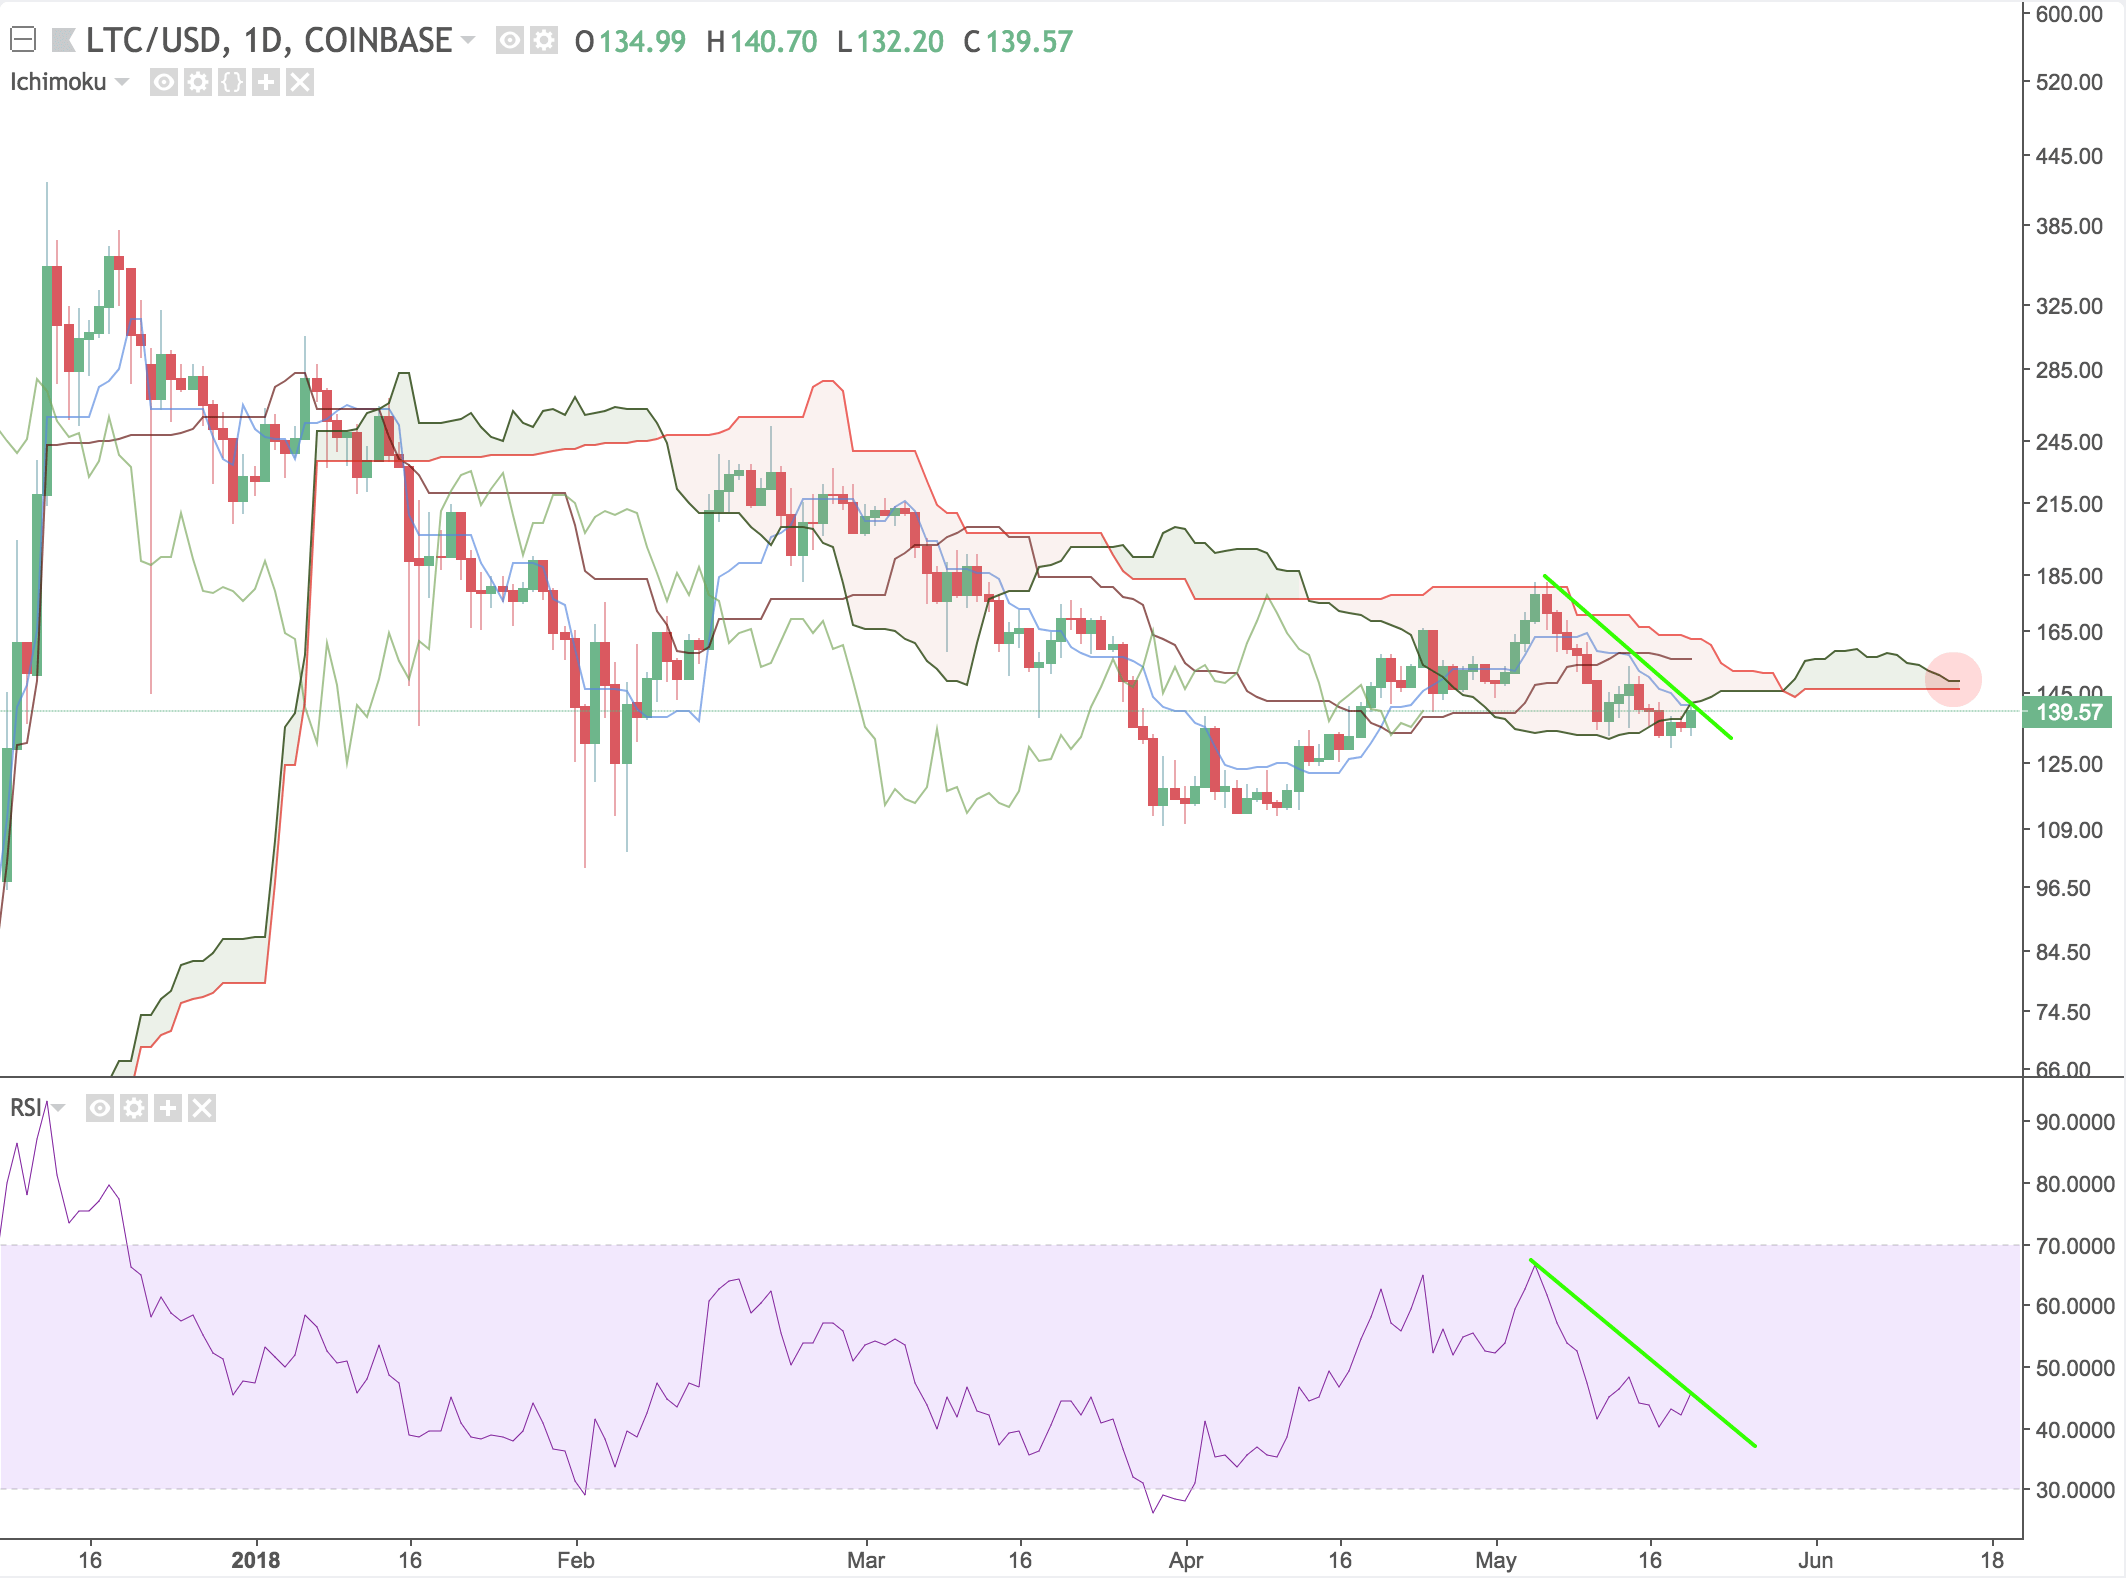
No RSI divergence is found on the 1D Litecoin chart, as both price and RSI are consistent. This can be seen using the green trend lines.
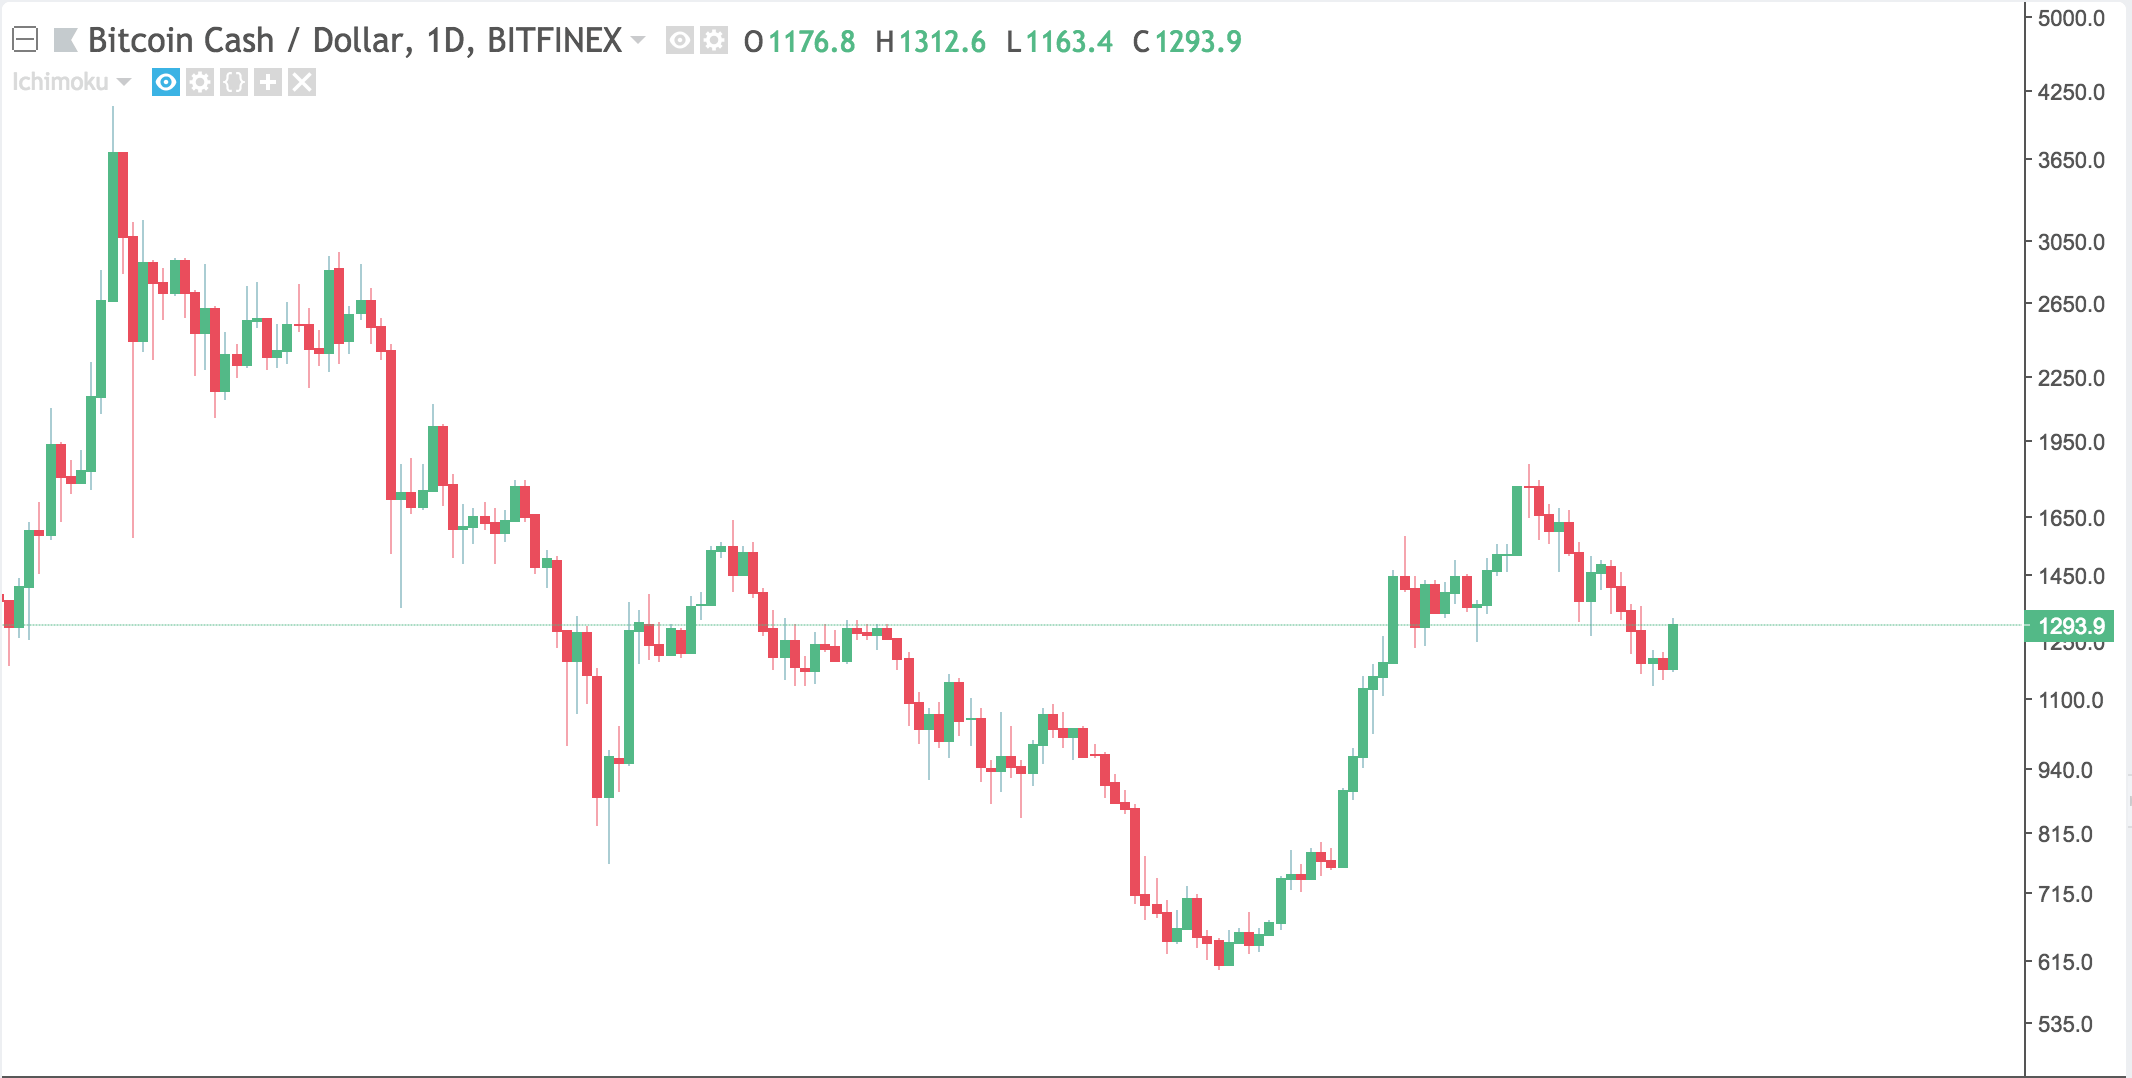
Bitcoin Cash (BCH)
After being the biggest gainer over the past few weeks, Bitcoin Cash (BCH) had a rough week falling from $1800 down to $1150. It currently sits around $1300. This could have something to do with the Bitcoin Cash hard fork that occurred on May 15th.
Hard forks are very controversial in cryptocurrency as it can cause old versions of software to no longer work. In this case, the block size was quadrupled from 8 megabytes to 32 megabytes, which is an enormous increase compared to Bitcoin's (BTC) one-megabyte blocks. While having a larger block size allows more and cheaper transactions, it comes with several downsides such as increased centralization.
Adding Ichimoku Clouds to the picture we see a few things. There was a TK cross above the cloud which is a bearish signal. The Tenkan-Sen is sloping hard, indicating high momentum in the market.
The cloud is still bullish, and the price seems to have recovered somewhat well. It's right under the Tenkan-Sen, so depending on how it reacts to the indicator it will be clear how to trade Bitcoin Cash.
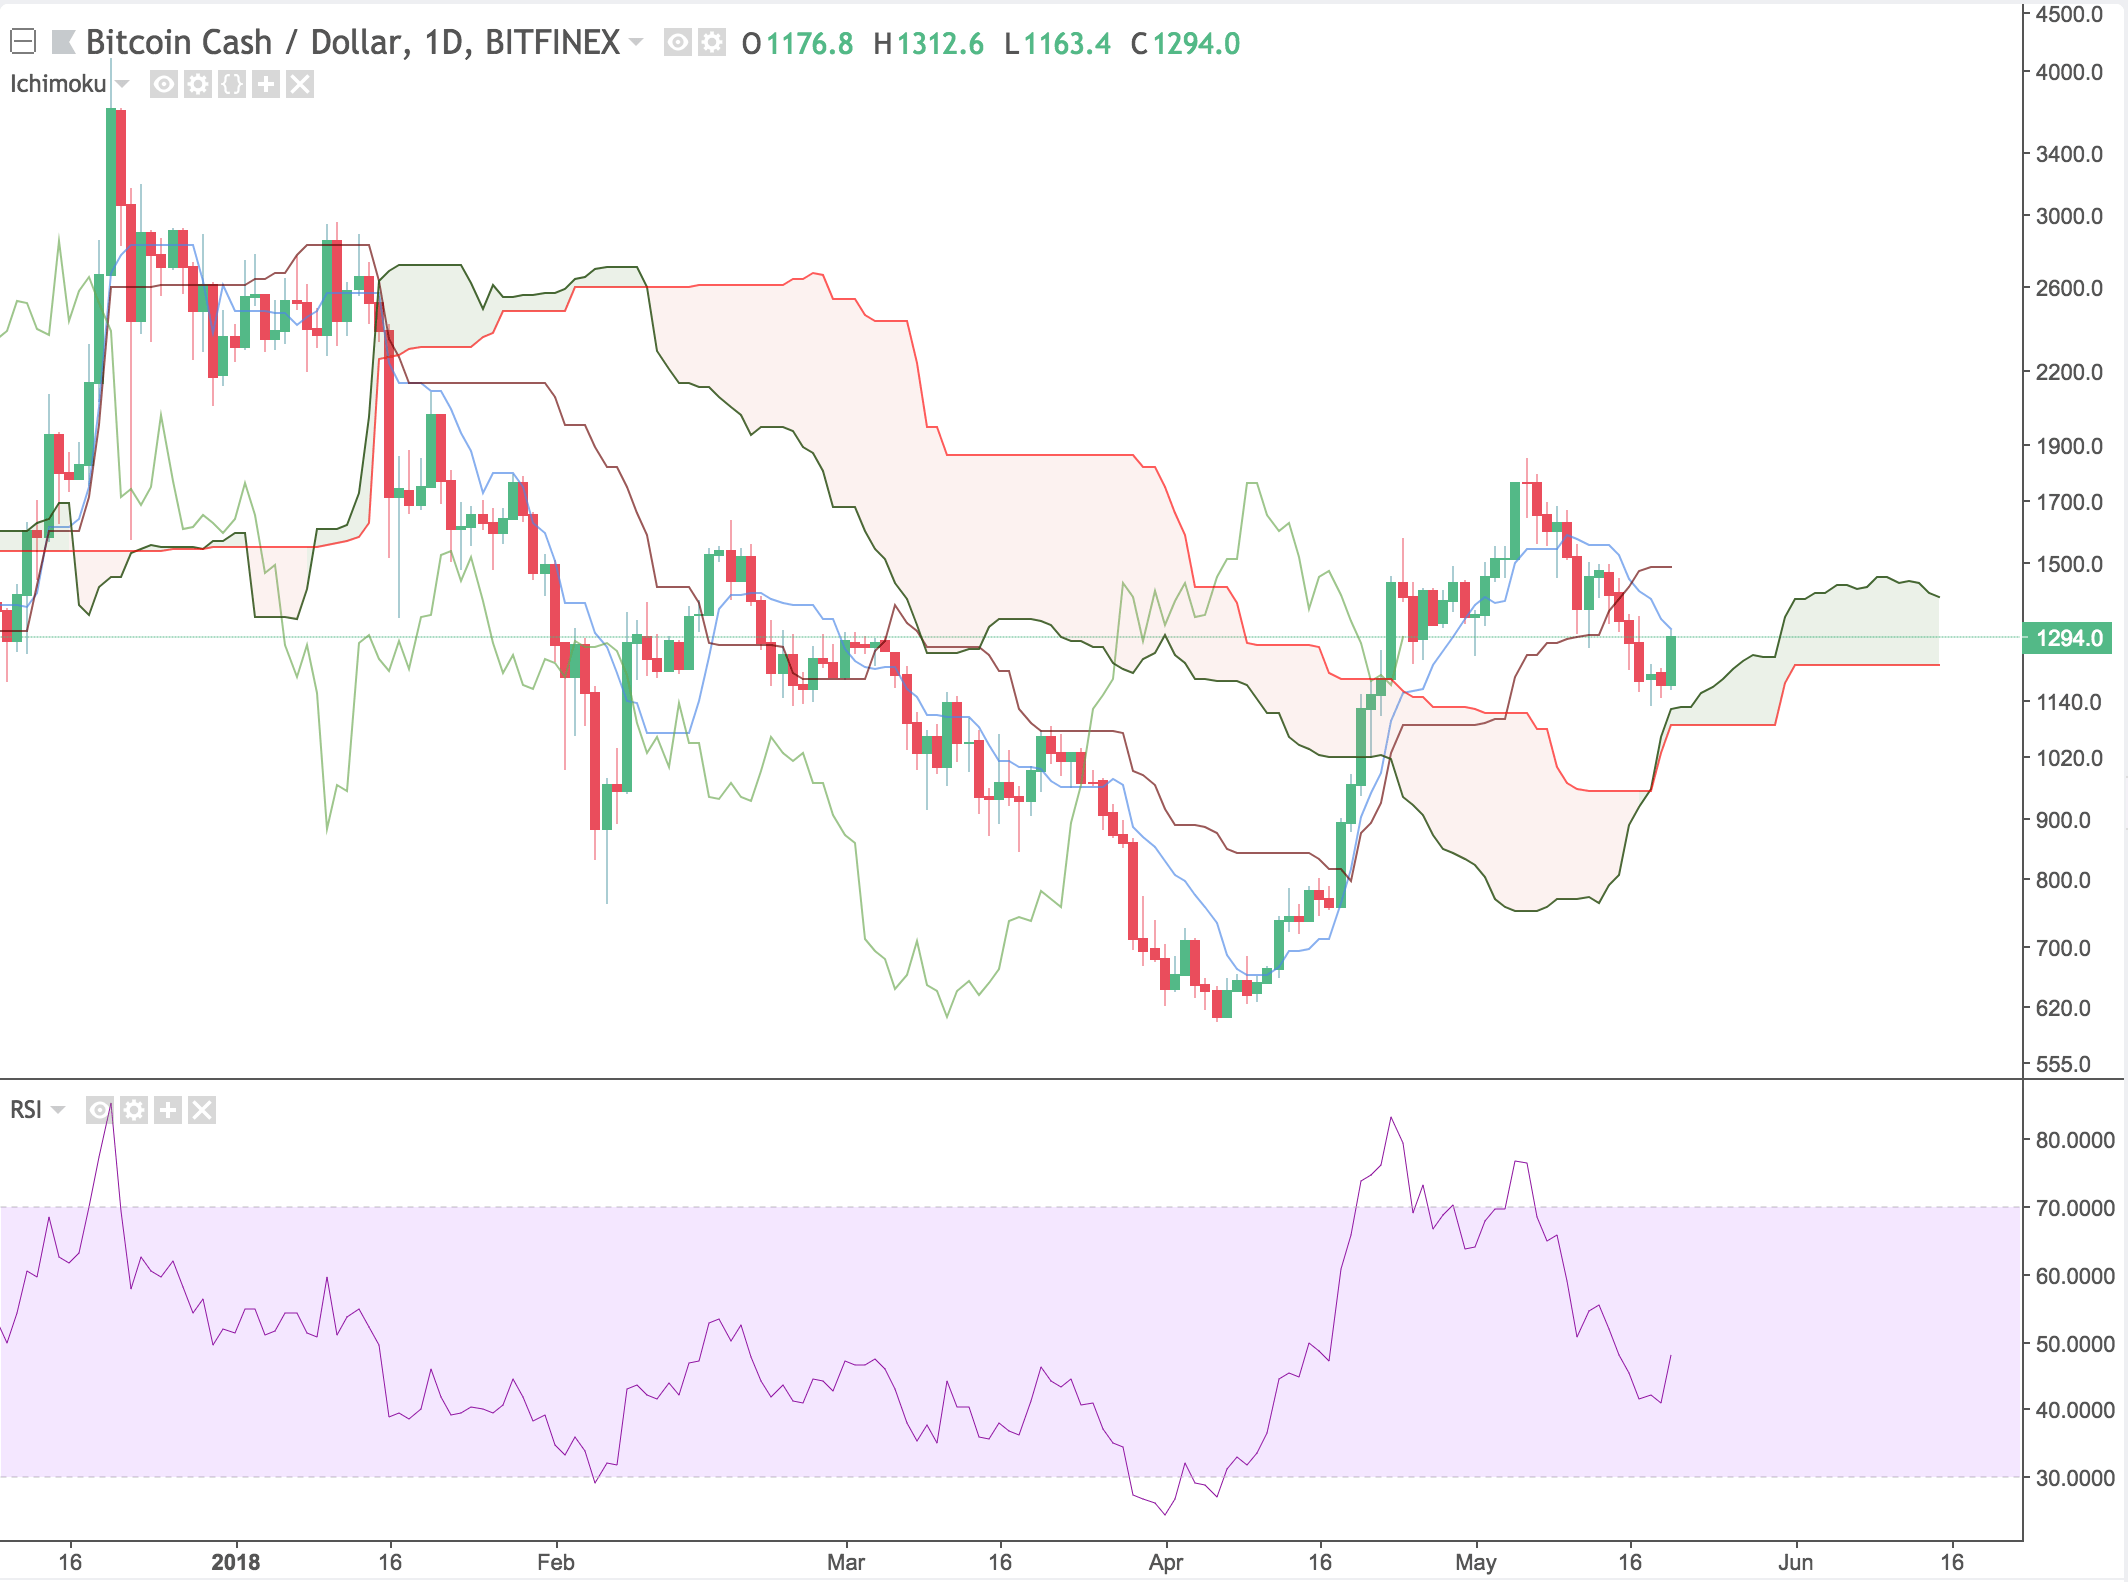
As far as RSI goes, no divergence can be spotted.
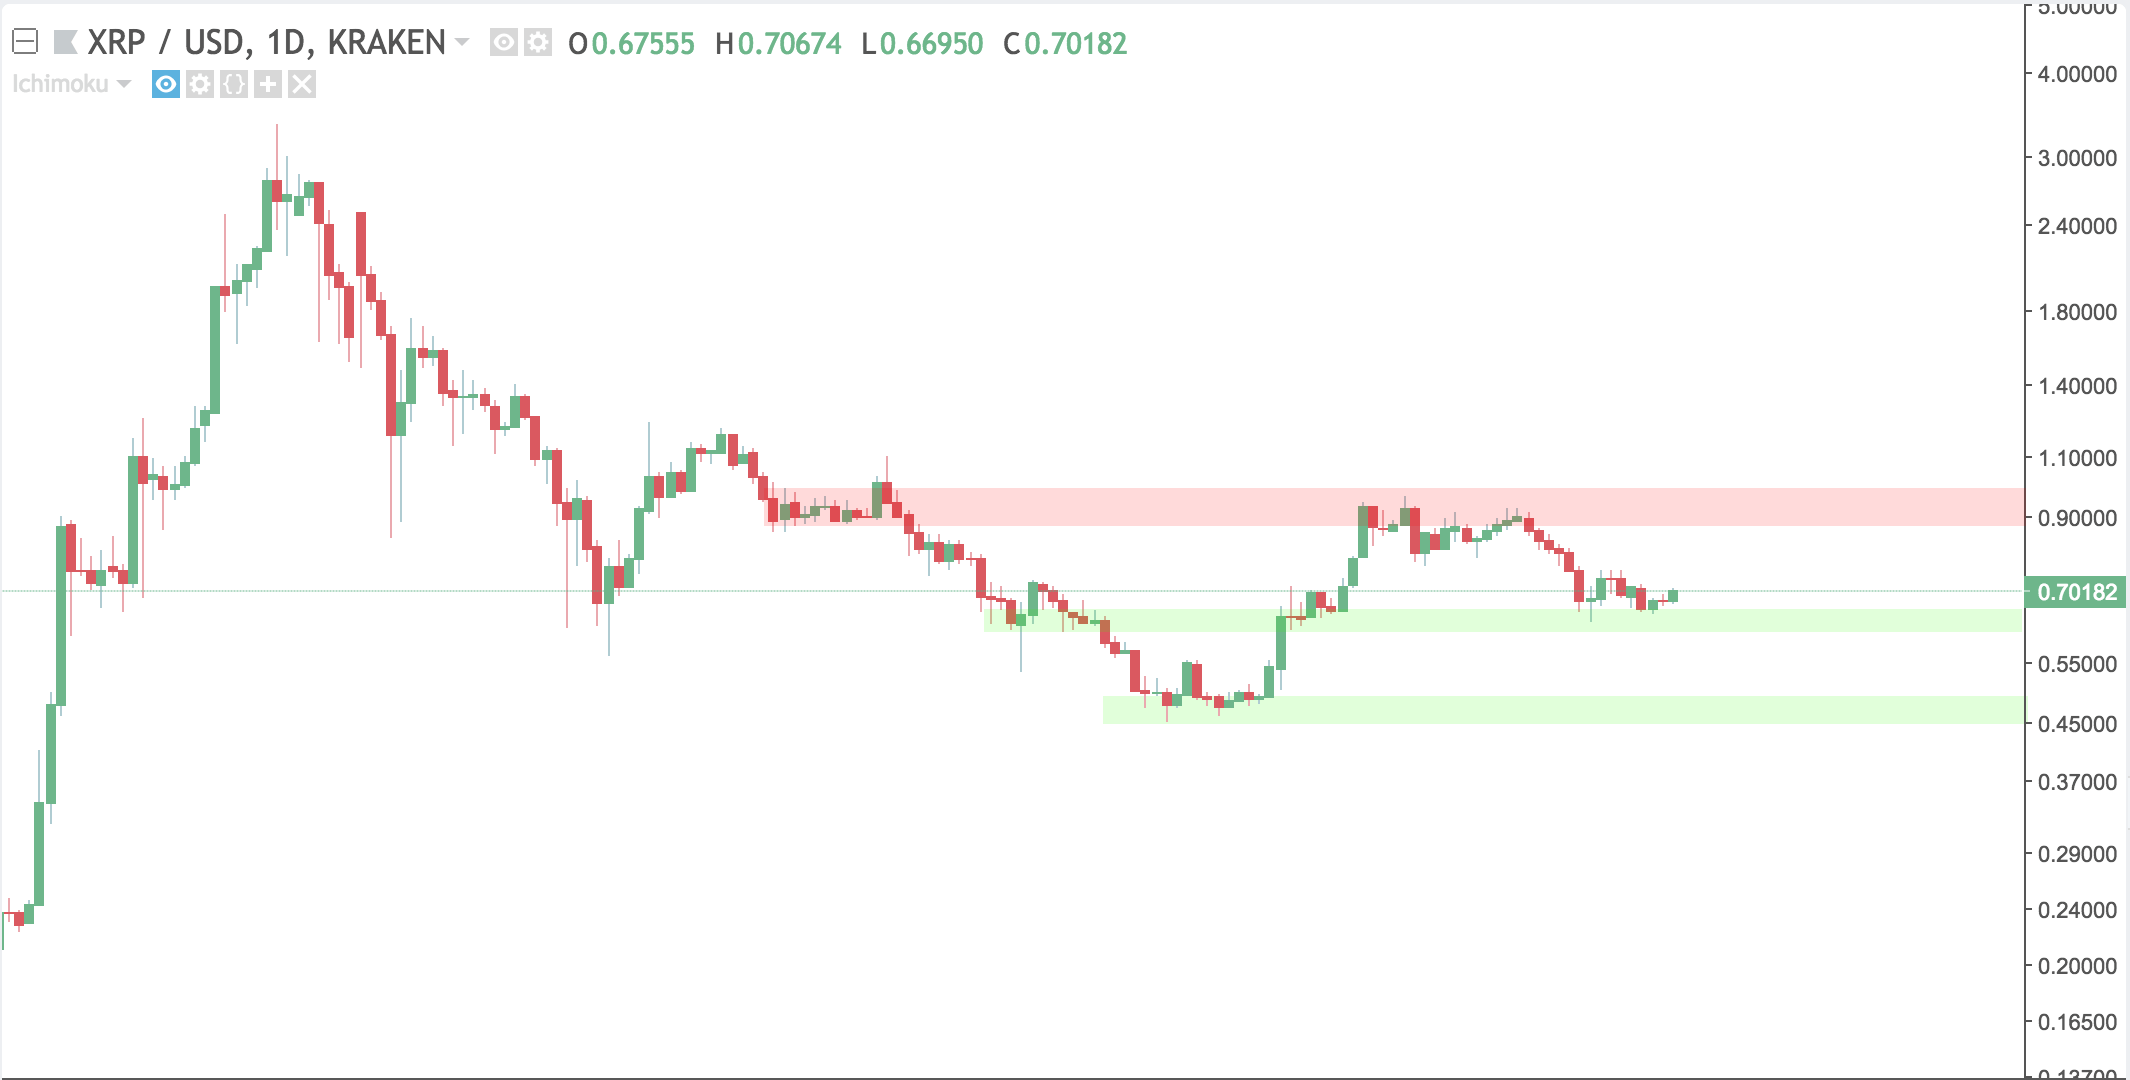
Ripple (XRP)
Ripple fell from $0.92 down to $0.63 and is currently sitting above local support at $0.70 cents. Ripple's resistance starts around its local high and is the top of a flat cloud shown in the next picture.
Ripple is currently outside of the cloud, and above the Tenkan-Sen. It is nearing the bottom of a bullish cloud, which is also flat. It would not be surprising to see Ripple retest the cloud as the price is usually drawn to flat parts of the cloud. There is also a bearish cloud forming supporting the downtrend.
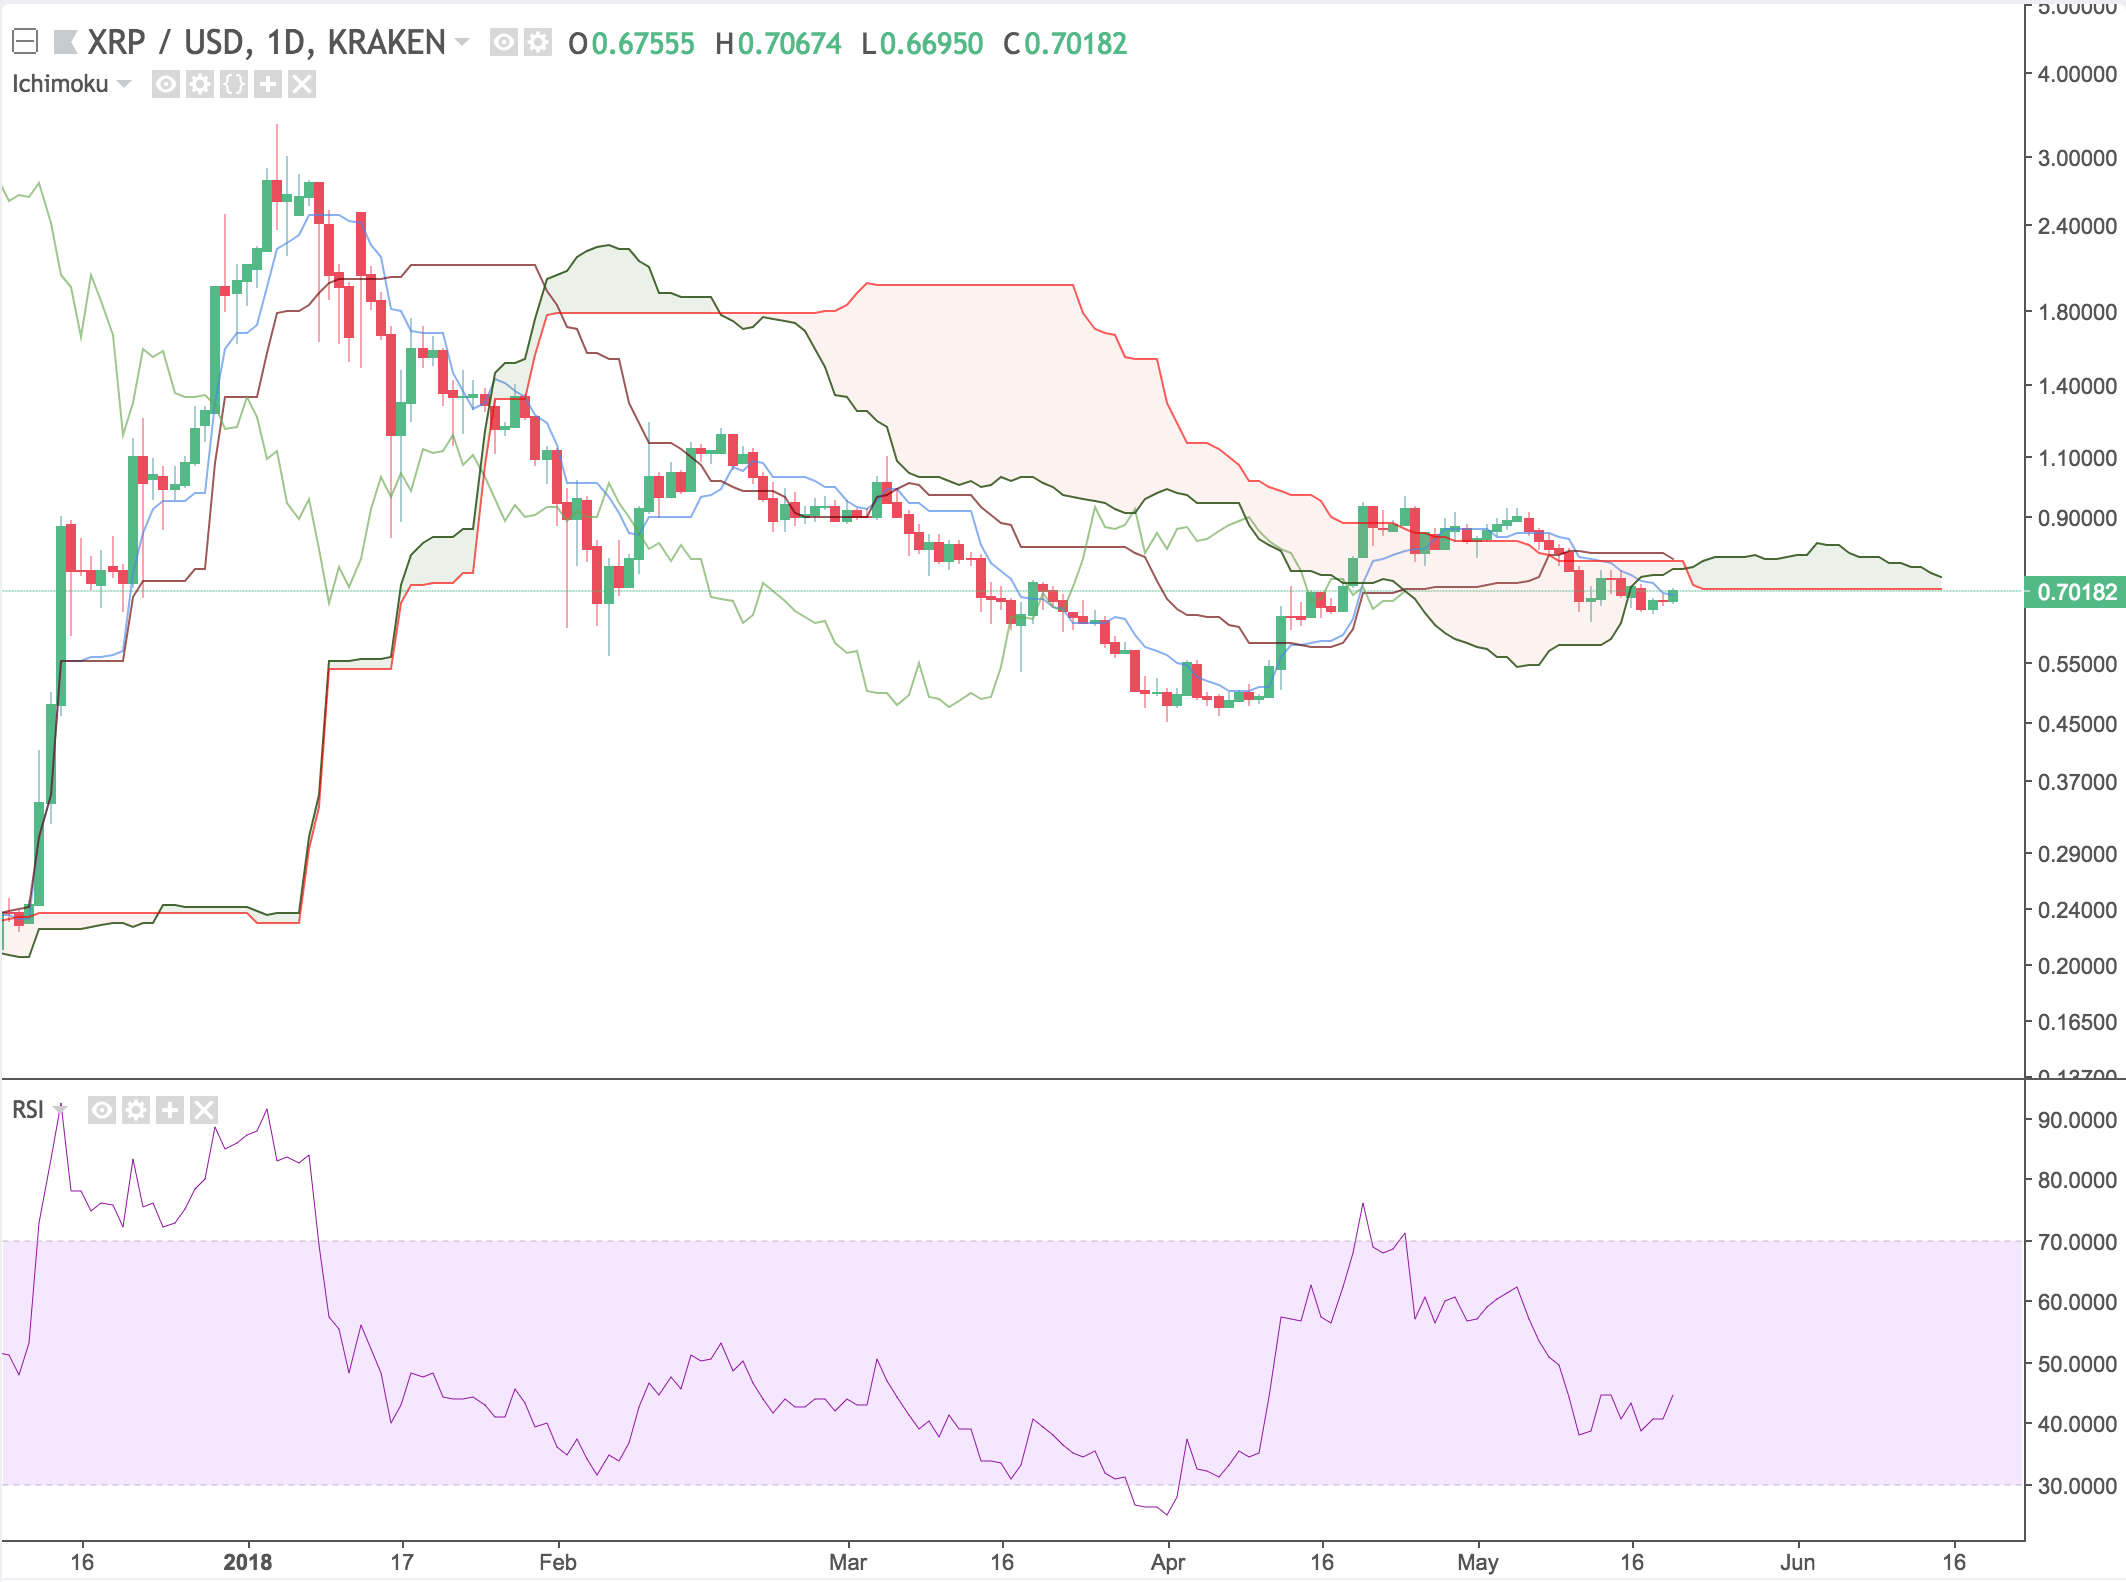
Similarly to Litecoin, if Ripple fails to break back into the cloud, and the cloud turns bearish, this could mean Ripple will see more sideways action or downside.
Conclusion
In the past, the annual Consensus conference has lead to an enormous increase in market capitalization during and after the event. This is mainly due to the increased exposure and attention the event brings.
The next few weeks should give a better idea of where cryptocurrency markets are heading. The historically low volume indicates that traders are waiting on the sidelines to get a better idea of what is going to happen in the future.
There are no guarantees with technical analysis, and this post is simply an interpretation of the current market situation.
To see some more cryptocurrency and trading-related content, follow Austin on Twitter.
Glossary
Here are the definitions for each of the technical analysis terms used in this article.
- Senkou Span A – an indicator that is used to measure momentum, as well as future areas of support and resistance. Senkou Span A is always drawn in relation to Senkou Span B – together, they form the cloud.
- Senkou Span B – forms the cloud along with Senkou Span A. Traditionally when Senkou Span B is located below Senkou Span A, it is a symbol of bullish price movement.
- Senkou Span cross – The cloud is an area of uncertainty. Most traders do not make a move until price closes above or below the cloud – although, when the Senkou Spans cross one another, many traders use the indicator to predict the reversal of a current price trend.
- Kumo Twist – The Ichimoku Cloud is a Japanese trading strategy, and ‘Kumo’ means cloud in Japanese. The Kumo Twist is just a nickname for a Senkou Span cross.
- Tenkan-Sen – The Tenkan-Sen is used in conjunction with the Kijun-Sen to predict long and short positions. The formula for the Tenkan-Sen’s calculation takes the highest high and the lowest low and divides it by two over the last seven to eight time periods.
- Kijun-Sen – Similarly to the Tenkan-Sen, the Kijun-Sen is calculated using the same formula, but it usually includes the last 22 time periods. The Tenkan-Sen highlights short-term price movement, while the Kijun-Sen gives a better idea of long-term price movement.
- TK crossover – When the Tenkan-Sen crosses above the Kijun-Sen, it is an indication of bullish price movement. Conversely, the Tenkan-Sen crossing below the Kijun-Sen is a bearish sign. Both of these signals are known as a TK crossover. The location of the TK crossover impacts the strength of the signal. For example, a bullish TK crossover below the cloud is in bearish territory, and therefore a weak signal. On the other hand, a bullish TK crossover above the cloud is a strong signal.
- Chikou Span – Otherwise known as the Lagging Span, Chikou Span shows where the price was 26 periods before the most recent closing price. An upwards Lagging Span above price shows bullish momentum, while a Lagging Span below price shows bearish momentum.
- Volume – Is the amount of a stock, currency or asset exchanged in a given period of time. This can be expressed in terms of the unit (ex. Bitcoin) or standardized in terms of a currency such as dollars.
- Momentum – Momentum measures the strength or rate of acceleration of price action.