Technical Analysis: EOS, Cardano, NEO, IOTA and TRON

Photo by Mathieu Turle on Unsplash
Cryptocurrency markets have pulled back slightly from their bullish sentiment over the past week. In this article, we will use technical analysis to look at the current price movements of EOS, Cardano, NEO, IOTA, and TRON.
Disclaimer: This article is not meant to constitute trading/investment advice. Please use extreme caution when trading any cryptocurrency.
For the purposes of this article, we will be using a handful of terminology that non-technical traders may not be familiar with. These terms are at the end of this article under “Glossary.” If you would like to read those terms now, click here.
EOS (EOS)
EOS had a significantly bullish runup over the past month, rising from around $6 to its all-time high of $22.89 – however, over the past week, it has consolidated after finding resistance just shy of $23.00.
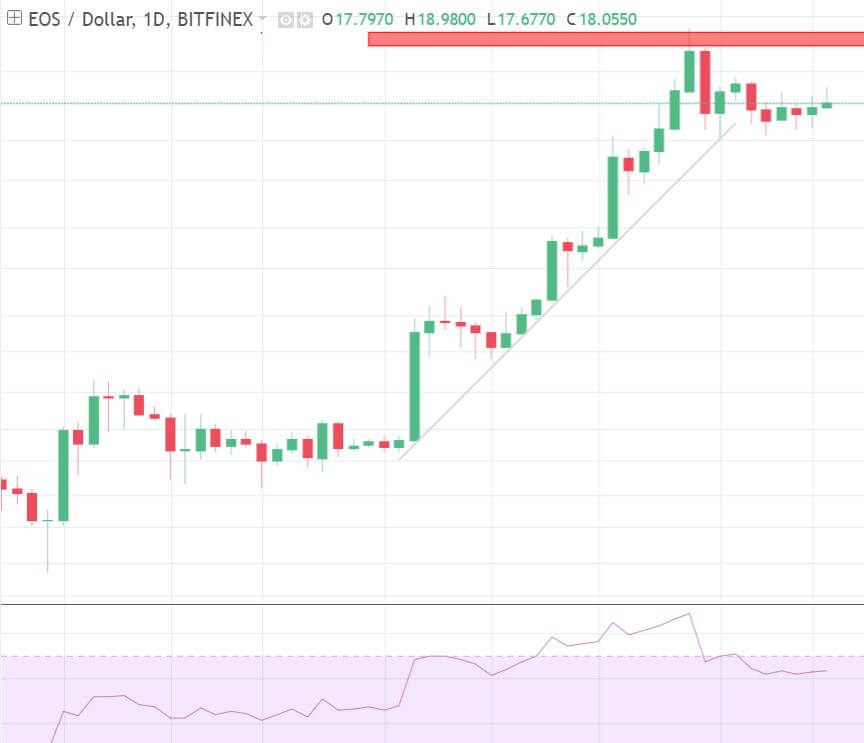
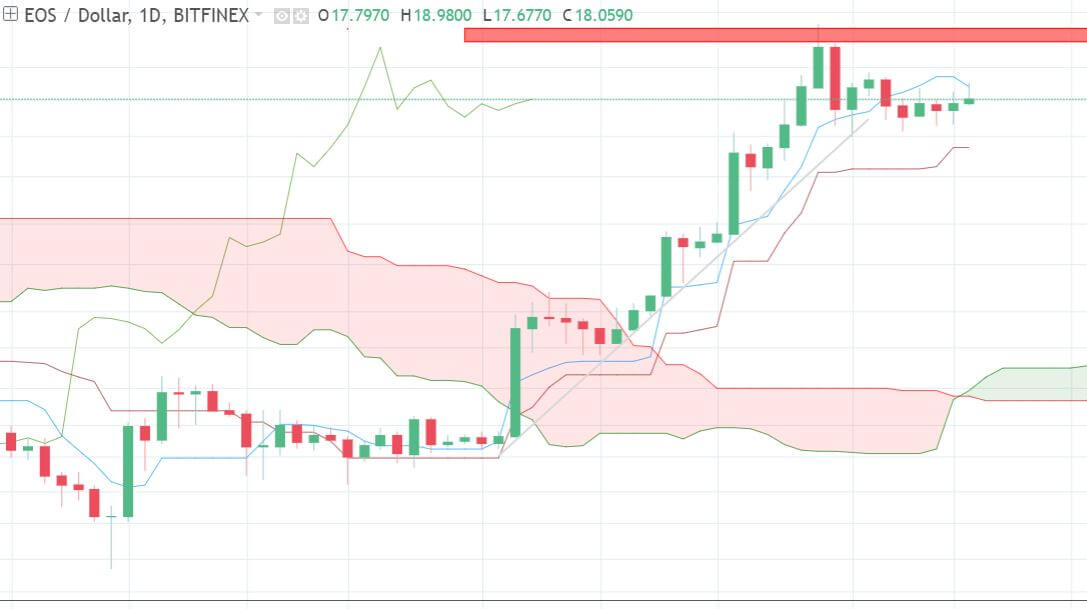
If EOS can break the resistance level, it is likely to continue increasing, as broken resistance levels often become levels of support.
Taking a look at the cloud, we see the Lagging Span above price, and a bullish Senkou Span cross (aka Kumo twist). Although, the Tenkan-Sen is beginning to slope downward, while the Kijun-Sen remains level – if they cross, it will be a weak bearish signal.
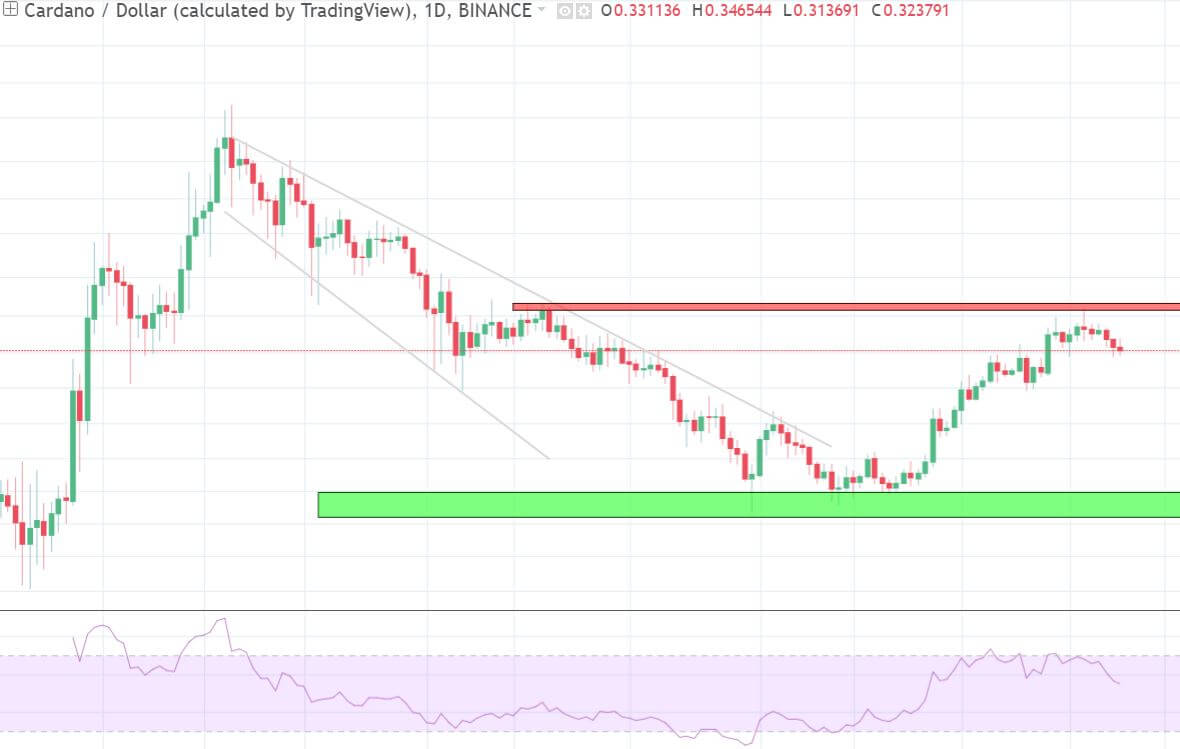
Cardano (ADA)
After finding support around $0.14, Cardano began to regain some ground but found resistance once again at $0.41. Over the past few days, ADA markets have been bearish.
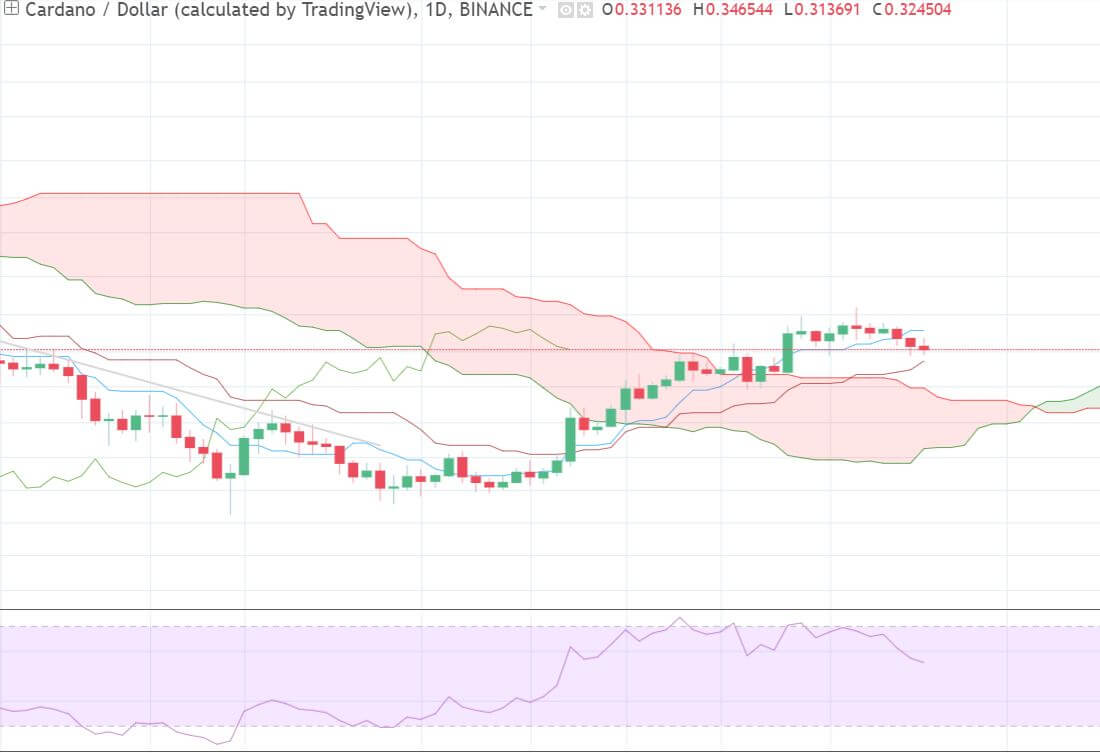
The Tenkan-Sen is above the Kijun-Sen, the price is above the cloud, and there is a bullish Kumo twist. If the Lagging Span can make its way above price, the combination of signals will be in favor of bullish price action.
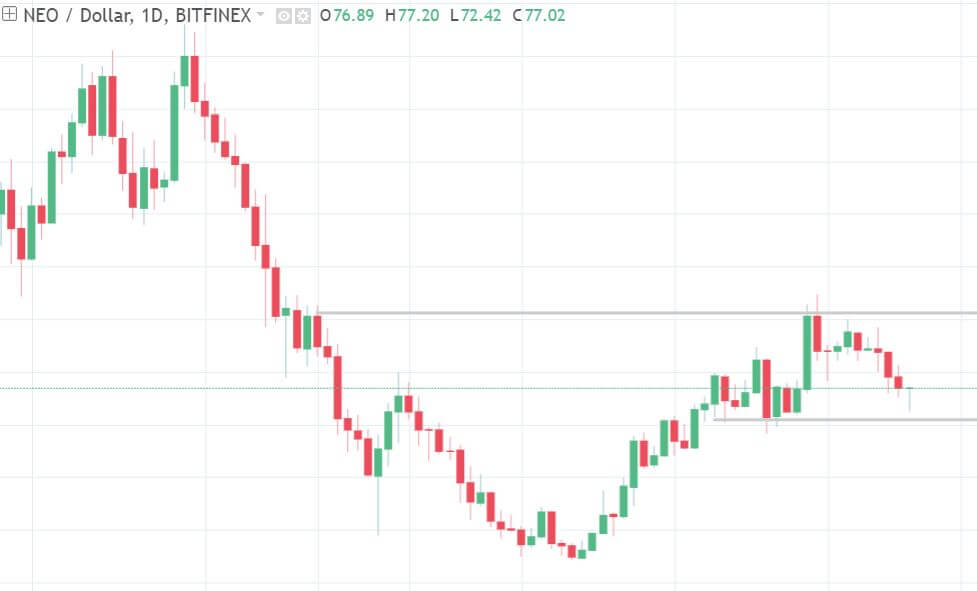
NEO (NEO)
NEO seems to be moving sideways, consolidating above the $71.00 mark and finding resistance at $91.50.
The 1D cloud is not much help either:
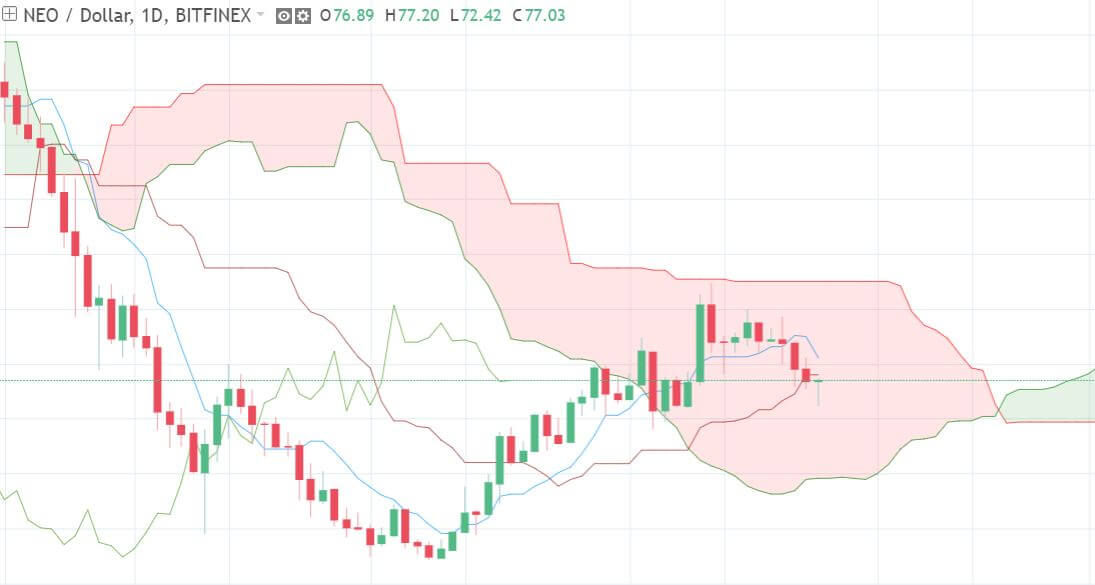
Most professional traders do not go long nor short until price closes above or below the cloud. Besides a weak bullish TK crossover below the cloud, it is difficult to say where price is headed.
Let's take a look at the 4HR chart to get a better idea:
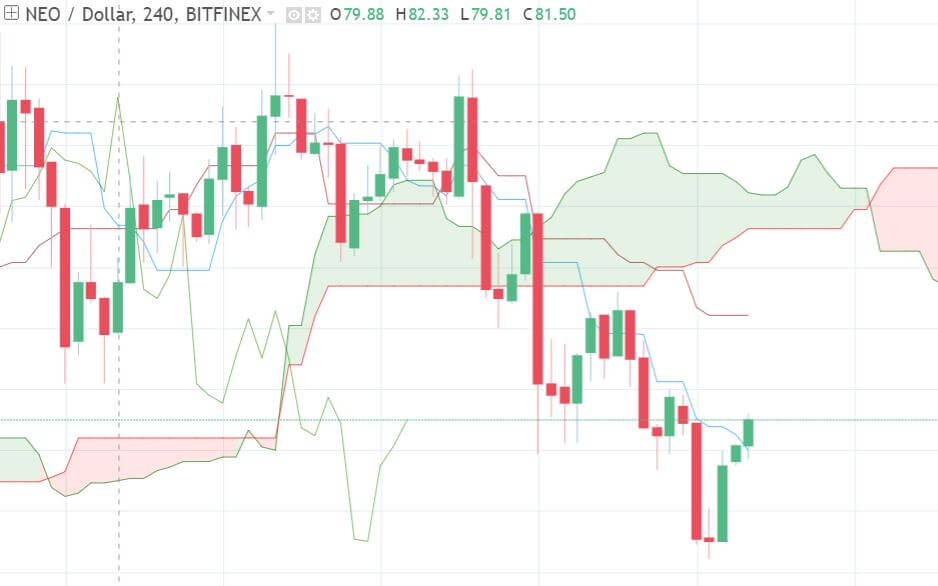
The shorter time frame helps to paint a clearer picture of future price movement. Price is below the cloud, the Tenkan-Sen is below the Kijun-Sen, and the Lagging Span is below price – all bearish trading signals.
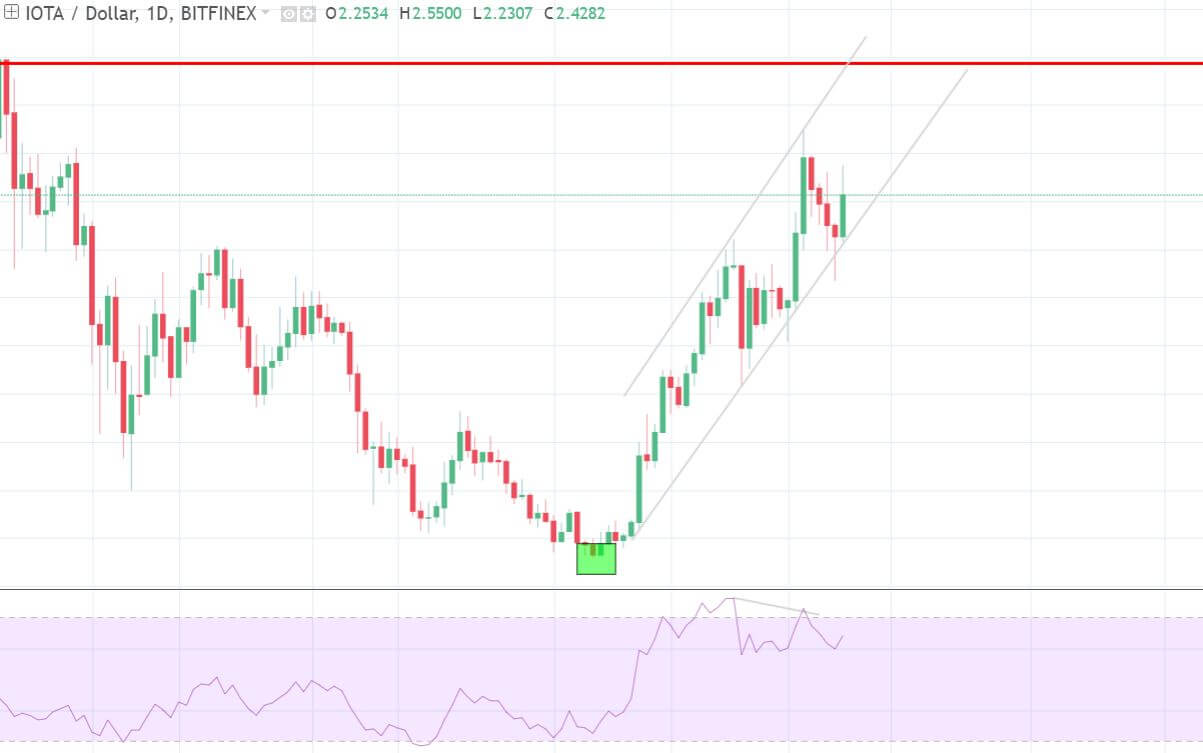
IOTA (IOTA)
After finding support at $0.93, IOTA has been in a strong upward trend.
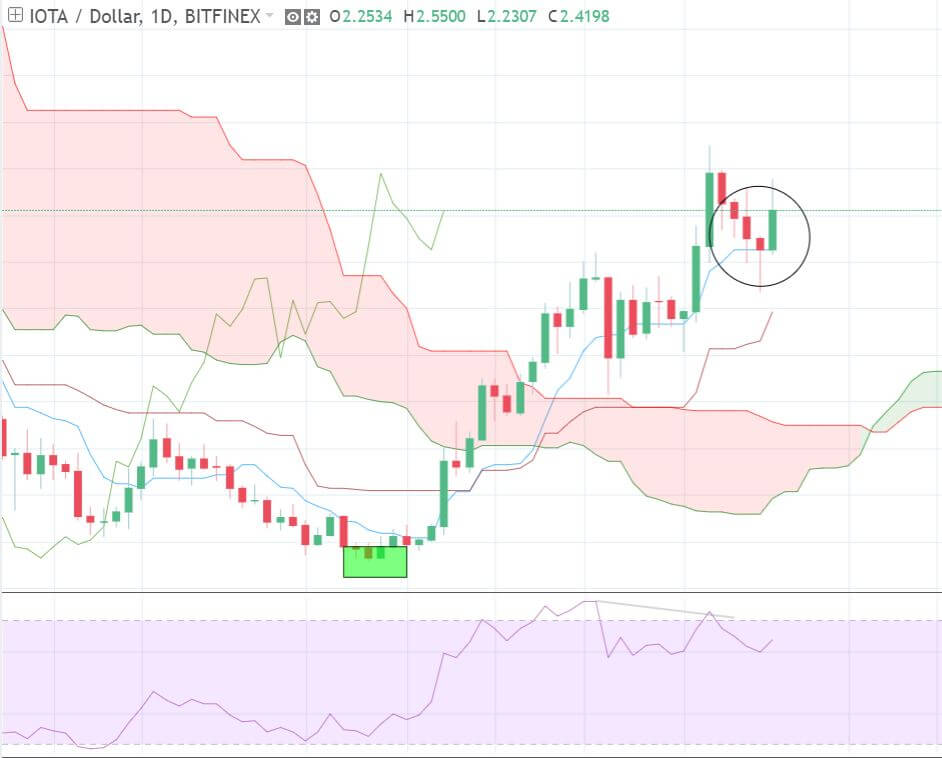
We can see IOTA found resistance at the Tenkan-Sen, and the Kijun-Sen shows strong bullish momentum. With a bullish Kumo twist ahead and the Lagging Span above price, the cloud is giving many signs of entry.
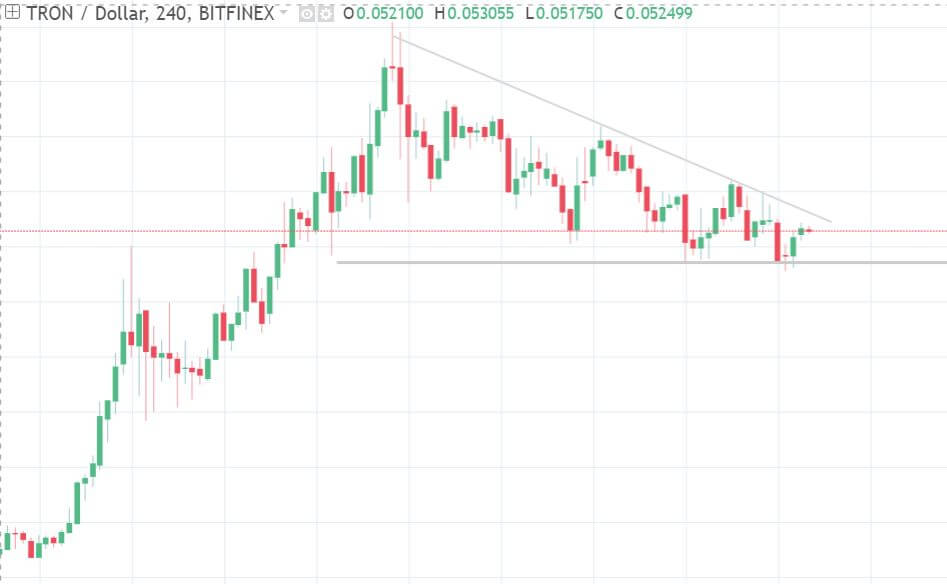
TRON (TRX)
TRON has seen significant gains over the past few months, rising from $0.03 at this time last month to a recent high of around $0.09 – however, its price movement may be headed in the other direction.
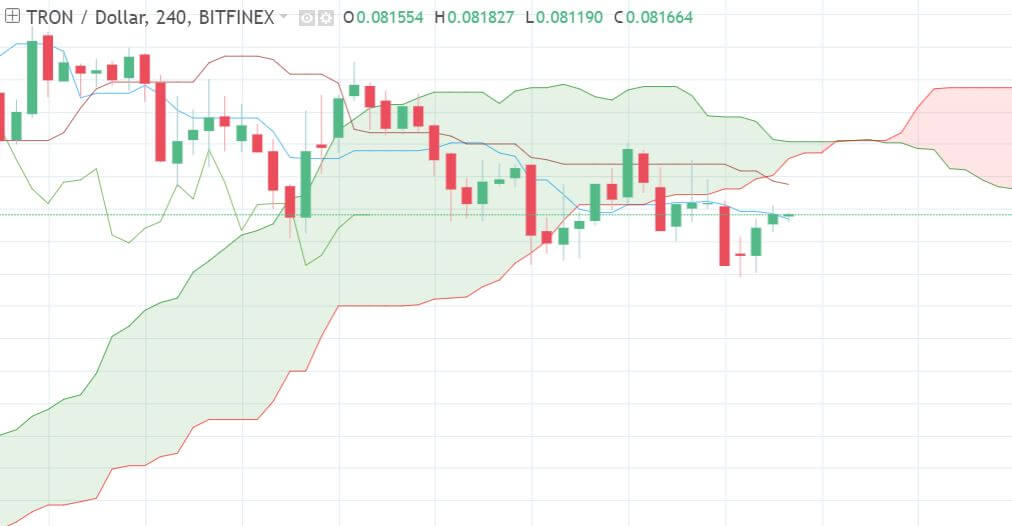
The cloud also reveals short signals:
- Bearish Kumo Twist
- Price is below the cloud
- Tenkan-Sen crossed below the Kijun-Sen
If the Lagging Span makes its way below the cloud, it would strongly suggest further bullish action. It may be a good idea to consider a short position.
Conclusions
A few weeks ago, the buyers rallied and comprised 92% of the market. Despite the recent uptrend, the market seems to be pulling back to equilibrium.
Although technical analysis is a useful tool for price prediction, it is not definitive. A combination of both fundamental and technical analysis should be used to ensure more successful trading.
Glossary
Here are the definitions for each of the technical analysis terms used in this article.
- Senkou Span A – an indicator that is used to measure momentum, as well as future areas of support and resistance. Senkou Span A is always drawn in relation to Senkou Span B – together, they form the cloud.
- Senkou Span B – forms the cloud along with Senkou Span A. Traditionally when Senkou Span B is located below Senkou Span A, it is a symbol of bullish price movement.
- Senkou Span cross – The cloud is an area of uncertainty. Most traders do not make a move until price closes above or below the cloud – although, when the Senkou Spans cross one another, many traders use the indicator to predict the reversal of a current price trend.
- Kumo Twist – The Ichimoku Cloud is a Japanese trading strategy, and ‘Kumo' means cloud in Japanese. The Kumo Twist is just a nickname for a Senkou Span cross.
- Tenkan-Sen – The Tenkan-Sen is used in conjunction with the Kijun-Sen to predict long and short positions. The formula for the Tenkan-Sen's calculation takes the highest high and the lowest low and divides it by two over the last seven to eight time periods.
- Kijun-Sen – Similarly to the Tenkan-Sen, the Kijun-Sen is calculated using the same formula, but it usually includes the last 22 time periods. The Tenkan-Sen highlights short-term price movement, while the Kijun-Sen gives a better idea of long-term price movement.
- TK crossover – When the Tenkan-Sen crosses above the Kijun-Sen, it is an indication of bullish price movement. Conversely, the Tenkan-Sen crossing below the Kijun-Sen is a bearish sign. Both of these signals are known as a TK crossover. The location of the TK crossover impacts the strength of the signal. For example, a bullish TK crossover below the cloud is in bearish territory, and therefore a weak signal. On the other hand, a bullish TK crossover above the cloud is a strong signal.
- Chikou Span – Otherwise known as the Lagging Span, Chikou Span shows where the price was 26 periods before the most recent closing price. An upwards Lagging Span above price shows bullish momentum, while a Lagging Span below price shows bearish momentum.