Explore CryptoSlate’s Institutional Playbook, a 3-part guide series on exchange due diligence, crypto-as-a-service, and token listing strategy for institutional teams.
Explore CryptoSlate’s Institutional Playbook, a 3-part guide series on exchange due diligence, crypto-as-a-service, and token listing strategy for institutional teams.
The Bitcoin market is a complex and multifaceted ecosystem influenced by a variety of different factors. Among these, regional price and supply trends stand out as critical components for understanding market behavior. Regional price metrics, derived from trading activity during specific working hours in the US, Europe, and Asia, show how different geographical areas contribute to Bitcoin’s overall price movements. Similarly, regional supply metrics, which track the distribution and movement of Bitcoin across various regions, highlight the underlying supply-demand mechanics that drive the market.
These metrics are often understated and underused in market analysis. Firstly, Bitcoin’s price is not influenced uniformly across the world. Each region has its own set of economic conditions, regulatory environments, and market participants, all of which can cause significant regional variations in price. By analyzing regional price metrics, we can identify which regions drive price changes and how global events might influence regional markets differently.
Secondly, the regional distribution of Bitcoin’s supply plays a vital role in the global market. Supply metrics show how much BTC is held or moved within specific regions, showing where liquidity is and how investors behave. Moreover, these metrics are invaluable for anticipating market trends. By examining regional price and supply changes, we can better understand the relationship between global events and local market responses.
In this report, CryptoSlate analyzes Glassnode’s regional supply and price metrics to see how they changed in the first half of the year. We will explore how these metrics are constructed, what they show about regional market trends, and why they’re important for both short-term trading and long-term investment strategies.
Regional MoM price change
Glassnode’s regional month-over-month Bitcoin price change metric is a sophisticated analytical tool designed to capture the nuances of Bitcoin’s price movements across regions. It’s constructed through a two-step process, with the first being the assignment of price movements to regions. Price movements are categorized based on the standard trading hours of three primary regions: the United States, Europe, and Asia. Each price change that occurs during the specific trading hours of these regions is attributed to that region — for example, price changes between 9 A.M. and 5 P.M. EST are assigned to the US.
After assigning price movements to their respective regions, the cumulative sum of these changes is calculated over time. This step aggregates the day-to-day price changes into a month-over-month (MoM) metric, which provides a clear view of how Bitcoin’s price has shifted in each region over the past month.
The regional MoM price change provides critical information about the market. The metric identifies which regions influence Bitcoin’s price most by tracking price changes during specific regional working hours. It can highlight whether the US, Europe, or Asia drive market trends during any given month. Positive or negative month-over-month changes indicate the prevailing market sentiment in each region. A series of positive changes suggests bullish sentiment, while a series of negative changes points to bearish sentiment.
It can also uncover regional disparities, showing how events or conditions in one region may impact Bitcoin differently. For example, regulatory news in the US might drive significant price changes while having less impact in Europe or Asia.
The metric’s ability to highlight regional drivers of price change can help predict broader market movements. For instance, if Europe shows a strong positive trend while the US and Asia are neutral, one might anticipate a potential price surge during European trading hours.
Looking at the regional MoM price change in the first half of the year, we can identify specific trends across regions.
EU
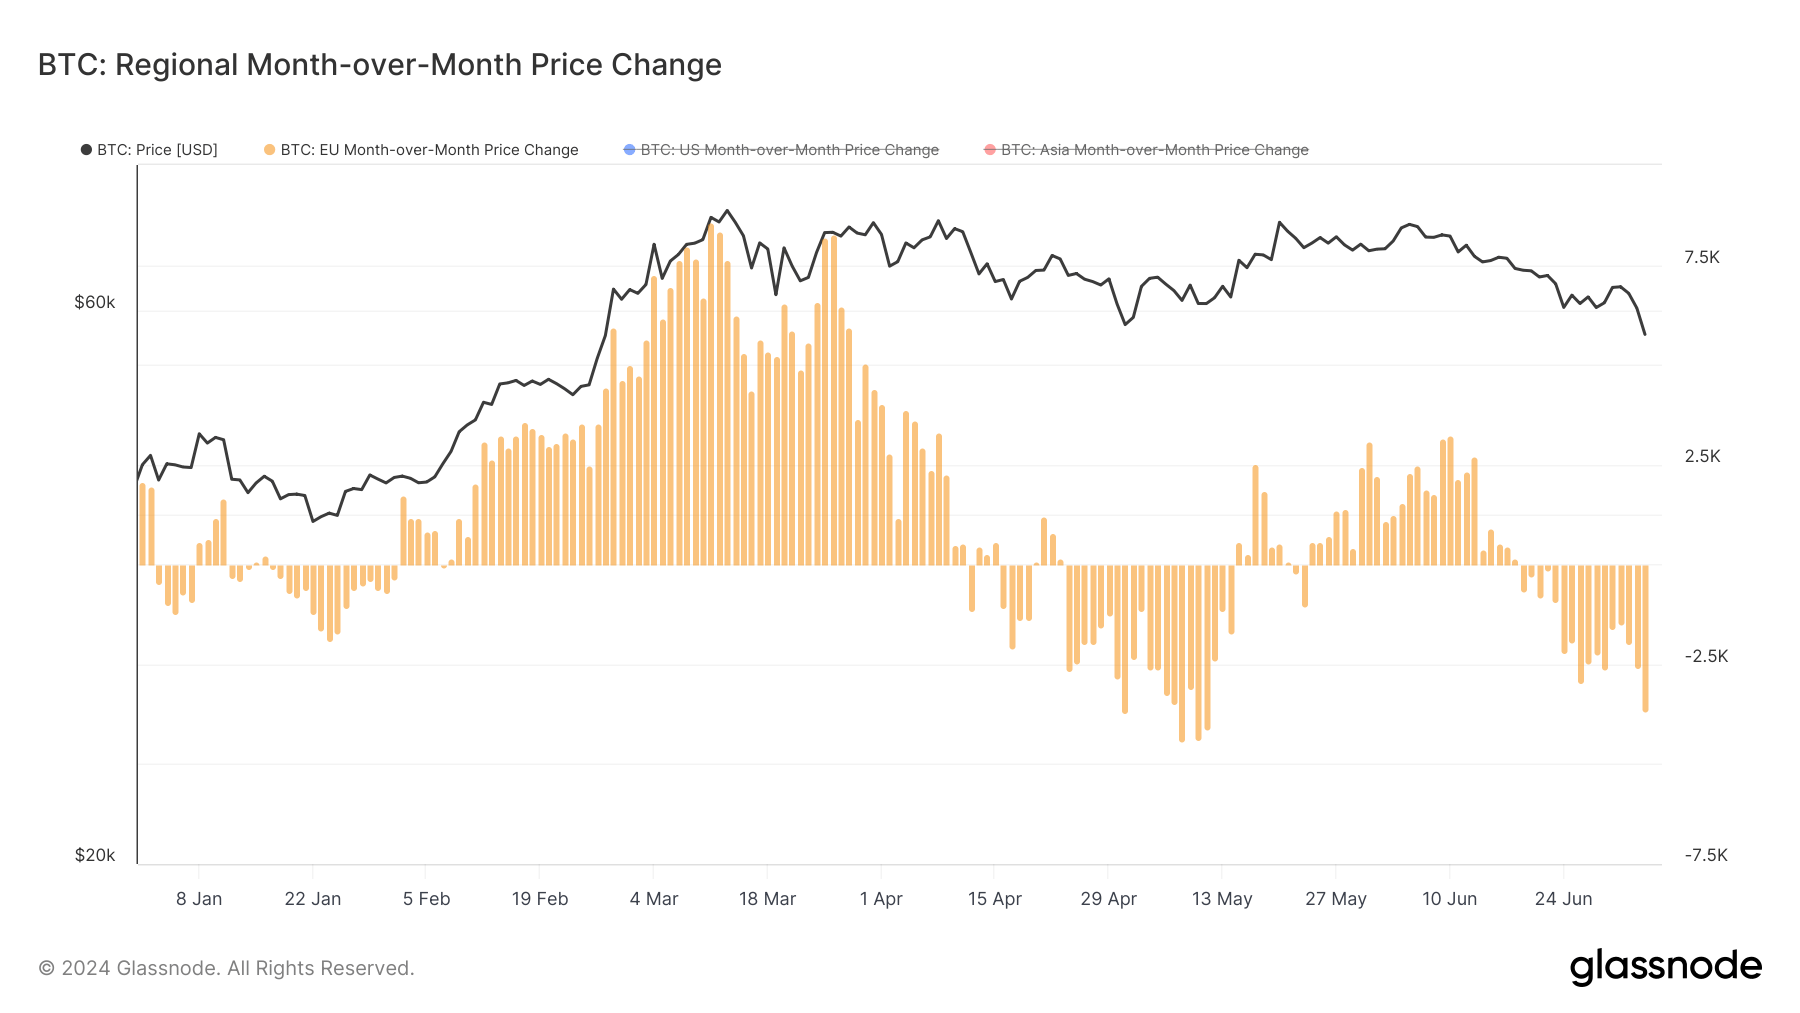
In the European market, there has been a substantial increase in Bitcoin’s price over four of the first six months of the year. A notable spike can be seen between February and April, peaking on Mar. 11 with a MoM price change of over $8,500. This upward trend was broken at the beginning of April when Bitcoin’s price began to lose footing at above $71,000. A negative price change was seen until mid-May when a positive momentum in price led to an MoM price increase that lasted until the second half of June. The past several weeks have seen a negative MoM price change in the European region, which correlates with a significant drop in Bitcoin’s price and trading volumes.
Graph showing the regional month-over-month price change for Bitcoin in Europe from Jan. 1 to Jul. 4, 2024 (Source: Glassnode)
US
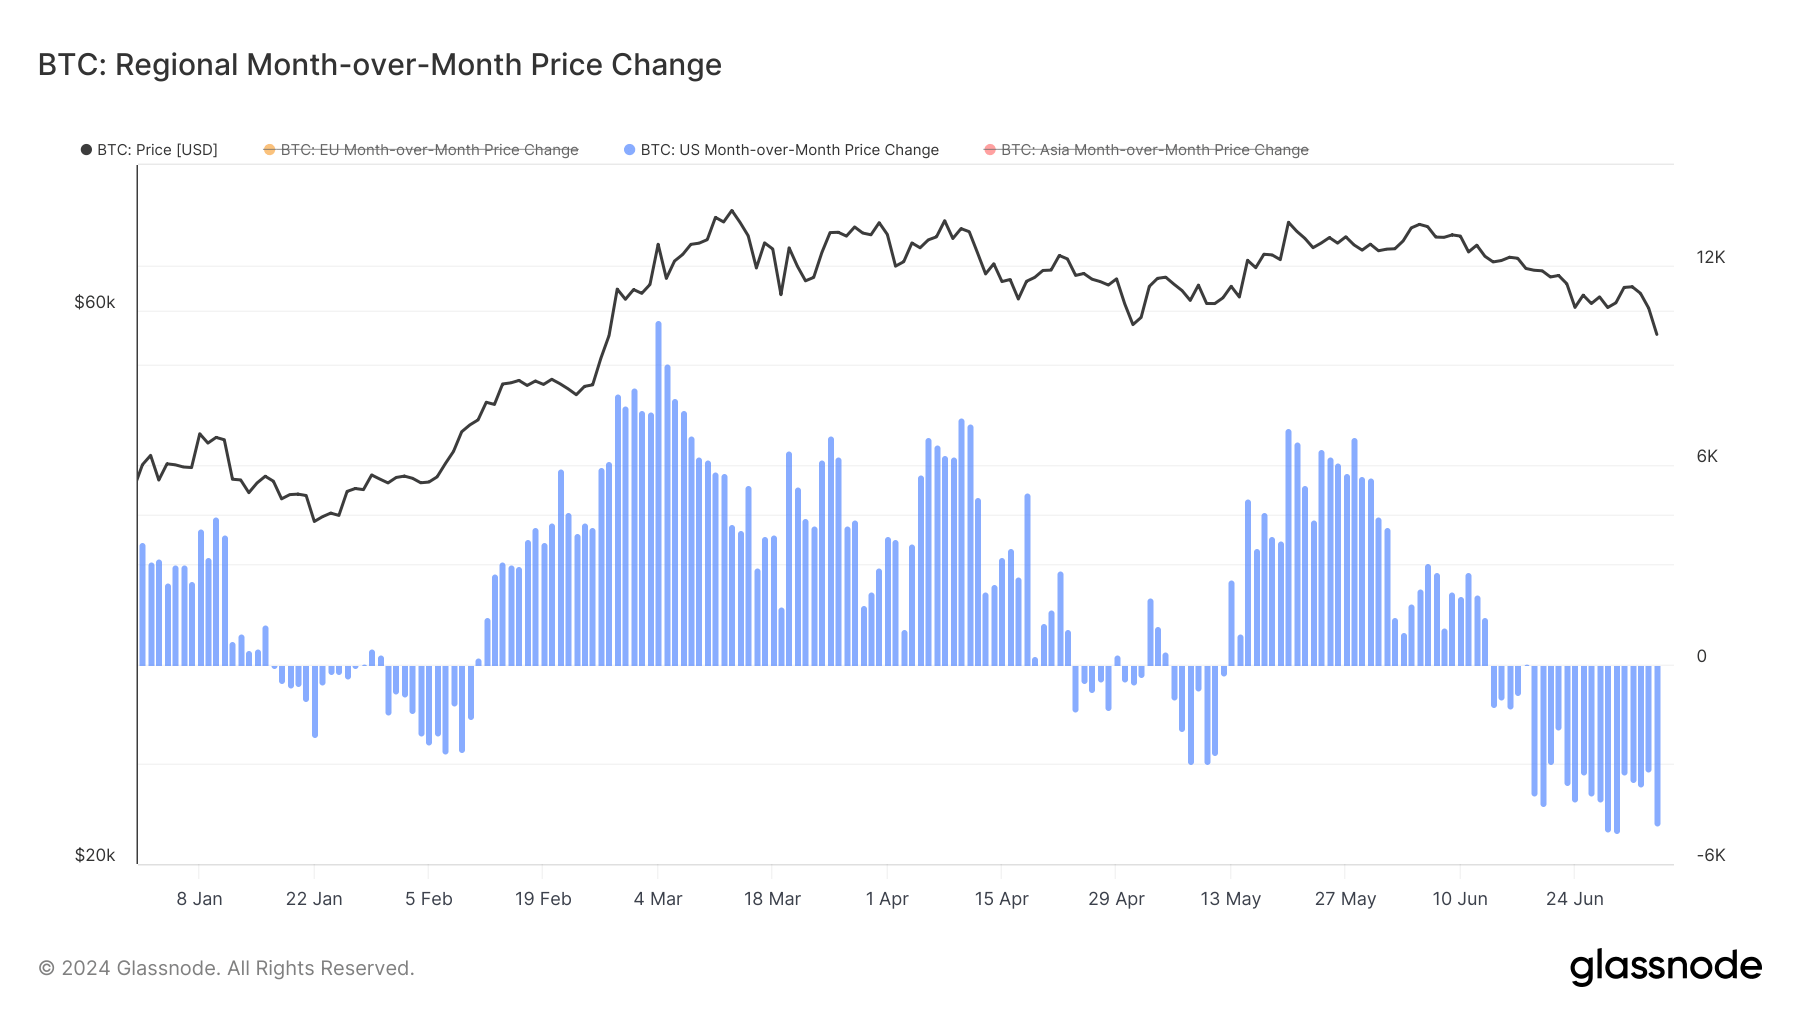
The US market shows a similar pattern to the EU. However, given its size and influence, it showed significantly higher month-over-month price changes since the beginning of the year.
The first half of January showed strong positive changes, much higher than those in Europe. This is most likely due to the anticipation of spot Bitcoin ETFs, which launched on Jan. 10 and began trading on Jan. 16. As spot Bitcoin ETFs began trading, the US market saw a MoM decrease in price that lasted until mid-February. This trend quickly turned positive and remained that way until late April — much later than the positive MoM price changes we’ve seen in Europe. Most of May and June were also spent in a positive trend, with MoM price changes turning negative in the second half of June and continuing into July.
Graph showing the regional month-over-month price change for Bitcoin in the US from Jan. 1 to Jul. 4, 2024 (Source: Glassnode)
Asia
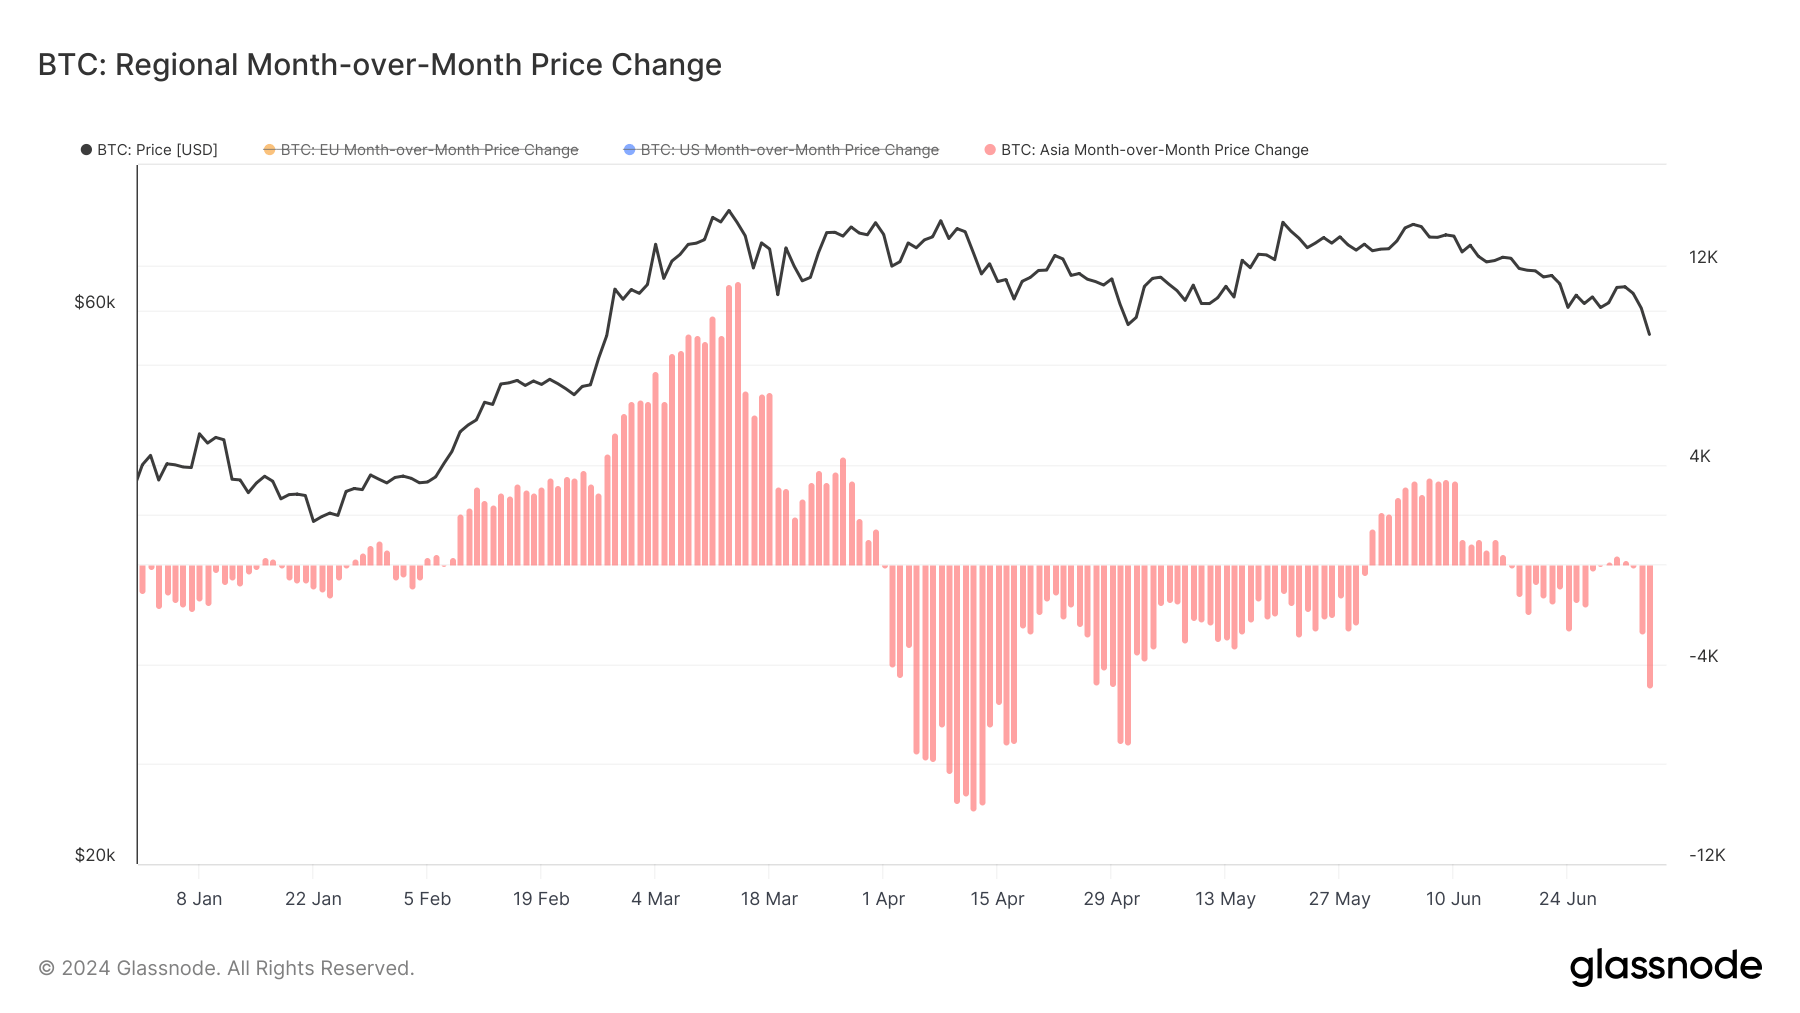
The Asian market’s month-over-month changes have been more erratic than those of the EU and the US. The year began with a slight but stable negative price change that lasted until the beginning of February, when the Asian market began seeing a positive MoM increase in price. It also saw the highest MoM price change out of all three markets, peaking at $11,395 on Mar. 14.
However, the intensity of the price change seemed to have exhausted the Asian market much earlier, as it entered a negative trend at the beginning of April. On Apr. 12, the Asian market showed the largest negative MoM price change out of all markets, recording a decrease of $9.824. The negative trend was briefly broken in the first half of June, when the market saw a positive MoM price change.
Graph showing the regional month-over-month price change for Bitcoin in Asia from Jan. 1 to Jul. 4, 2024 (Source: Glassnode)
Comparing the regional price changes to the overall trend in Bitcoin’s price, we see that the EU and the US show a higher degree of correlation with the overall price trend. When Bitcoin’s average price increases, both regions tend to show positive MoM changes and vice versa. The Asian market, however, appears less correlated, with significant negative changes observed during periods when the overall Bitcoin price might be stable or even rising. This suggests that certain region-specific factors influence prices in Asia.
Regional YoY supply change
The regional year-over-year supply change metric measures the annual change in the supply of Bitcoin within specific regions. The metric is constructed by aggregating data on Bitcoin holdings and transactions within the US, Europe, and Asia. For each day, the percentage change in the supply of Bitcoin is calculated by comparing the current supply to the supply on the same date the previous year. The calculated supply changes are then assigned to their respective regions based on where the Bitcoin was held and transacted.
Like the month-over-month price change, the year-over-year supply change metric is extremely valuable when analyzing the market. It enables us to identify which regions are experiencing growth in Bitcoin holdings and which are seeing a decline, pinpointing the regions that drive the market. Changes in supply can also precede major price movements — for example, a large increase in Bitcoin supply in Asia might suggest an upcoming price rally driven by regional demand.
Furthermore, comparing supply changes across regions can show disparities in market behavior and sentiment. It shows how different regions react to global events and market movements.
EU
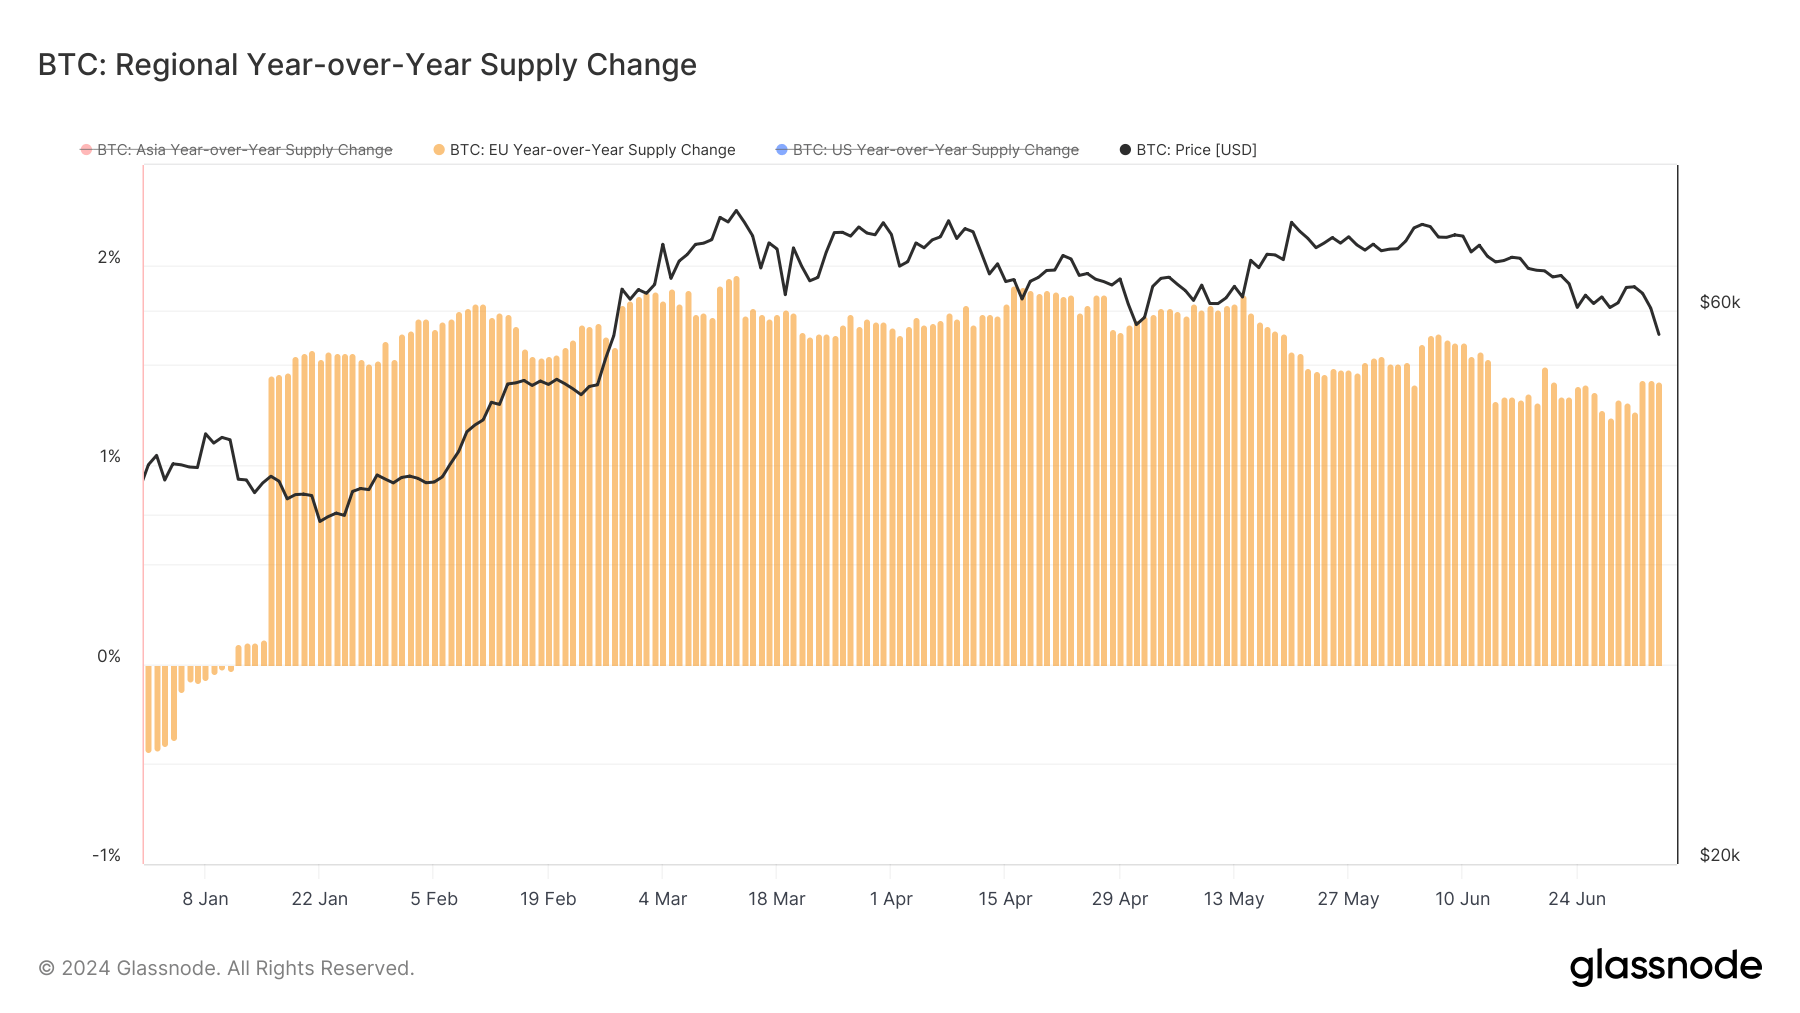
The supply of Bitcoin in the European market showed a negative YoY increase that lasted until mid-January. Since then, the region has seen a consistent YoY increase in supply that continued into July.
Although the general trend was upward, there were notable fluctuations, particularly in March and April, when Bitcoin saw its most volatile period of the year. May and June brought stability in the YoY supply change, with increases ranging from 1.3% to 1.6%.
While we’re still in the early days of the month, the beginning of July seems to have brought a slight YoY increase in supply.
Graph showing the year-over-year change in the share of Bitcoin supply held or traded in the European market from Jan. 1 to July 4, 2024 (Source: Glassnode)
US
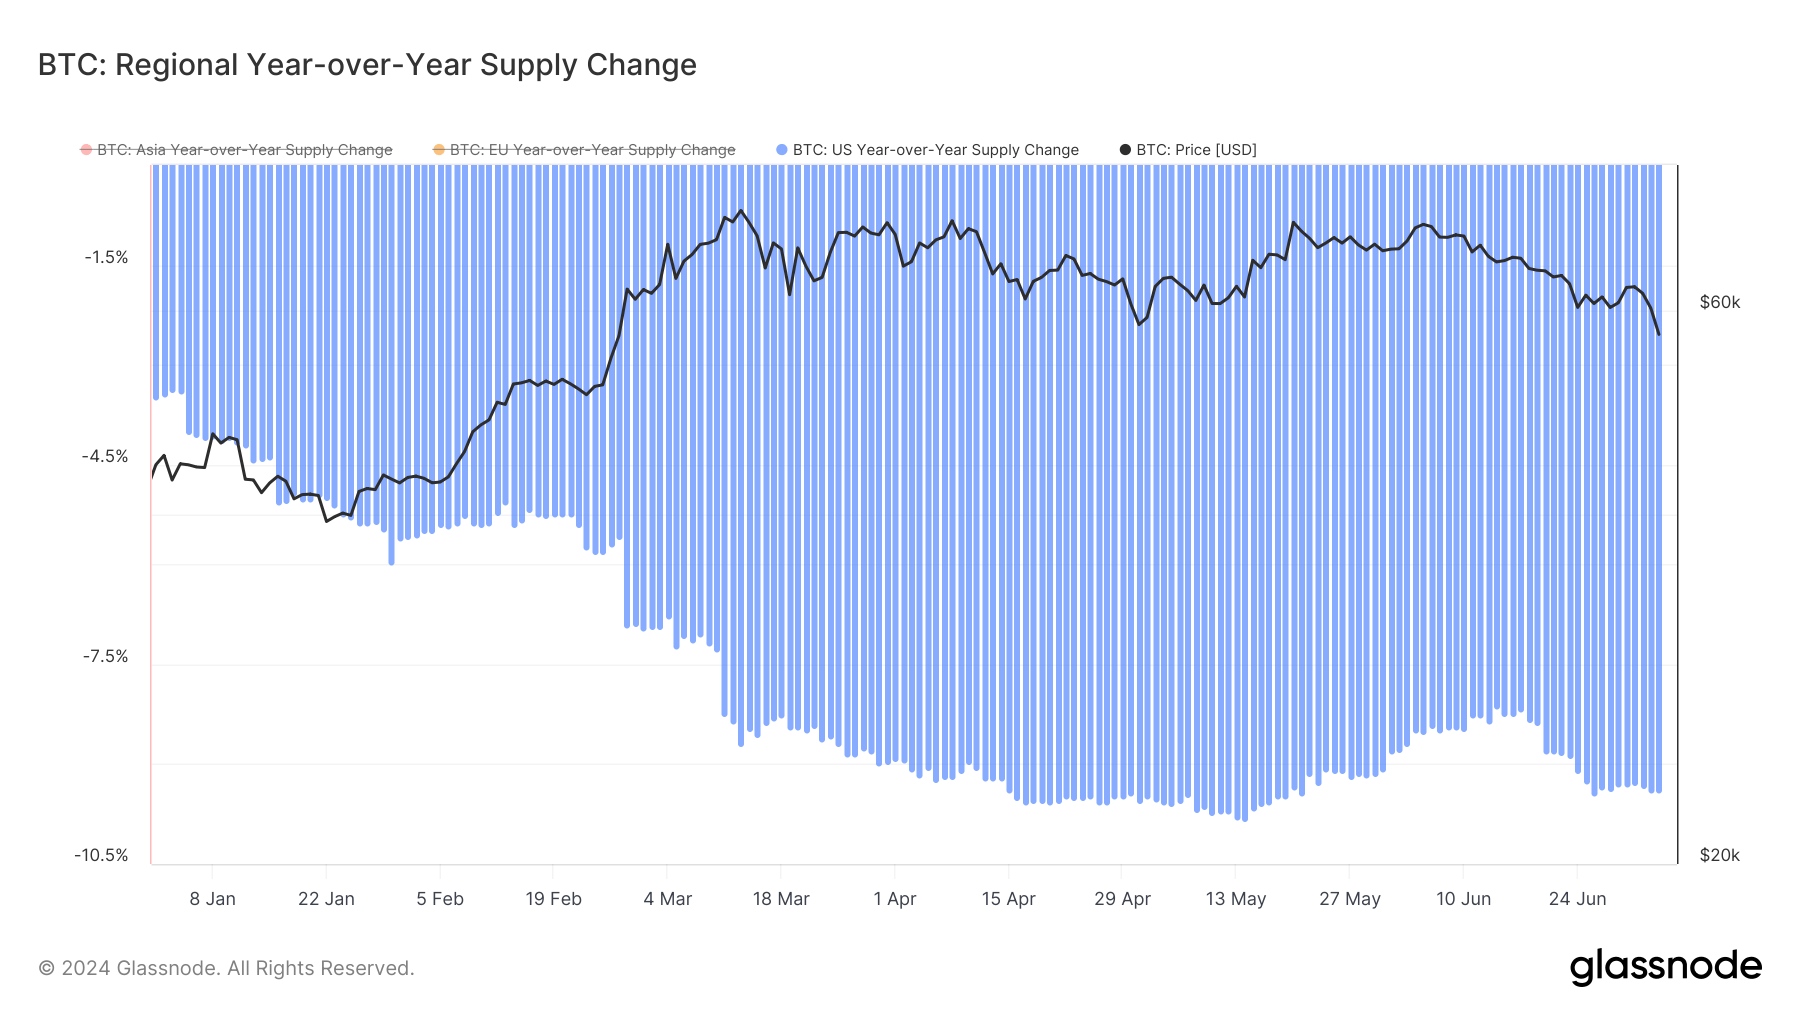
Unlike the supply of Bitcoin held and traded in Europe, the US supply has consistently decreased. This decrease has been a dominant trend since November 2023, with the supply experiencing its largest YoY decrease on May 14, a 9.85% drop.
The rate of the YoY supply decrease increased consistently in the first quarter of the year, and there was a stabilization between April and June. The rate of YoY supply decrease remained just above 9% throughout the period, after which it slowed down to around 8%. However, the supply of Bitcoin traded in the US began decreasing even more in June, continuing its fast pace of decline into July.
The rate of the YoY supply decrease grew as Bitcoin’s price increased.
Graph showing the year-over-year change in the share of Bitcoin supply held or traded in the US market from Jan. 1 to July 4, 2024 (Source: Glassnode)
Asia
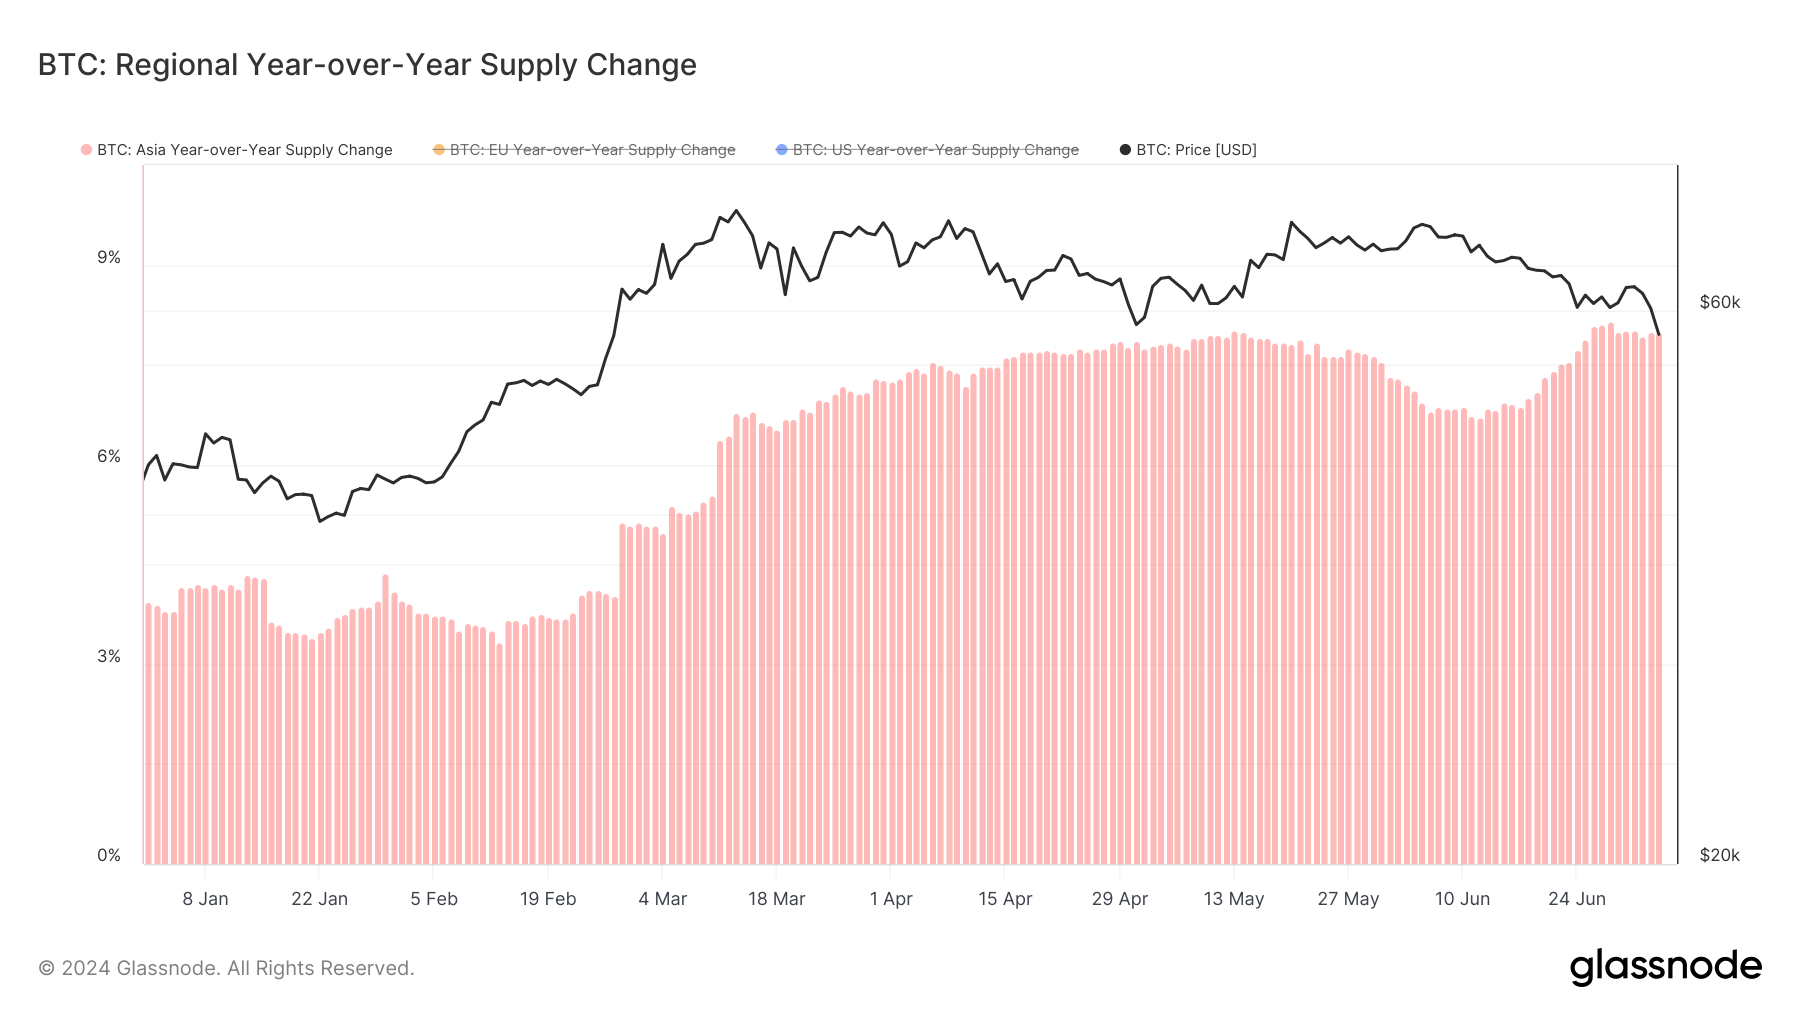
The Asian market has followed its European counterpart in regional trends throughout the year. However, as stated before, the Asian market’s size and scope have pushed its numbers way above what we’ve seen in Europe.
The YoY change in Bitcoin supply held and traded in Asia has consistently increased since September 2022. It saw its most significant increase on June 28, when the supply grew 8.16% YoY. For the majority of the year, the supply has shown a YoY increase of 5%, drastically overshadowing the increase in supply we’ve seen in Europe.
Graph showing the year-over-year change in the share of Bitcoin supply held or traded in the Asian market from Jan. 1 to July 4, 2024 (Source: Glassnode)
Conclusion
Bitcoin’s regional price and supply changes illustrate how complex and diverse the market is.
The European market experienced a notable upward trend from February to April, peaking in mid-March before facing a downturn in May. The US market mirrored Europe’s trends but exhibited stronger month-over-month changes, largely influenced by the launch of spot Bitcoin ETFs in January. Meanwhile, the Asian market showed more volatility, with sharp positive and negative shifts, indicating region-specific factors at play.
The regional year-over-year supply changes further emphasized the disparities in market behavior. Europe’s Bitcoin supply has consistently increased since mid-January, stabilizing in May and June. In contrast, the US market experienced a continuous decline in supply, which accelerated with rising Bitcoin prices, suggesting a unique supply-demand dynamic. Asia’s supply trends were aligned with Europe but on a larger scale, showing substantial YoY increases and indicating robust regional demand.
These regional metrics highlight the importance of considering geographical factors in market analysis. With its significant market size and regulatory developments, the US remains a critical driver of global trends. Europe’s stable but moderate supply increases reflect a cautious yet growing interest in Bitcoin. Asia’s erratic price movements and significant supply growth highlight its influential role in the global market.