Weekly MacroSlate: A fourth 75bps fed rate hike is now on the cards due to a strong U.S jobs report. What does this mean for Bitcoin?
A weekly recap of key Bitcoin metrics and the macro factors affecting its price performance in the market, published every weekend.
August saw the most significant monthly drop in U.S. job openings since April 2020. Biggest Crash In Job Openings On Record (Outside Of Global Covid Lockdown). U.S debt surpasses $31 trillion for the first...
Read the full TL;DRTL;DR
- August saw the most significant monthly drop in U.S. job openings since April 2020. Biggest Crash In Job Openings On Record (Outside Of Global Covid Lockdown).
- U.S debt surpasses $31 trillion for the first time.
- The U.S. economy added 263,000 new jobs in September, the unemployment rate fell back to 3.5%.
- U.S. interest rate futures price in 75% chance of a 75 bps fed rate hike in Nov.
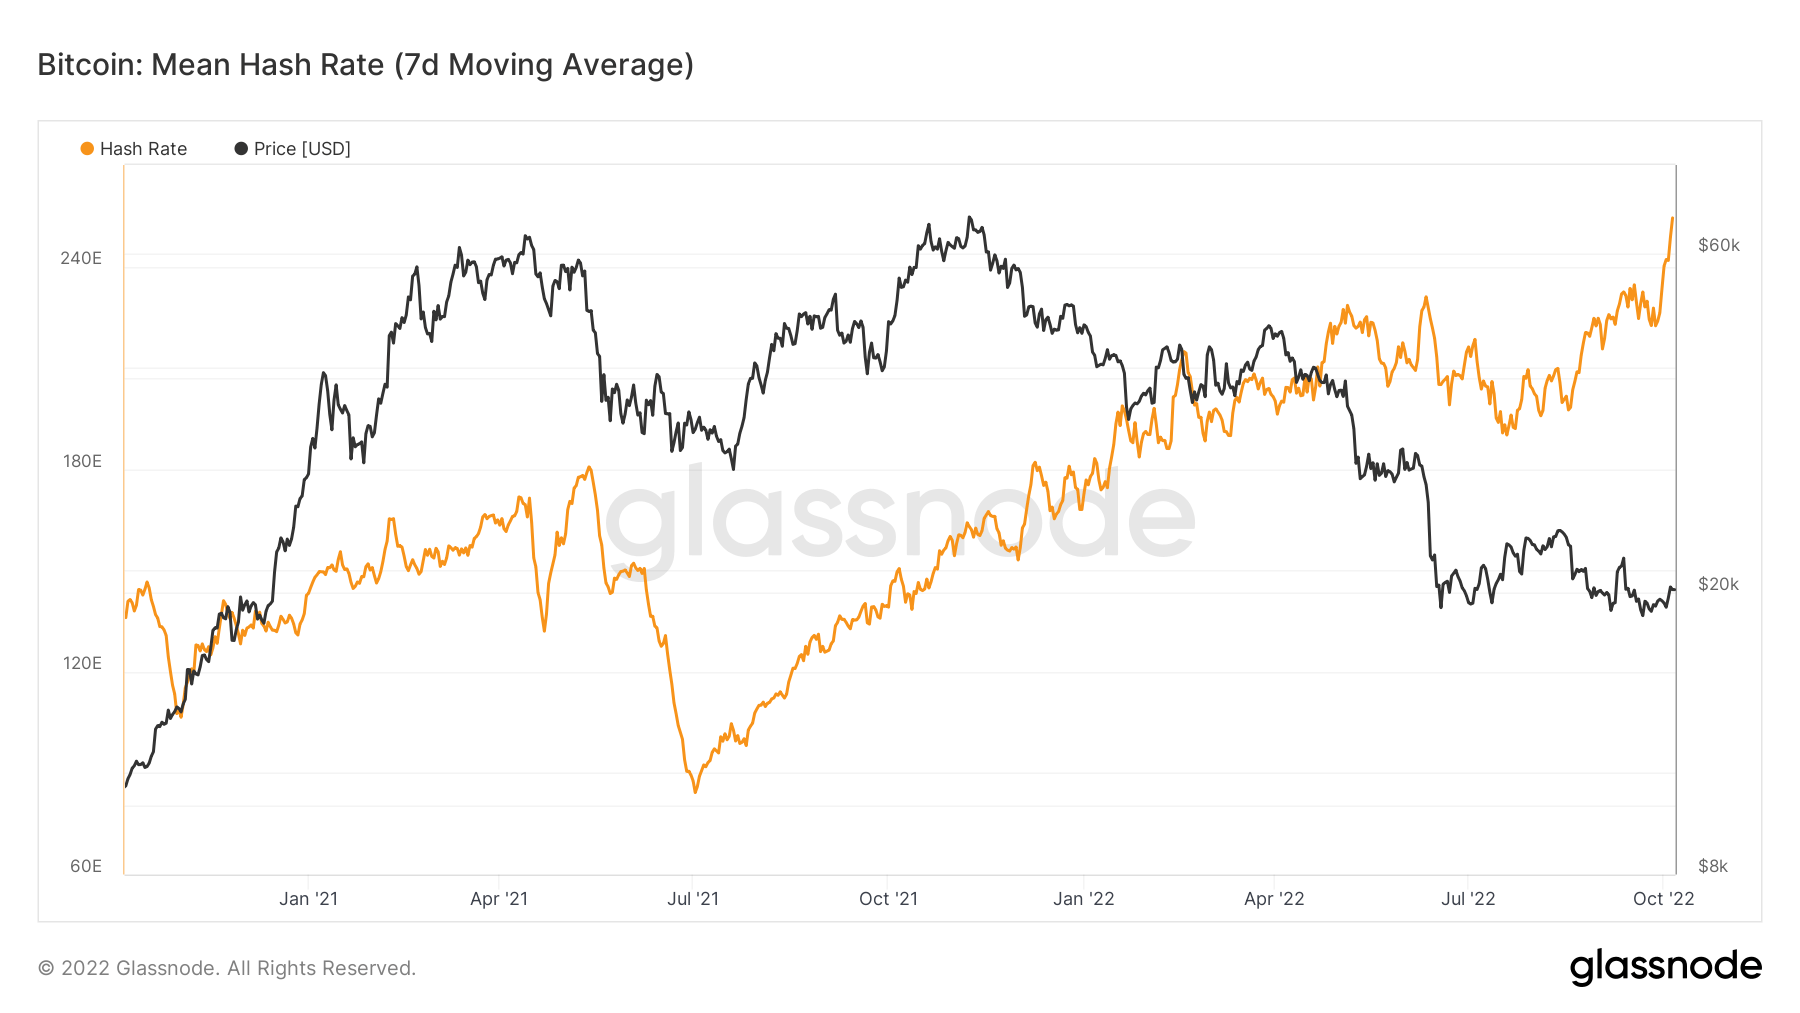
- Hash rate hits all-time high – 248.64 EH/s.
- Futures contracts hit an all-time high.
- Whales are selling BTC at the third most aggressive rate in history.
Macro Overview
Bank of Japan attempts to rescue the Yen
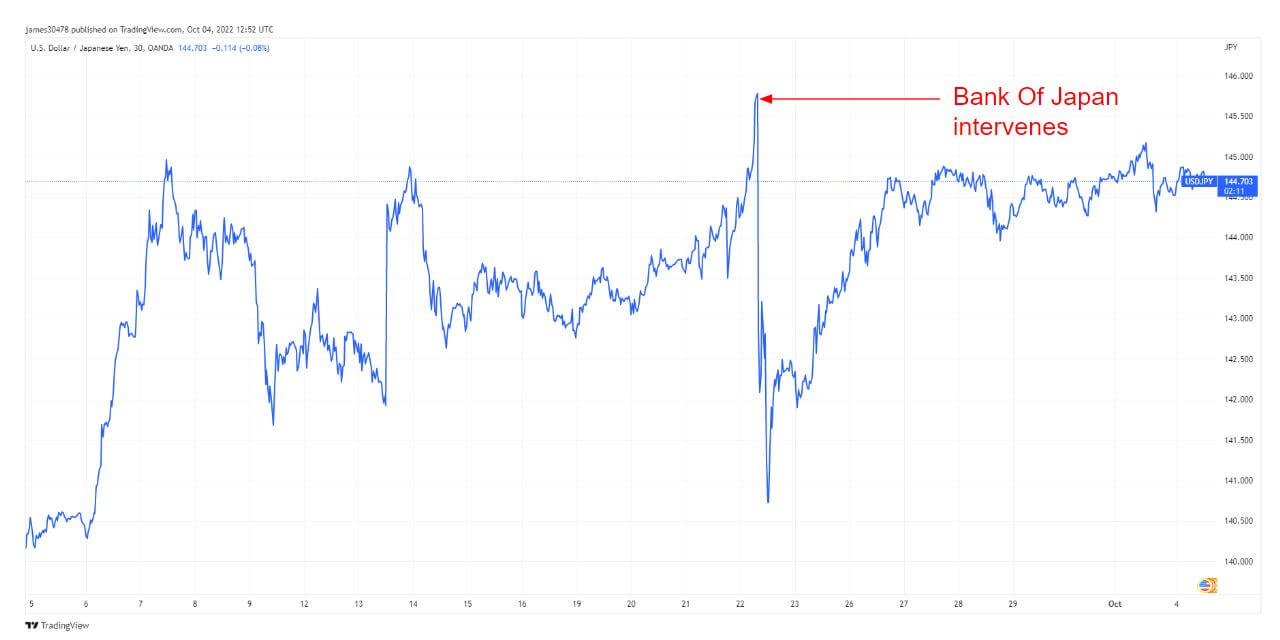
On Sept. 22, the Bank of Japan (BOJ) became the first central bank to intervene with their currency to prevent a currency collapse through FX intervention. A few days later, the Bank of England became the second bank to intervene.
Reuters reported that the BOJ spent up to $20 billion to prop up the Japanese Yen, which was the first fx intervention in almost 25 years.
The yen was crashing against the U.S. dollar and briefly hit 146 to the dollar; after the intervention, the yen went down to 140, a 4% drop. The $20 billion intervention cost almost 15% of the funds that the BOJ has available. Since Sept. 22, the yen has been creeping upwards and back at 145. What happens if the yen breaches 146? Will the BOJ intervene once again?
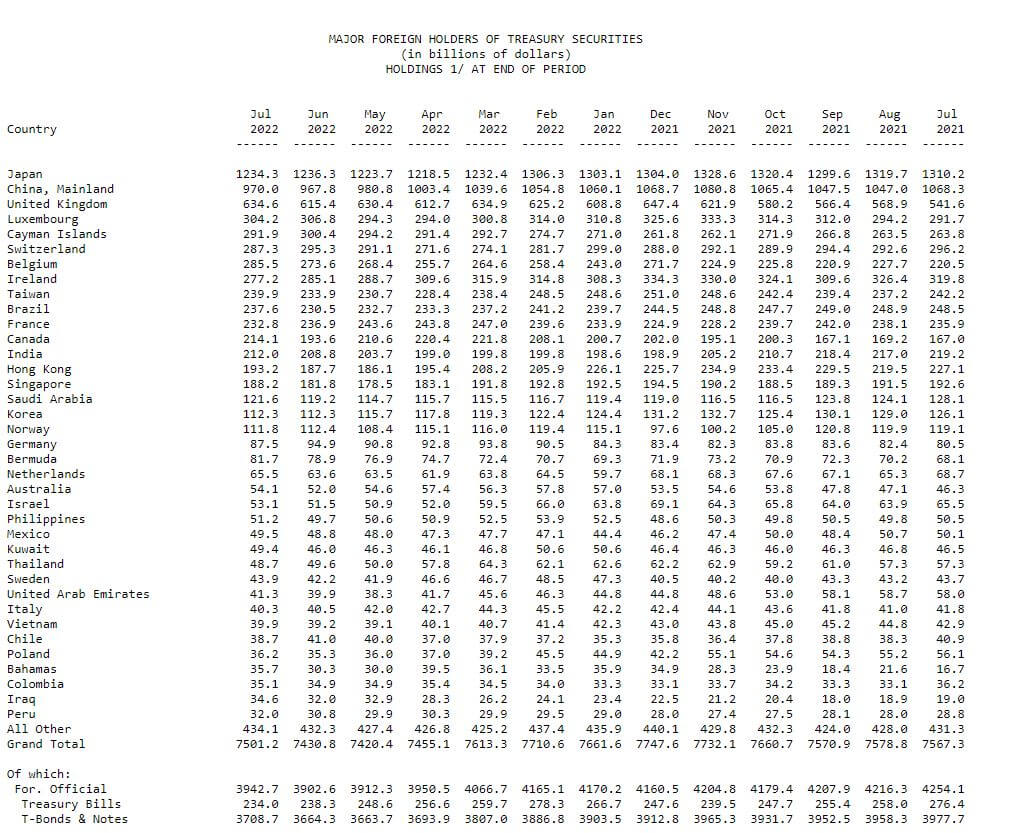
Japan holds roughly $1.2 billion in reserves and is the number one foreign holder of US debt; China is the second biggest holder, according to the chief economist at Totan Research.
“Even if it were to intervene again, Japan likely wouldn’t have to sell U.S. Treasury bills and instead tap this deposit for the time being,” – Izuru Kato.
Once the deposits have been used, BOJ will be forced to sell U.S. treasuries, directly correlating with U.S treasury yields going higher (which is bad for U.S bonds). The major foreign holders of treasury securities are Japan (17%) and China (12%), who own 29% of all foreign-held US Treasuries and are responsible for 99% of 2022’s sell pressure.
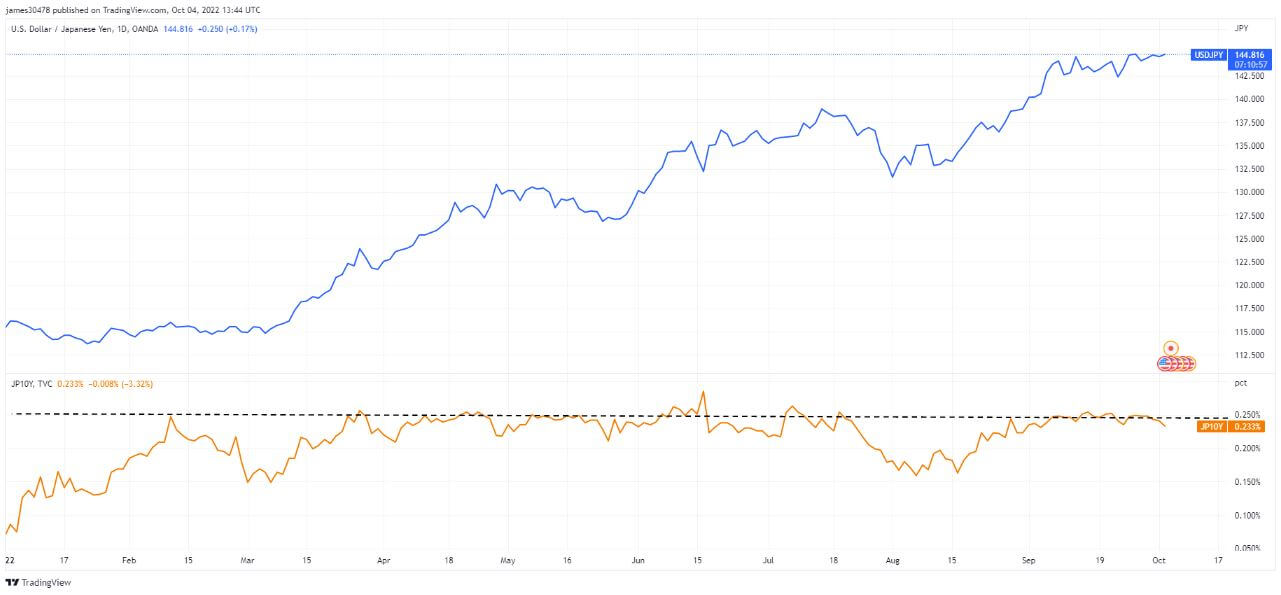
US treasury yields will soon rise sharply as foreign governments sell USTs to get more U.S. dollars to pay for higher energy costs over the coming months. In addition, to quantitative tightening from the federal reserve, which is also selling treasuries, putting further pressure on yields.
As this is going on, the BOJ maintains its firm stance on its yield curve control, keeping its 10-year interest rates at 0.25%; the Yen will act as a release valve going higher and higher against the U.S dollar.
Correlations
Bitcoin is the best horse in the race
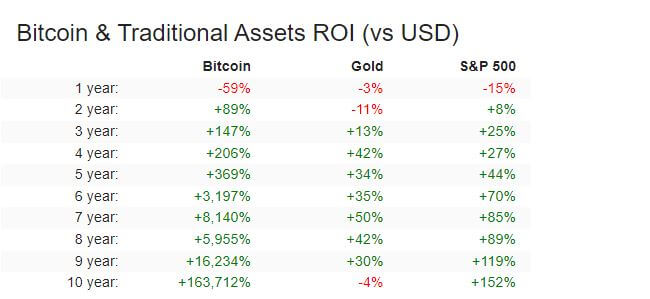
Since Bitcoin’s inception, it has faced criticism from all different angles. It’s only used by criminals, has no intrinsic value, uses too much energy, etc. However, whichever way it is looked at, Bitcoin has outperformed all traditional assets, with a 2-year time horizon or longer.
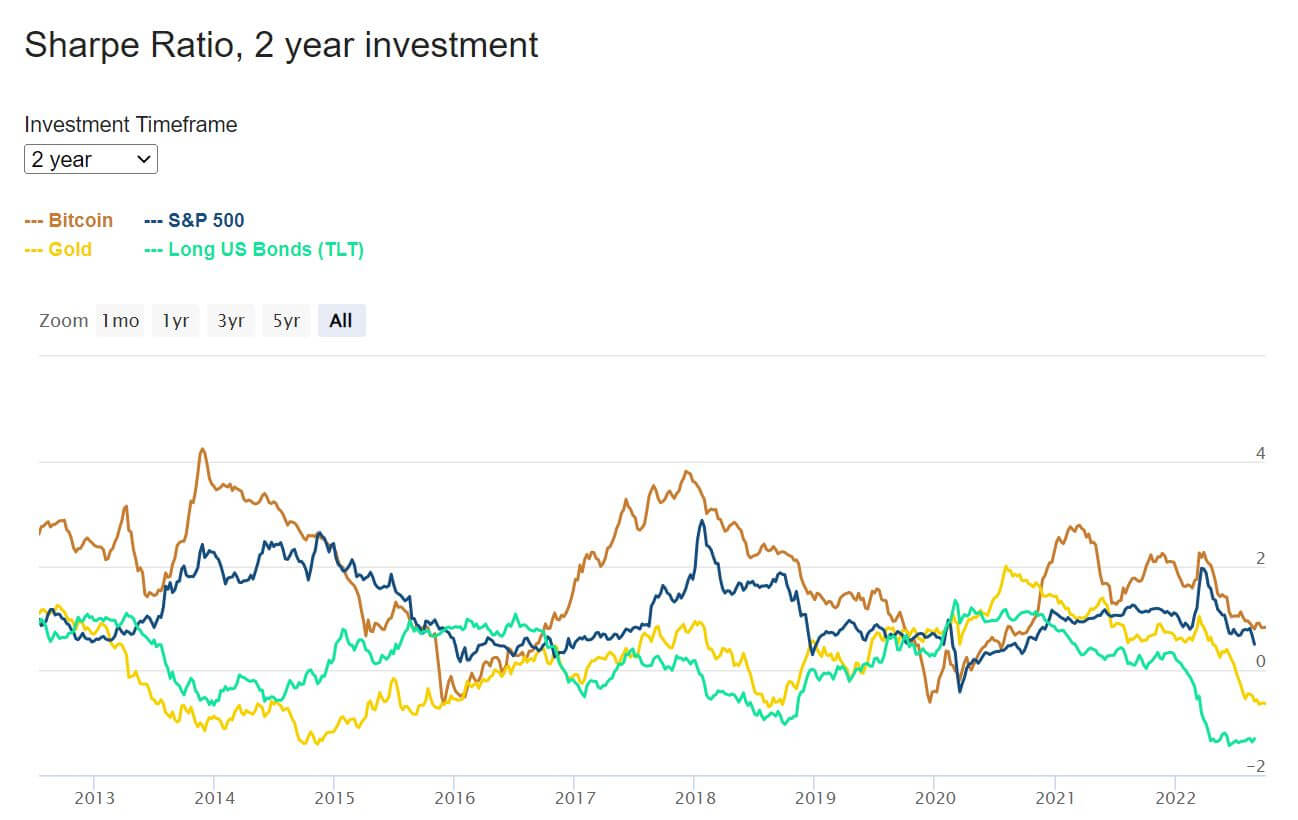
A ratio used to measure risk and volatility is the Sharpe ratio. It is a way to measure a return of an investment based on risk and volatility over a specific period. The chart below tracks the Sharpe ratio of BTC vs. traditional assets across a two-year time horizon. It has included the average of the 30-day U.S treasury bill, which is benchmarked as the risk-free rate.
Bitcoin has made significant gains over the past decade vs. USD, Gold, and S&P 500. The Sharpe ratio identifies if the returns are worth the volatility to endure as an investor. The chart below shows that holding BTC over a long period is worth the volatility and notably has a much higher Sharpe ratio than other assets.
Equities & Volatility Gauge
Bear Market Rally
Oct. 3 and 4 saw the S&P 500 rip 5.7% higher, the best two-day advancement since April 2020. However, due to a strong U.S. jobs report on Oct. 7, the S&P 500 has retraced more than .618 of that gain.
Equities have slightly bounced from their year-to-date lows, with some news that the fed may be nearing the end of its hiking schedule. Markets are forward-looking, and August saw the most significant monthly drop in U.S. job openings since April 2020, while Australia raised interest rates by a smaller-than-expected 25 bps.
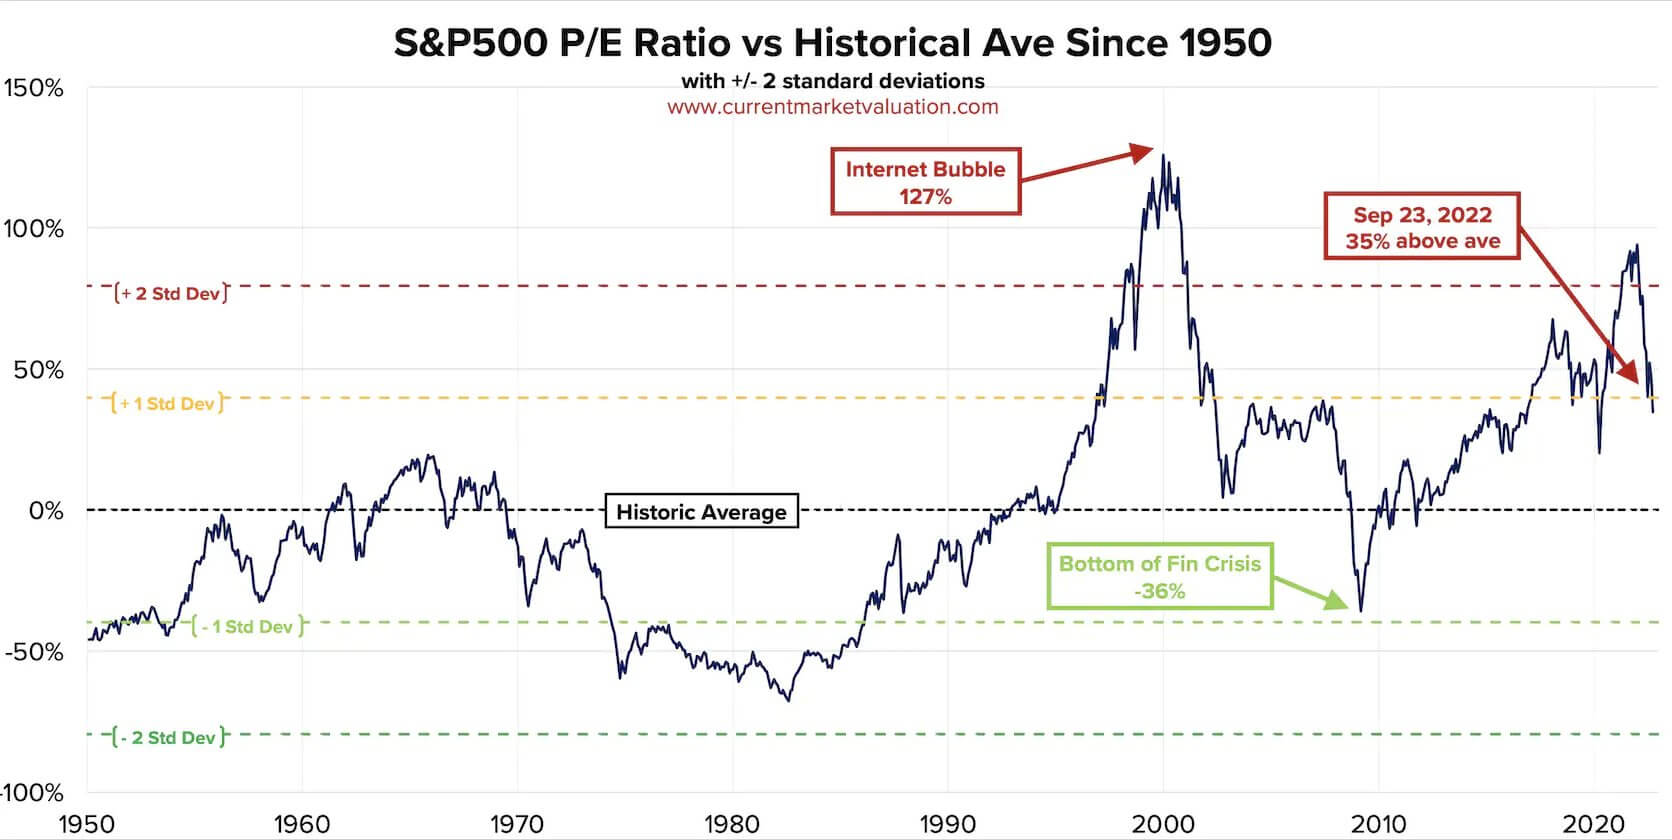
However, the equity market P/E ratio is still considerably overvalued when looking back on history. Currently, the market is still one standard deviation above the historical mean, coupled with the most robust dollar in 20 years and credit risk seeing new highs in 2022. Inflation is still running riot, so further pain is expected.
Commodities
Commodities are running hot
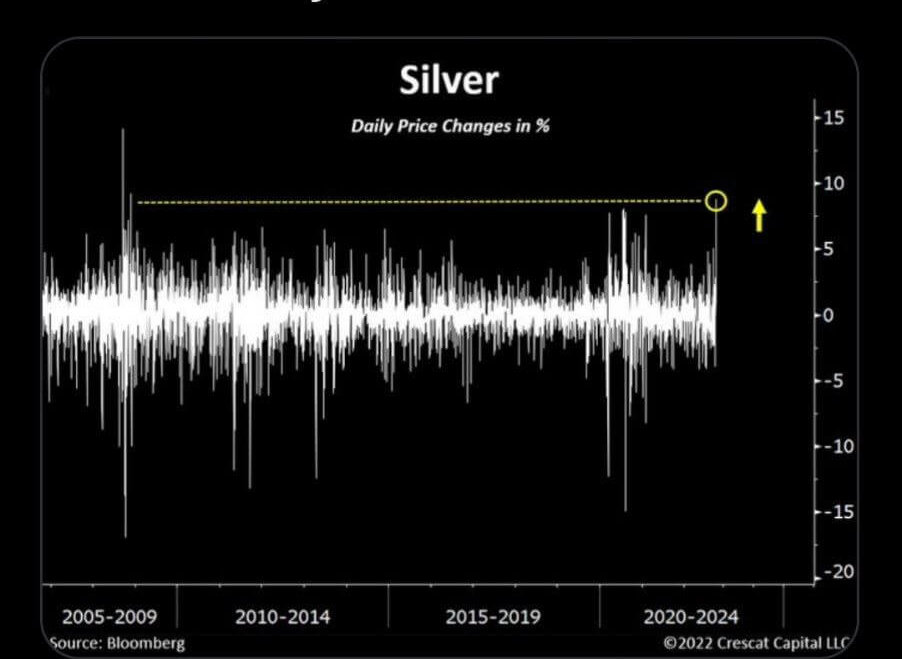
There seems to be an expectation that the fed is nearing the end of its tightening schedule in the fund’s rate, while the U.N. is calling on the fed and other central banks to halt interest rate increases. This has seen a massive rally in commodities, most notably silver. Silver was up over 7% on Oct. 3, and the last time silver was up as much as 7% was November 2008, which was the bottom in the market, and over the next two years, it rallied over 400%.
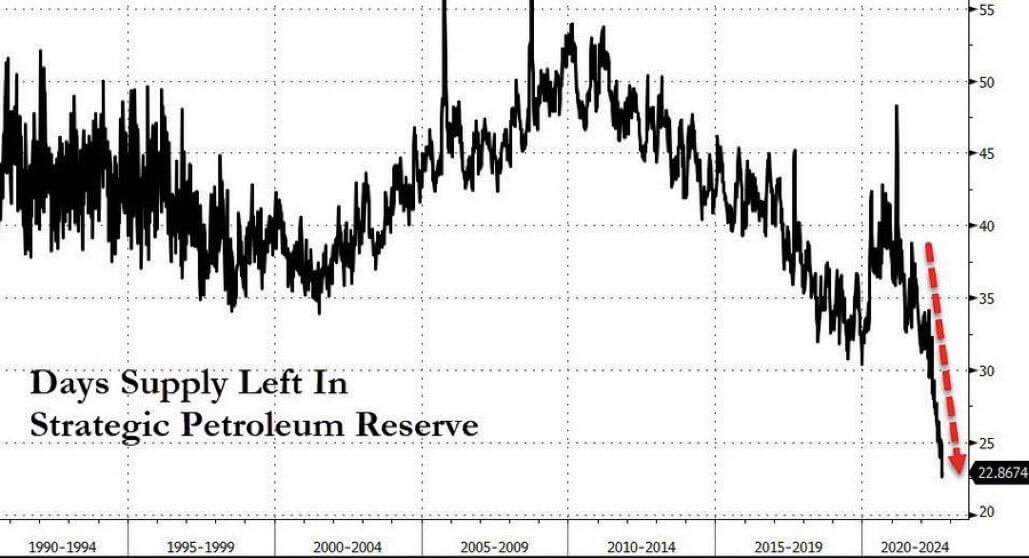
Where’s all the petroleum reserve gone?
The US Strategic Petroleum Reserve is down -35% since the start of last year, to levels not seen since 1984. The five most significant drawdowns in SPR history have occurred in the previous five months, with September’s 34M barrels (-7.5%) being the most critical single draw ever.
After the OPEC+ and President Biden decision, the U.S would have burnt through their Strategic Petroleum Reserve, with only 23 days of supply left, to reduce oil prices ahead of the mid-term elections.
Rates & Currency
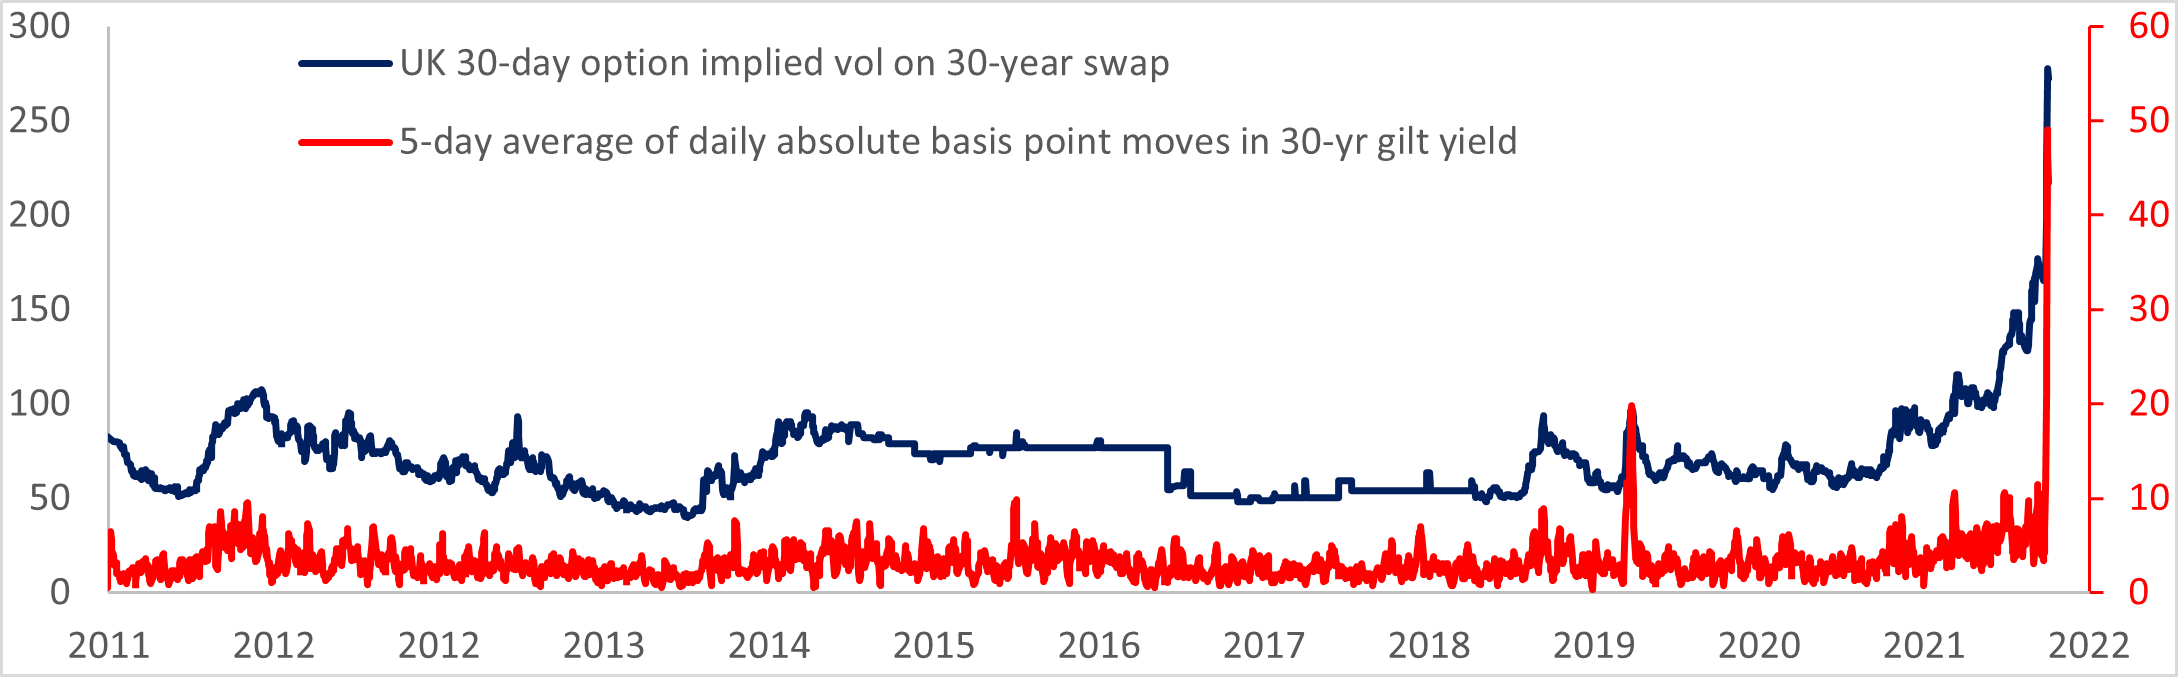
Serious market dislocation
In the last week of September, a lot of chaos occurred in the fixed-income market as the long end of the gilt curve was not the most obvious place to find a blow-up in excess derivatives exposure. In the United Kingdom, pension funds faced margin calls that saw the gilt market face pandemonium and a quick sale of gilts.
The BOE stepped in with a bailout (where have we heard that before?) that saw the benchmark 30-year price on the gilt jump over 25%. The long end of the yield curve traditionally moves around five basis points each day; the current volatility in rates resembles meme stocks blowing up during the mania of 2021.
The fundamental issue is the United Kingdom is experiencing almost double-digit inflation with a BOE that is refusing to tighten monetary policy meaningfully. Therefore long-term inflation will stay elevated. In addition, the BOE was offloading gilts on their balance sheet; now, at the first sign of systematic risk, they are buying again while raising interest rates. The date to watch out for is Oct. 14, as the gilt sales will end, but this could contribute to a much greater interest rate hike than first thought.
Bitcoin Overview
- Hash rate hits all-time high – 248.64 EH/s
- Lightning capacity surpasses 5k BTC
- Futures contracts denominated in BTC hit an all-time high
- Whales selling BTC at the third most aggressive rate in history
- Shrimps continue to stack amid macro uncertainty
- Asia trade premium is at its highest point in 2022
Addresses
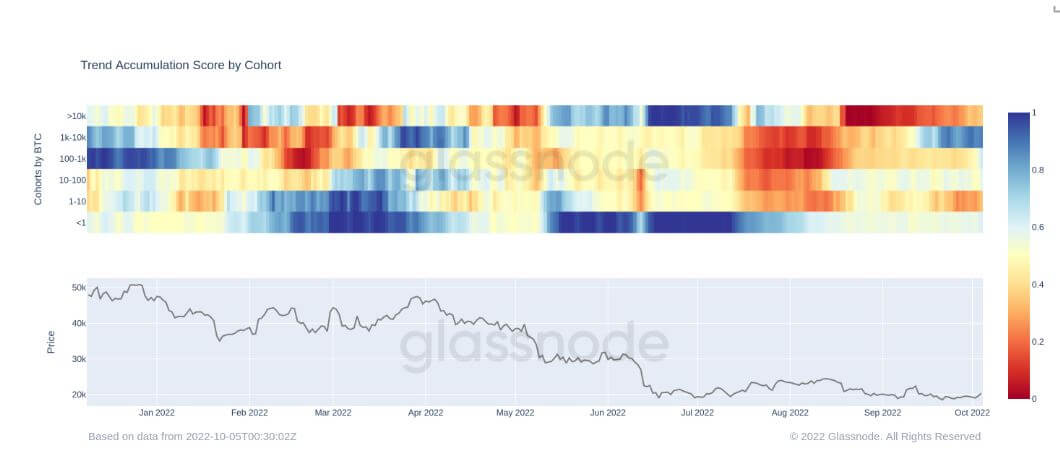
Collection of core address metrics for the network.Heavy distribution from a wide range of cohorts
This metric breaks down the Accumulation Trend Score into the relative behavior of various entity wallet cohorts.
The relative strength of the accumulation for each entity balance is measured by both the size of the entities and the amount of coins they have acquired over the last 15 days. For more details on calculation methodology, please see this Academy entry.
- A value closer to 1 indicates that participants in that cohort are accumulating coins.
- A value closer to 0 indicates that participants in that cohort are distributing coins.
- A list of entities, including exchanges and miners, is excluded from the calculation.
For the past three months, from July to September, there has been a relatively small amount of accumulation from many different cohorts. In July, shrimps and whales were accumulating at one of the most aggressive rates in history. However, since then, all cohorts have started to be net distributors.
As we enter a global recession, liquidity dries up, and unemployment begins to spike. Bitcoin becomes the most liquid asset to sell to pay for any debt obligations; in this environment, it would be encouraging to see smaller cohorts at 0.5 to symbolize no distribution but holding onto their Bitcoin.
Entities
Entity-adjusted metrics use proprietary clustering algorithms to provide a more precise estimate of the actual number of users in the network and measure their activity.Whales vs. shrimps
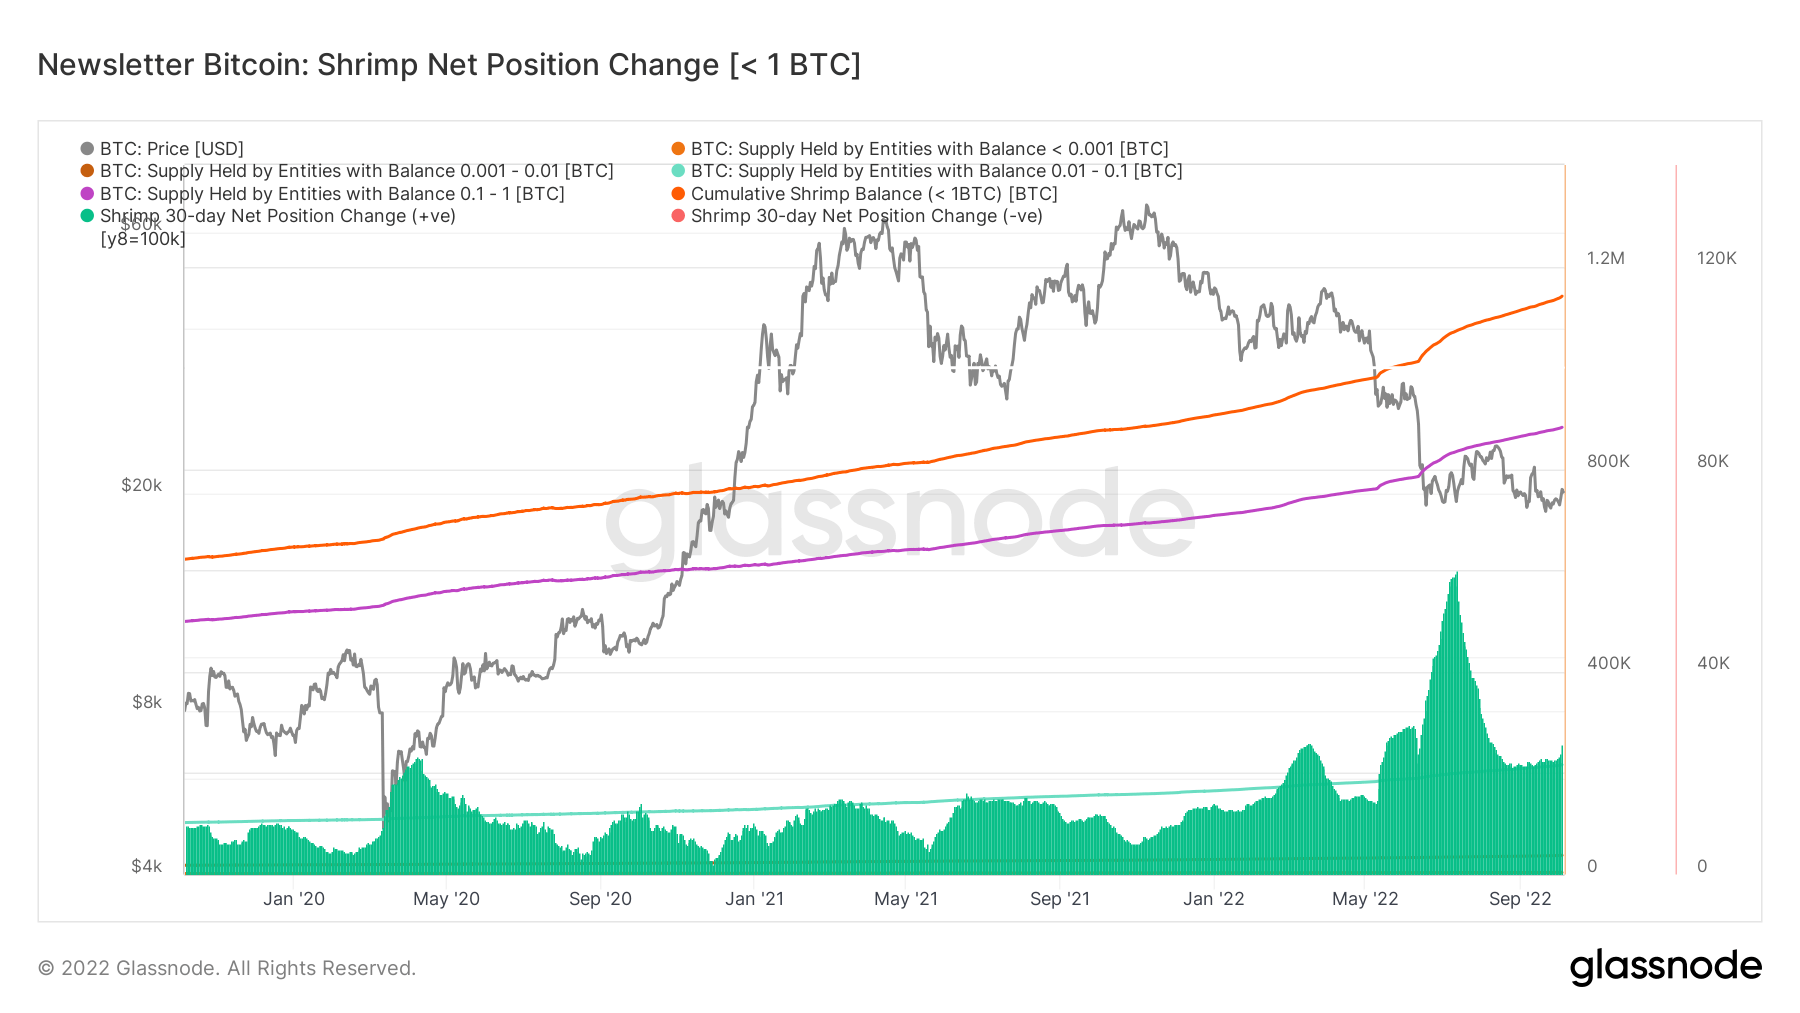
A further deep dive into whale and shrimp holdings can be summarized below. Shrimps are a cohort if you hold one or less Bitcoin, and their holdings have risen since covid dramatically. The 30-day net position change has always remained positive, showing that this cohort accumulates more than they distribute and has increased their bullishness as time passes.
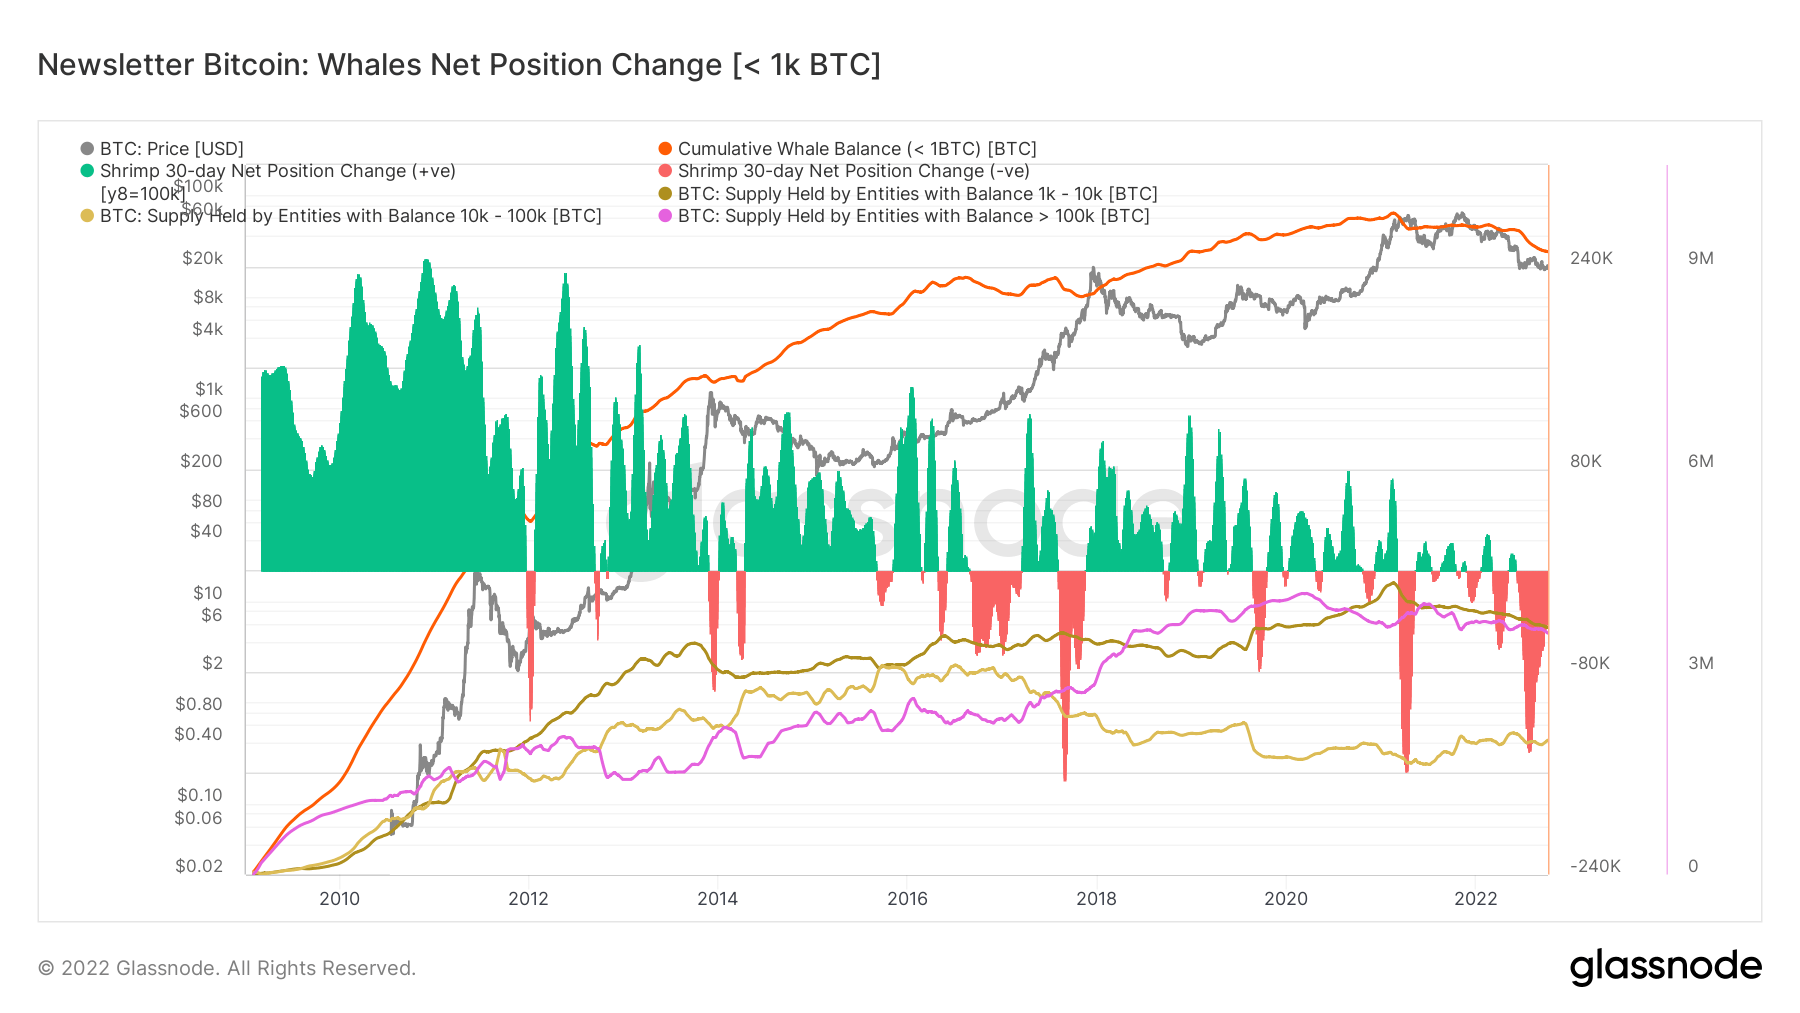
However, whales holding 1K BTC or more have been on a different journey. They are considered the smart money of the ecosystem, and during the 2017 and 2021 bull run, they distributed the most BTC reaping vast amounts of profit. Currently, they are in one of their most extended selling periods at the third most aggressive amount, and considering BTC is trading for around $20,000, it doesn’t bode well in the short term.
Dervatives
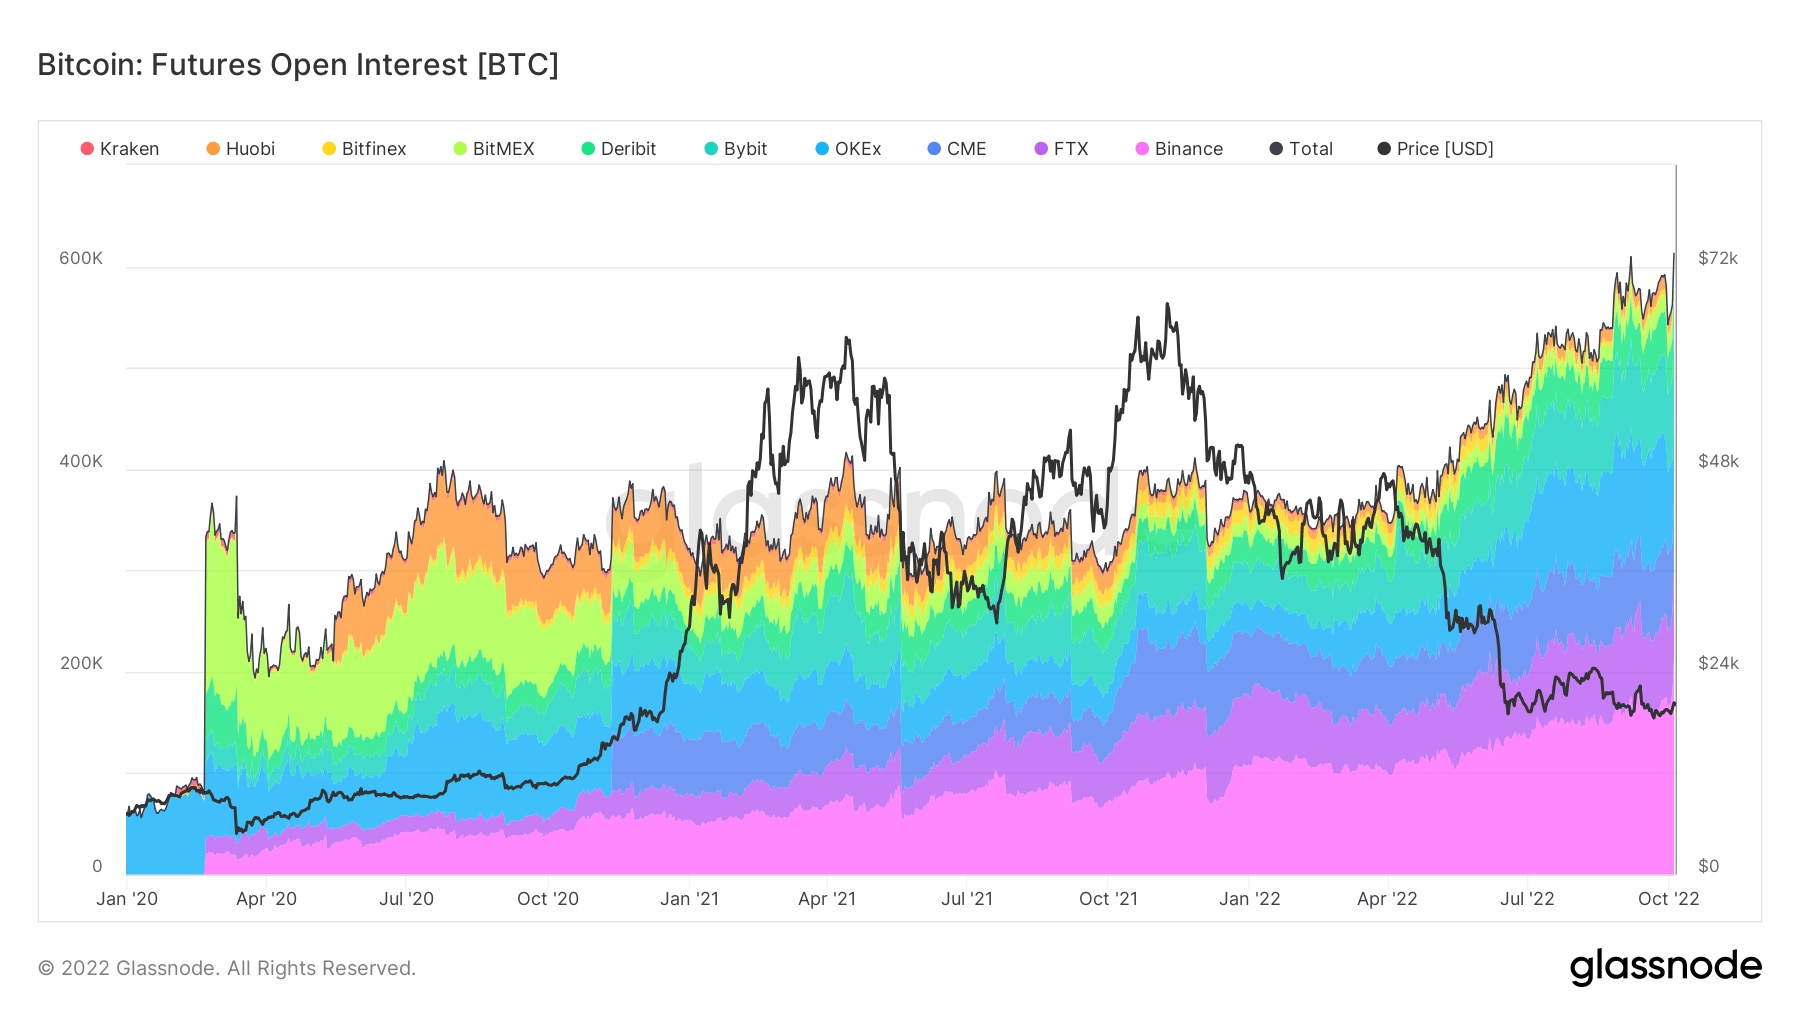
A derivative is a contract between two parties which derives its value/price from an underlying asset. The most common types of derivatives are futures, options and swaps. It is a financial instrument which derives its value/price from the underlying assets.Traders piling into futures
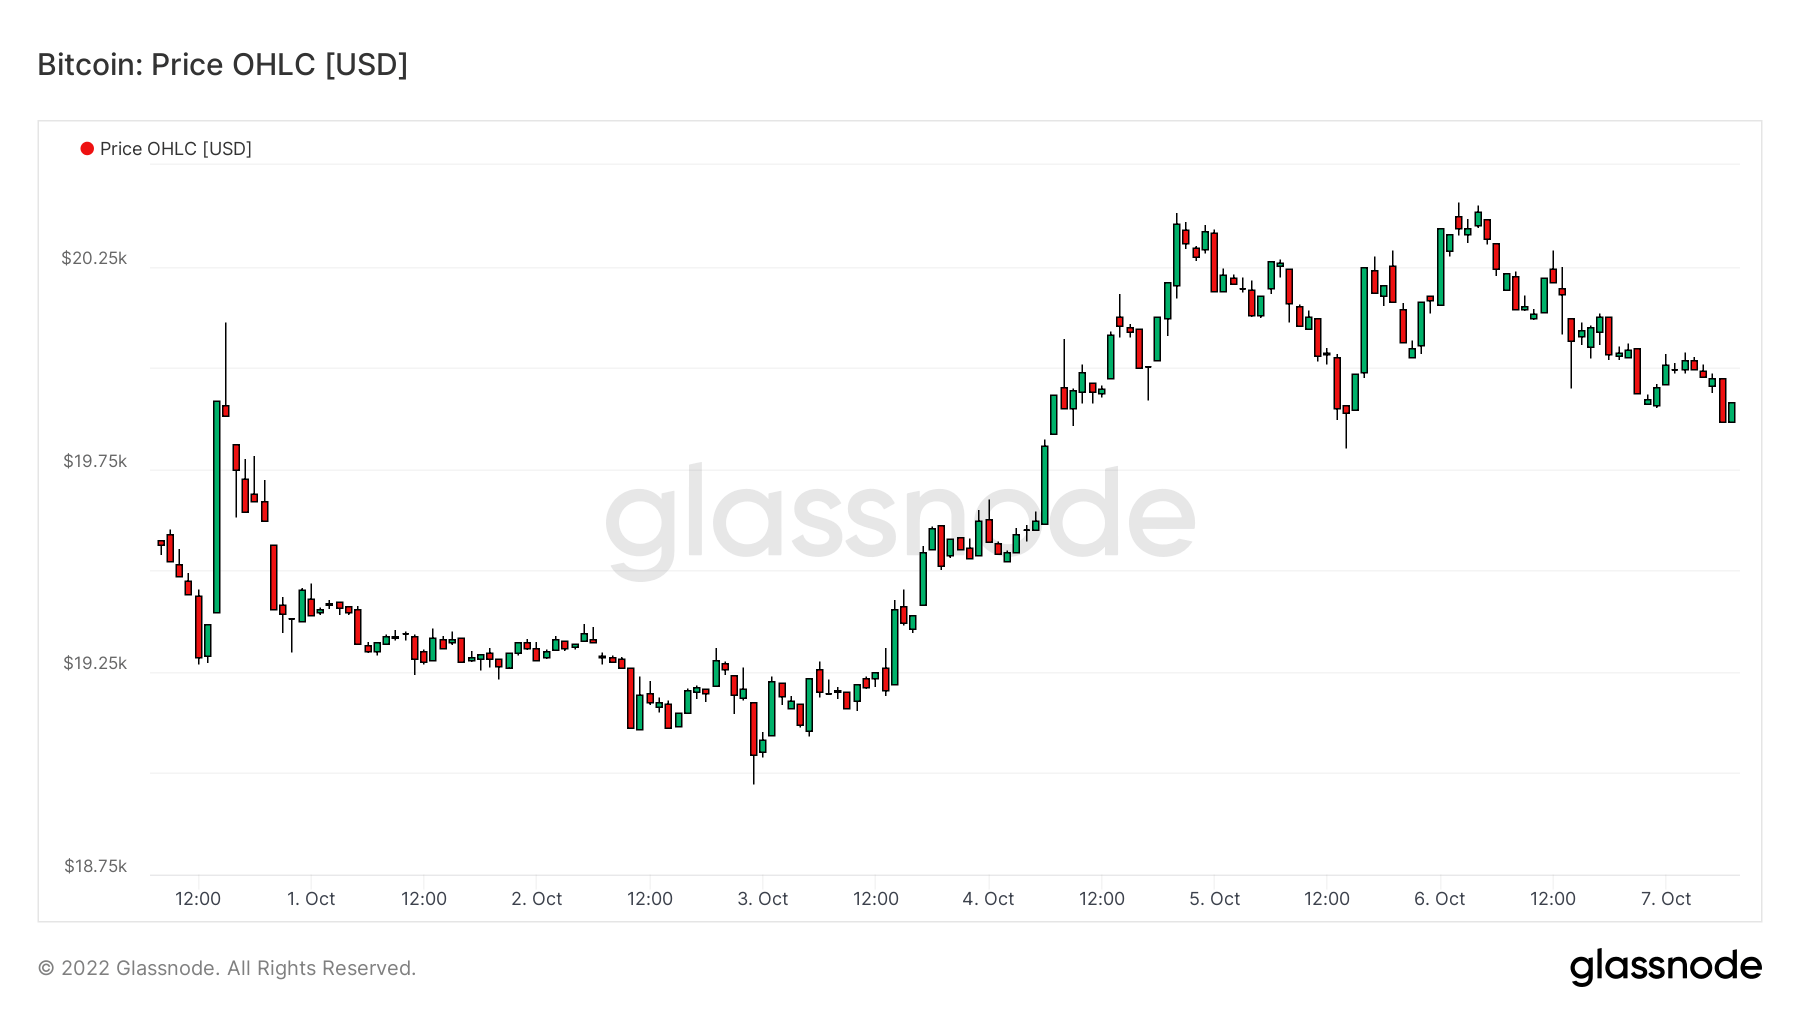
Bitcoin surpassed $20k this week, with a huge helping hand in a rally in equities but most thankful to traders piling into futures.
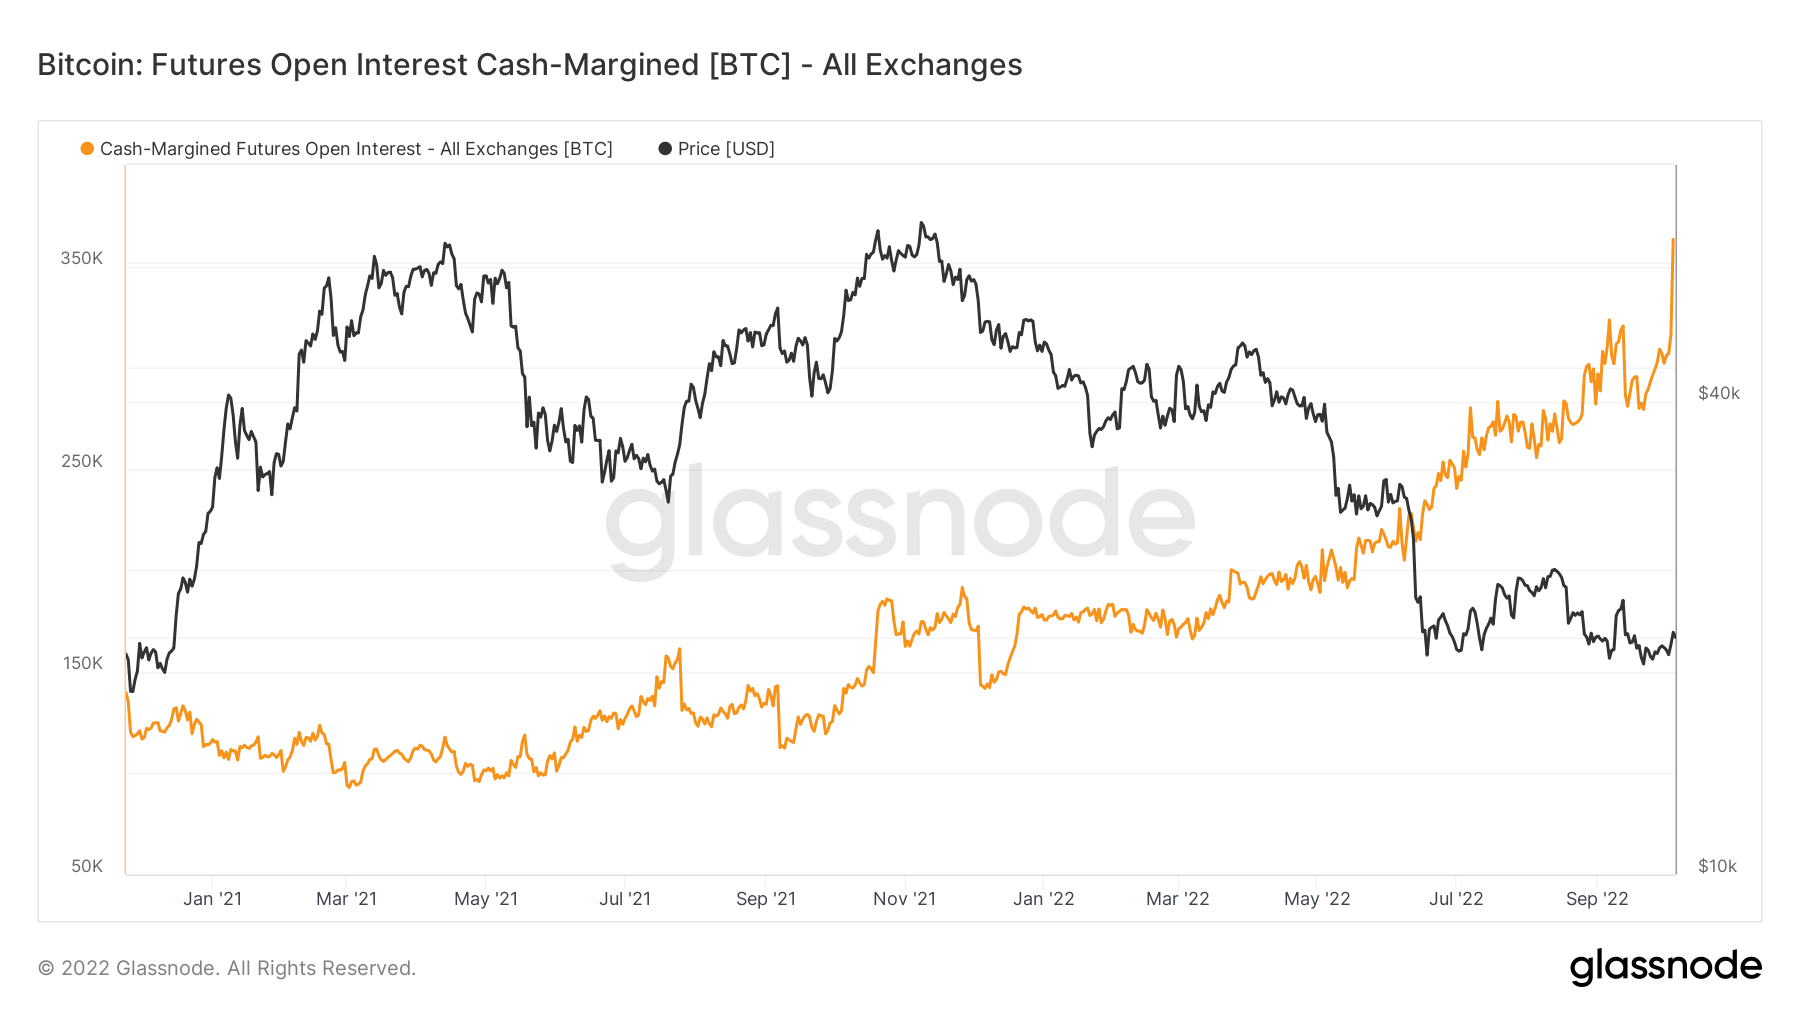
Futures open interest cash margined is the total amount of futures contracts open interest that is margined in USD or USD-pegged stablecoins. Stablecoins include USDT and BUSD. On Oct. 4, it went to an all-time high, surpassing 350k, with little spot buying activity occurring, which is not sustainable.
With open Interest building up, there is potential for a liquidation cascade (on either shorts or longs) if the price deviates far enough from this range. Roughly $450 million of Bitcoin open interest was opened above $19,500 price levels on Oct. 4 — assuming the majority is aggressive longs are now underwater.
Miners
Overview of essential miner metrics related to hashing power, revenue, and block production.Proof of work is the fairest consensus
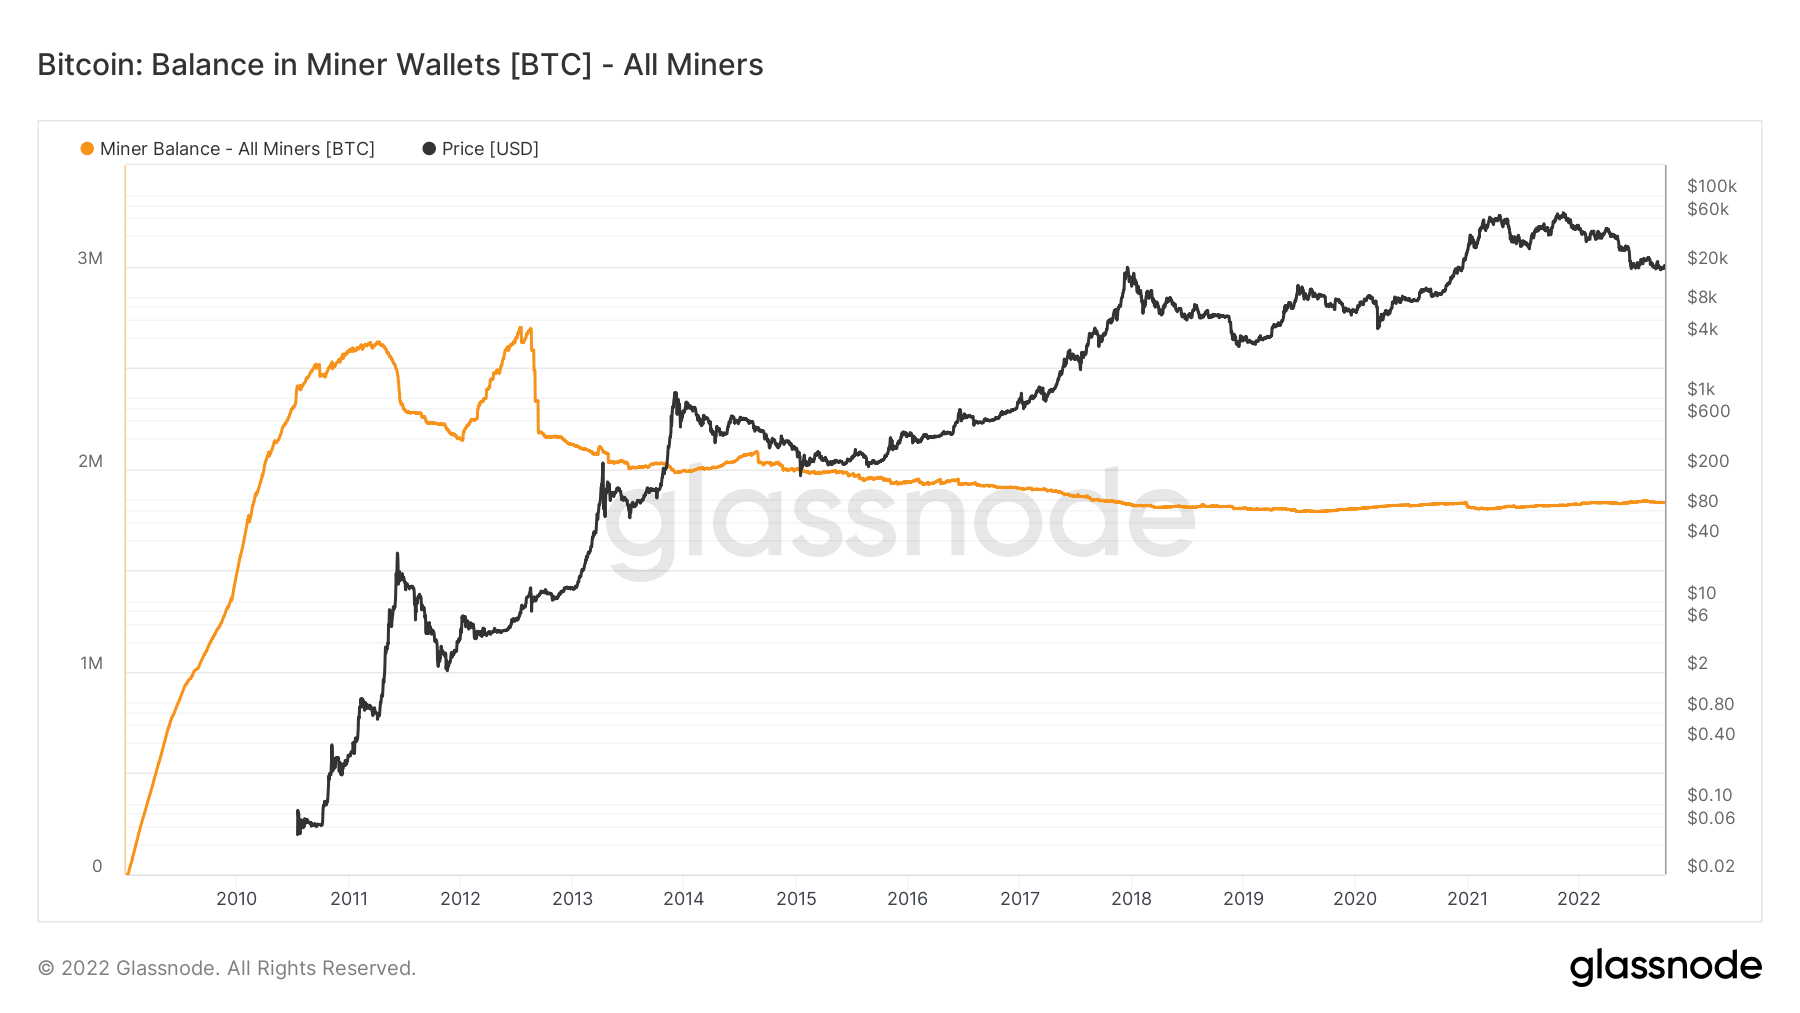
Miner balance is at its lowest point in Bitcoin terms since 2010. This is the power that proof of work gives, steadily creating an equal distribution of the currency across time.
Miner balance has seen large outflows since prices were rejected from the local top of $24,500. This suggests miner profitability is still under stress, as over 8k BTC were sold in September to cover USD-denominated costs.
Hash rate hits all-time high
Bitcoin’s hash rate has soared to new all-time highs of 248.64 EH/s, now 3X from the lows reached during the China mining ban. With an expected difficulty adjustment of over 10% on Oct. 10, miners continue to get squeezed in terms of revenue, but the network is stronger than ever.
On-Chain Activity
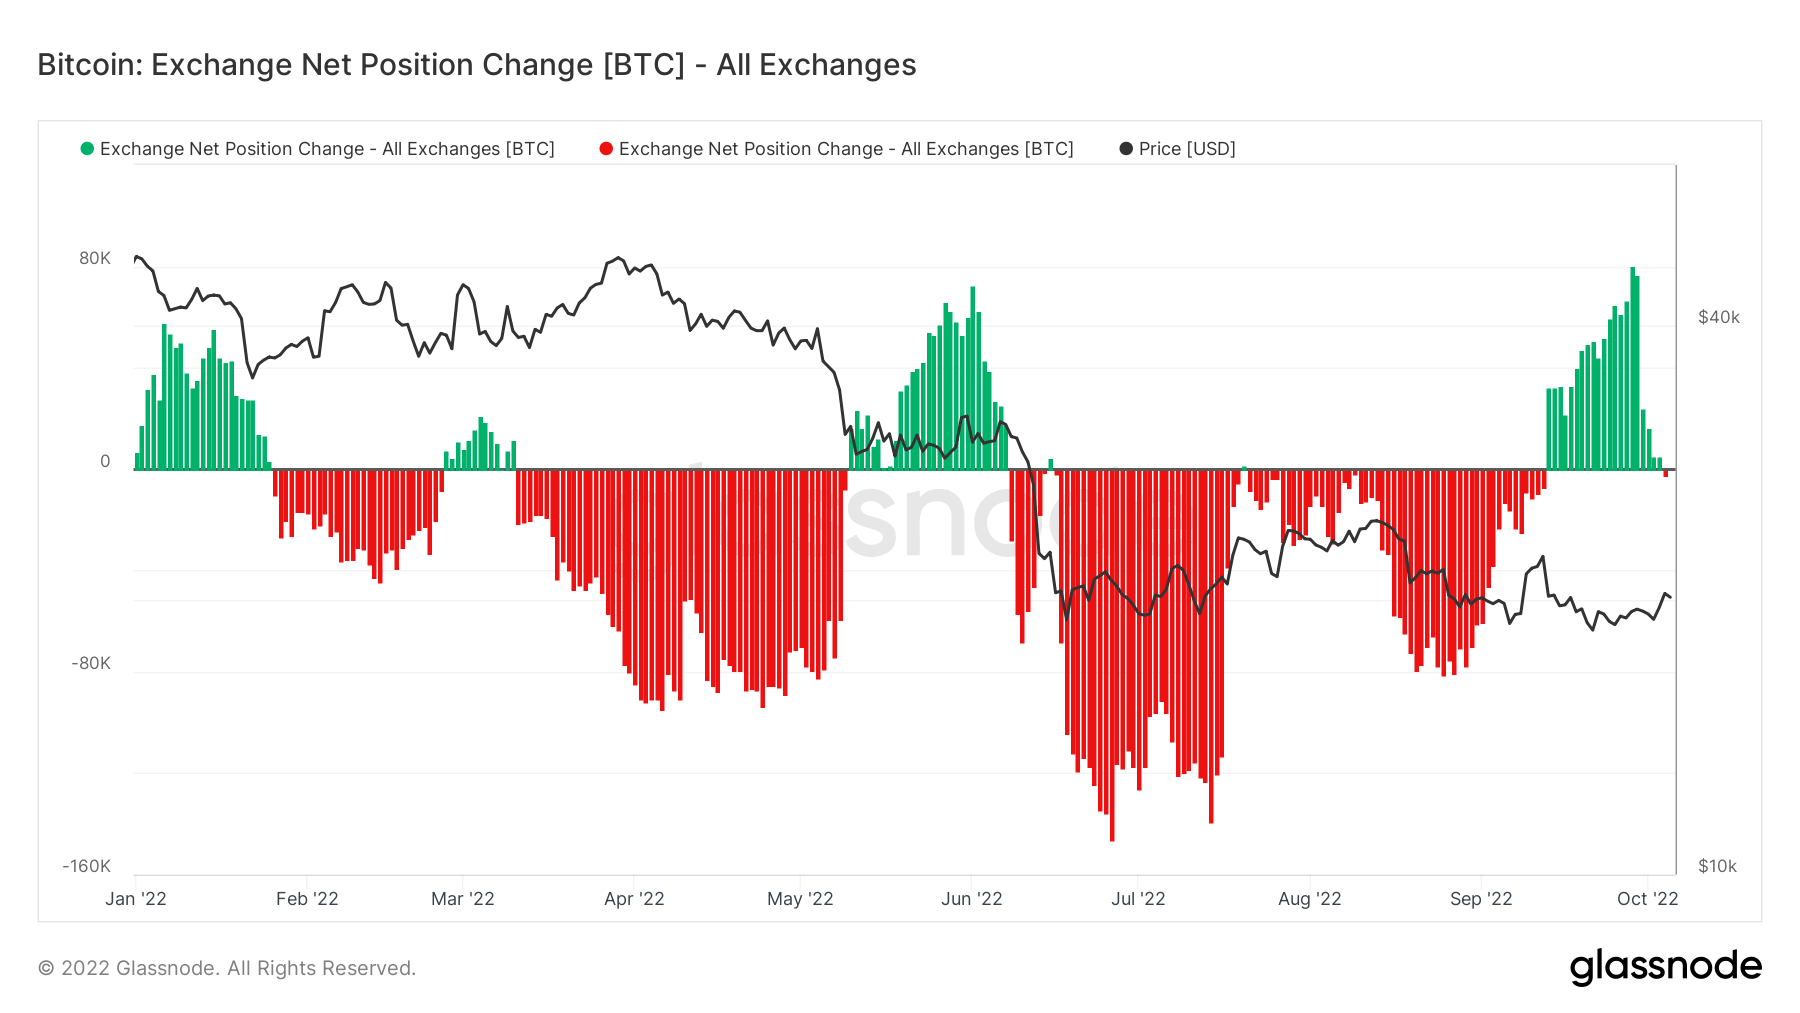
Collection of on–chain metrics related to centralized exchange activity.Outflows from exchanges, first time in almost a month
2022 has seen periods of inflows and outflows from exchanges, and looking at the metric exchange net position change; it is easy to understand investors’ rationale.
When the Russian invasion took place, the Luna collapse and the macro uncertainty being at extreme levels in September all saw periods of inflows to exchanges. Investors were fearful and sold. However, the other periods of 2022 have seen aggressive outflows. As many as 100k BTC were leaving exchanges, which was bullish.
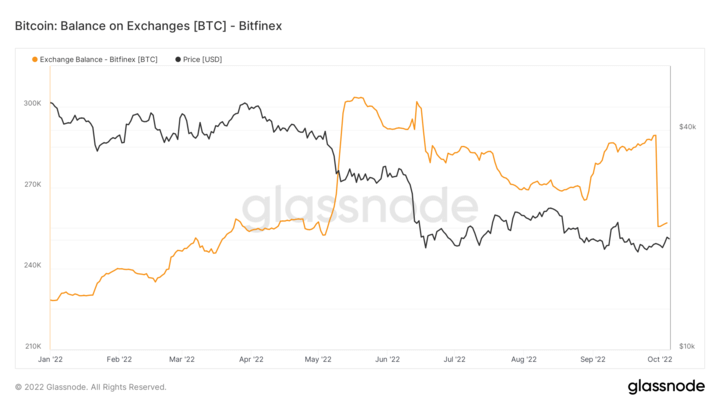
Bitfinex saw a significant amount of BTC being withdrawn from their exchanges at the beginning of October, over 30k BTC ($6 billion). This has contributed to reducing inflows to exchanges over 30 days; for a more constructive narrative, Bitcoin outflows need to remain to show investor appetite is still there.
Geo Breakdown
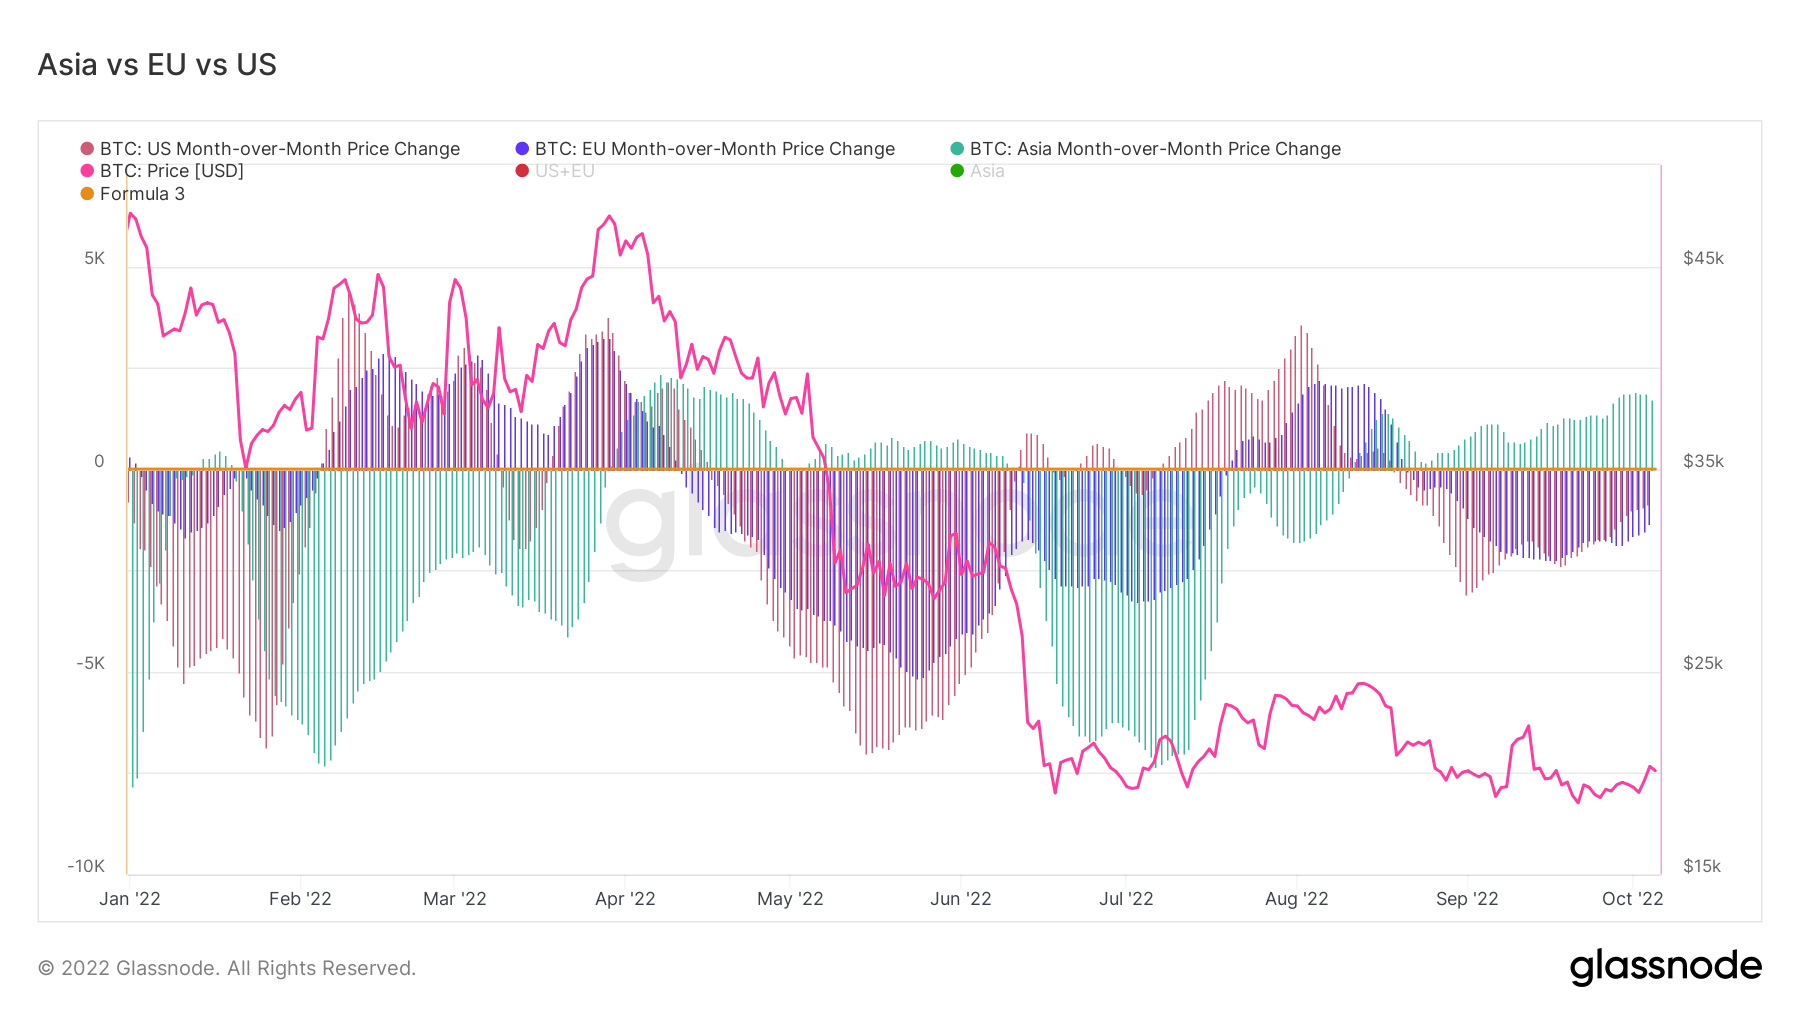
Regional prices are constructed in a two-step process: First, price movements are assigned to regions based on working hours in the US, Europe, and Asia. Regional prices are then determined by calculating the cumulative sum of the price changes over time for each region.Asia trade premium approaching 2022 highs
For the past three months, CryptoSlate has been addressing that Asia is the smart money of the BTC ecosystem over the EU and the US. Asia purchases BTC when the price is low or being suppressed, which is precisely what has been happening for the last three months; Asia’s bullishness has only increased, but the EU and US continue to be in fear and sell their BTC holdings.
Supply
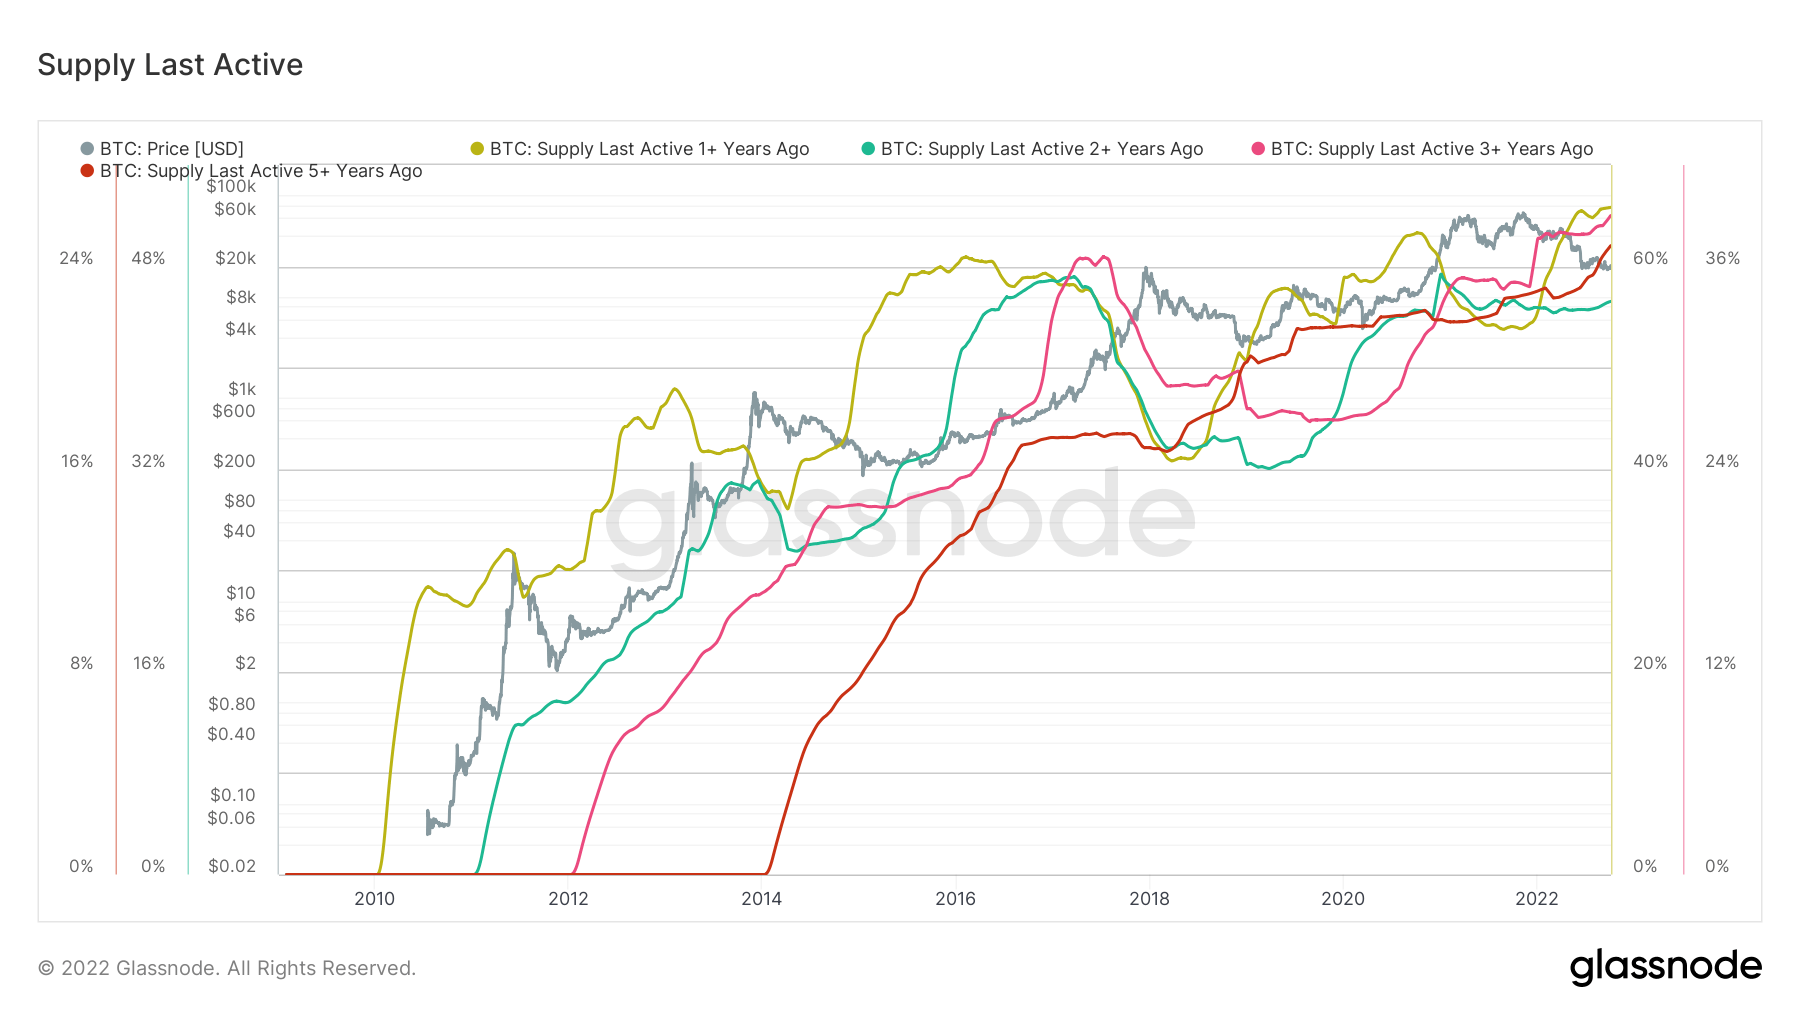
The total amount of circulating supply held by different cohorts.Diamond hands keep growing
The percent of circulating supply that has not moved in at least one year is 66%; this is an all-time high. Yes, the number has plateaued, but it’s encouraging to see that it’s holding these high levels. Most of the holdings would be significantly underwater as we approach the time Bitcoin hit almost $69,000 in November 2021.
In addition, supply last active 2,3 and 5 + years are also trending to all-time highs. Holders refuse to sell and hold onto their assets during the most volatile and uncertain times.
More Market Reports


