Has Ethereum bottomed relative to Bitcoin?

Cover art/illustration via CryptoSlate. Image includes combined content which may include the use of AI tools.
Skew, a London-based data provider for Bitcoin and Ether derivatives, recently raised the question that most investors in the industry have been asking themselves for a while: “has Ether bottomed relative to Bitcoin?”
Even though the founder of the Crypto Cast Network, Vortex, did not hesitate to respond that Ethereum looked “pretty dead” to him, the following technical analysis will explore whether the trading pair ETH/BTC is showing signs of a bottom.
Ethereum Technical Analysis
Ethereum has been on a death spiral against Bitcoin since it reached an all-time high of over 15 million satoshis on June 13, 2017. Since then, this cryptocurrency has depreciated nearly 90 percent to hit a low of 1.66 million satoshis on Sept. 6 of this year.
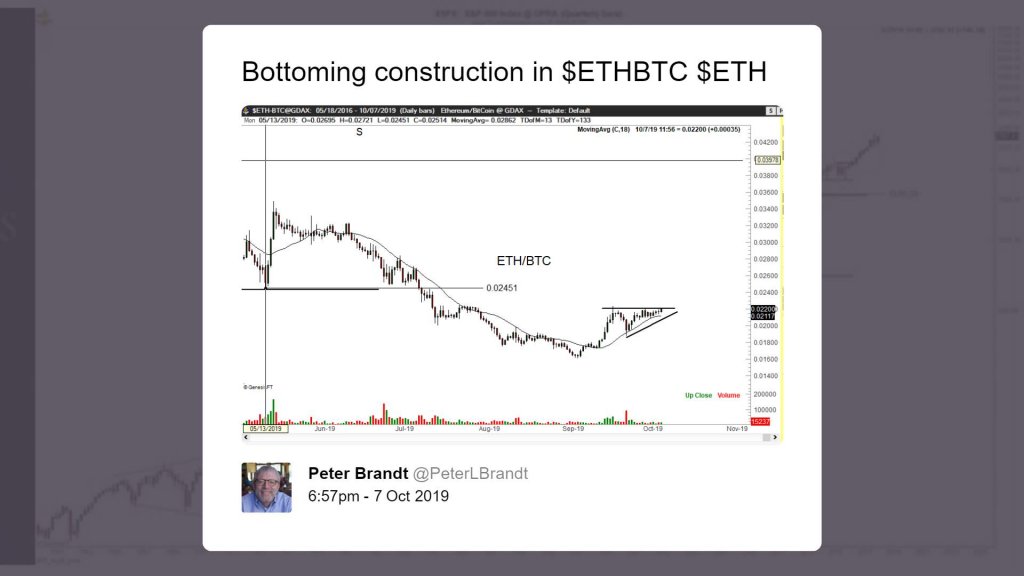
Following the recent low, 40-years trading veteran Peter Brandt pointed out on Oct. 7 that Ethereum could be constructing a bottom against Bitcoin on its 1-day chart. Despite Brand’s statement, ETH made a higher low twenty days later reaching 2.1 million satoshis.
Now, it seems like an ascending triangle could be developing on ETH/BTC’s 1-week chart. This technical pattern developed as ETH’s price movements formed a horizontal line along with the swing highs and a rising trendline along with the swing lows. By measuring the height of the triangle, at its thickest point, this pattern estimates a 30 percent target from the breakout point.
It is worth noting that a breakout can occur in any direction. On the upside, Ethereum could rise to the 50 percent Fibonacci retracement level that sits around 2.9 million satoshis. Conversely, a spike in the selling pressure behind this cryptocurrency could take it to make a lower low around 1.54 million satoshis.

Based on its 12-hour chart, it seems like ETH is testing a major resistance cluster given by the 150-twelve-hour moving average and the top of an ascending parallel channel. The price of Ethereum is contained within this technical formation since Oct. 27. Since then, every time it reaches the bottom of the channel, it bounces off to the middle or the top. But, when it reaches the top, it falls back to the middle or the bottom.
At the moment, Ethereum is trading around the top of the ascending parallel channel. An increase in volume that allows this crypto to break out of the channel and close above the 150-twelve-hour moving average could be seen as a very positive sign.
If this happens, ETH could rise to test the next level of resistance around the 200-twelve-hour moving average that sits at 2.36 million satoshis, which is also where the adjacent line of the ascending triangle sits. Closing above the 200-twelve-hour moving average could indicate that ETH is about to surge 30 percent.
Nonetheless, failing to move above the 150-twelve-hour moving average could signal a retrace to the bottom of the channel. If the sell-off is strong enough, ETH could break below the 100-twelve-hour moving average. This would likely validate the bearish perspective given by the ascending triangle on the 1-week chart.
Overall perspective
To answer the question that Skew recently formulated about Ethereum bottoming against Bitcoin, one must have to wait to see how this cryptocurrency will behave in the following days or weeks. Moving above the 200-twelve-hour moving average on the 12-hour chart would certainly increase the odds that ETH has bottomed out. But, if the selling pressure behind this crypto continues to increase and it closes below the 100-twelve-hour moving average, the carnage would likely continue and Ethereum will make a lower low.