Data Indicates Bitcoin Price is Uncorrelated with Stock Market

Cover art/illustration via CryptoSlate. Image includes combined content which may include the use of AI tools.
A frequently asked question about bitcoin is whether the stock market influences its price, or whether the cryptocurrency acts as a ‘safehaven’ during stock market downturns. The latest analysis by CryptoSlate sheds some light on these questions.
Understanding Beta
One measurement that can help deduce whether the stock market and bitcoin prices are correlated is a technical finance measurement called beta. Beta measures the tendency of an asset (like bitcoin) to respond to changes in the price of a benchmark, like the S&P 500.
The S&P 500 is a commonly used benchmark because it usually reflects the performance of the overall U.S. stock market. The index is comprised of the 500 largest companies listed on the New York Stock Exchange (NYSE).
Investors often use beta to diversify their investment portfolios. By combining assets which are uncorrelated, but still have good upside, it is possible to minimize the amount of price fluctuation that a portfolio experiences while still optimizing for returns. For a better understanding, savvy readers can learn about the capital asset pricing model (CAPM).
A positive beta indicates that an asset is correlated with a benchmark. If the benchmark increases in value, then the asset also tends to increase in value. A negative beta indicates the reverse. If the benchmark increases in value, then the price of the asset tends to decrease. A beta of zero suggests there is no correlation between the benchmark and the price of the asset.
Technical explanation: The beta of an asset compared to a benchmark is calculated by taking the covariance of both the asset and the index over a given period of time and dividing it by the variance of the benchmark. Covariance is the measure of the directional relationship between two assets, while variance measures how far each number deviates from the average.
Beta = (Covariance of Bitcoin and the S&P 500) /
Variance of the S&P 500
For reference, a stock in a big technology company tends to have a beta greater than 1.0, gold usually has a beta of -1.0, and investment-grade corporate bonds tend to have a beta of 0.0.
Understanding the Pearson Correlation Coefficient
Another figure that may assist in determining bitcoin’s correlation with the market is the Pearson Correlation Coefficient (PCC). The coefficient is used to measure the strength of a relationship between the relative movement of two variables. Investors often add low or negatively correlated assets to an existing portfolio for diversification.
The PCC goes from 1.0, which shows a perfect correlation, and -1.0, which shows a perfect negative correlation. The test only measures the linear relationship between two assets. For example, if there was a quadratic or parabolic relation between two assets, the Pearson Correlation Coefficient would not be able to detect this relationship.
According to Investopedia, experts do not consider a correlation significant until the value surpasses at least 0.8. Furthermore, the PCC does not need to be specific to finance. Some examples of other phenomena that are correlated are the price of a Big Mac and the cost of living, GDP per capita and the average household salary, or the average daily temperature and ice cream sales.
Technical explanation: The correlation coefficient is calculated by taking the covariance of two assets and then dividing that by the product of their standard deviations (volatility).
PCC = (Covariance of Bitcoin and the S&P 500) /
(Standard Deviation of Bitcoin * Standard Deviation of S&P 500)
Analysis by the Numbers
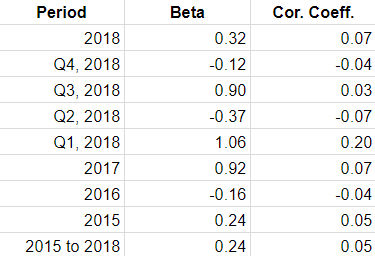
Based on original analysis conducted by CryptoSlate, the beta of bitcoin relative to the S&P 500 fluctuates wildly.
Over 2018, bitcoin had a beta of 0.30, suggesting it is loosely correlated. During the robust stock and crypto market year of 2017, bitcoin almost had a perfect beta value with the stock market of 0.92. Yet, in 2016, bitcoin had a beta value of just -0.16, suggesting no correlation, or a slight inverse correlation with the market. Overall, since 2015, bitcoin has had a beta of 0.24.
These figures suggest that bitcoin is not correlated with the stock market, or, if it is, the price volatility makes it hard—if not impossible—to deduce.
For all periods between 2015 to 2018, the correlation coefficient, at its highest, was 0.20. Most years the value has been between 0.10 and -0.10. These correlation values suggest that bitcoin and the S&P 500 are not at all correlated, at least in terms of a linear price relationship.
This puts bitcoin in a comparable category to investment grade corporate bonds, Treasury inflation-protected securities (TIPS), and to a lesser extent, real-estate, which all tend to be uncorrelated with the stock market.
Ramifications on the Market
Based on these two measurements alone, it is unlikely that the price of bitcoin is correlated to the S&P 500—and by extension—the overall U.S. stock market. Currently, there is not a sufficient amount of data to conclude whether bitcoin responds positively to a bearish stock market.
If bitcoin is not correlated to the stock market, it may make it an excellent addition to a traditional portfolio for diversification. And, as an uncorrelated asset, it would serve a different function than gold, which tends to be negatively correlated with the performance of the stock market.
That said, the amount of volatility associated with bitcoin and cryptocurrencies still makes the asset highly speculative.