Bitcoin exchange inflows spike to 43 month high
BTC bottomed above the key $20,000 level on Wednesday, but on-chain analysis suggests this level may not hold in the coming days and weeks.
Cover art/illustration via CryptoSlate. Image includes combined content which may include the use of AI tools.
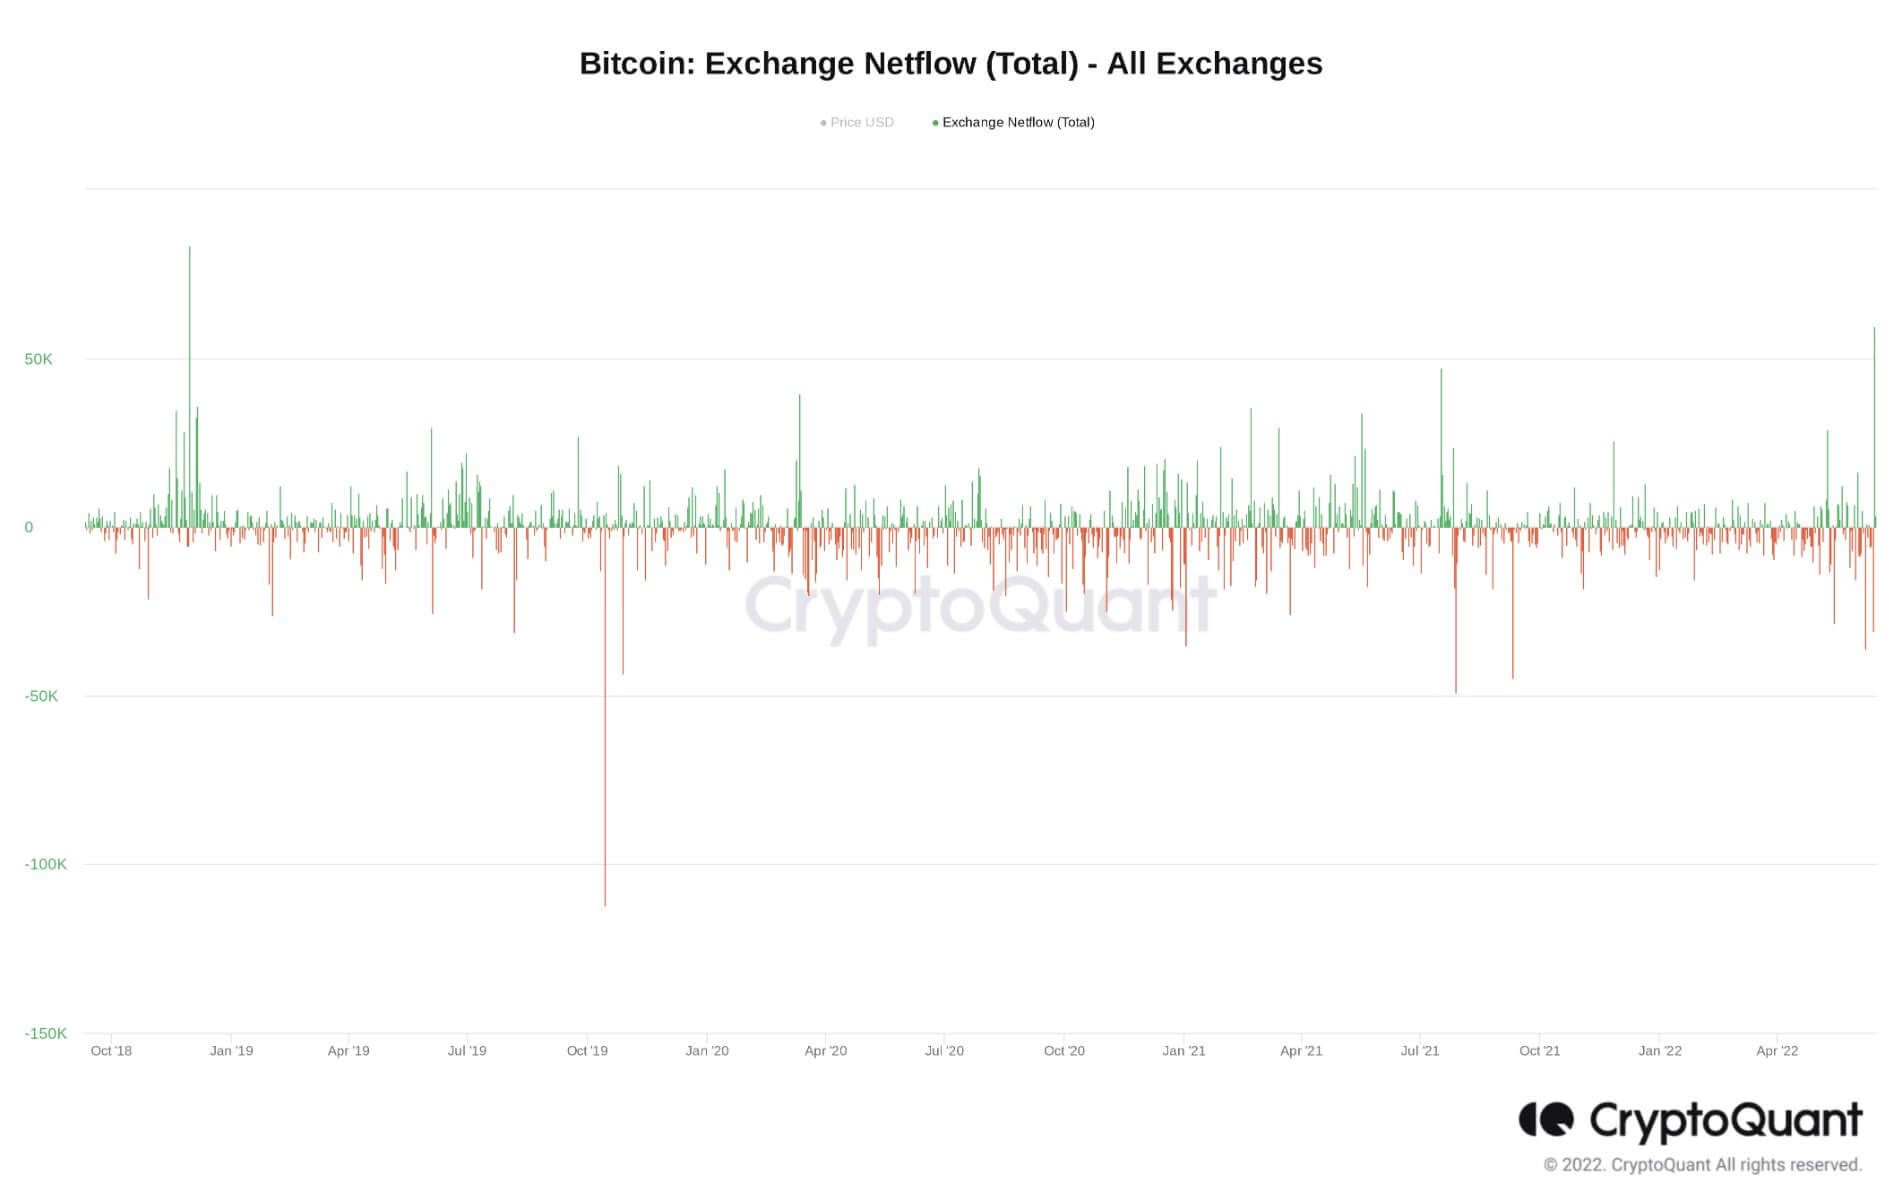
Using data from CryptoQuant, YouTuber Lark Davies tweeted that the number of Bitcoin flowing into exchanges is at its highest “since the bear market bottom of 2018.” Daves added that market lows always seem to be met with panic selling.
#bitcoin just saw the largest exchange inflow since the bear market bottom of 2018!
Every time the market tanks investors rush to panic sell the lows. pic.twitter.com/tUNMIqo32G
— Lark Davis (@TheCryptoLark) June 15, 2022
U.S rate hike doesn't spook the market
Bitcoin closed below $30,000, on June 10, following the release of data showing U.S consumer prices for May were at a 40-year high.
Since then, the BTC price has been cascading lower, hitting a bottom of $20,100 on Wednesday. Large trading volume accompanied the ensuing bounce, but daily momentum is weak as the Relative Strength Index (RSI) remains deep in oversold territory.
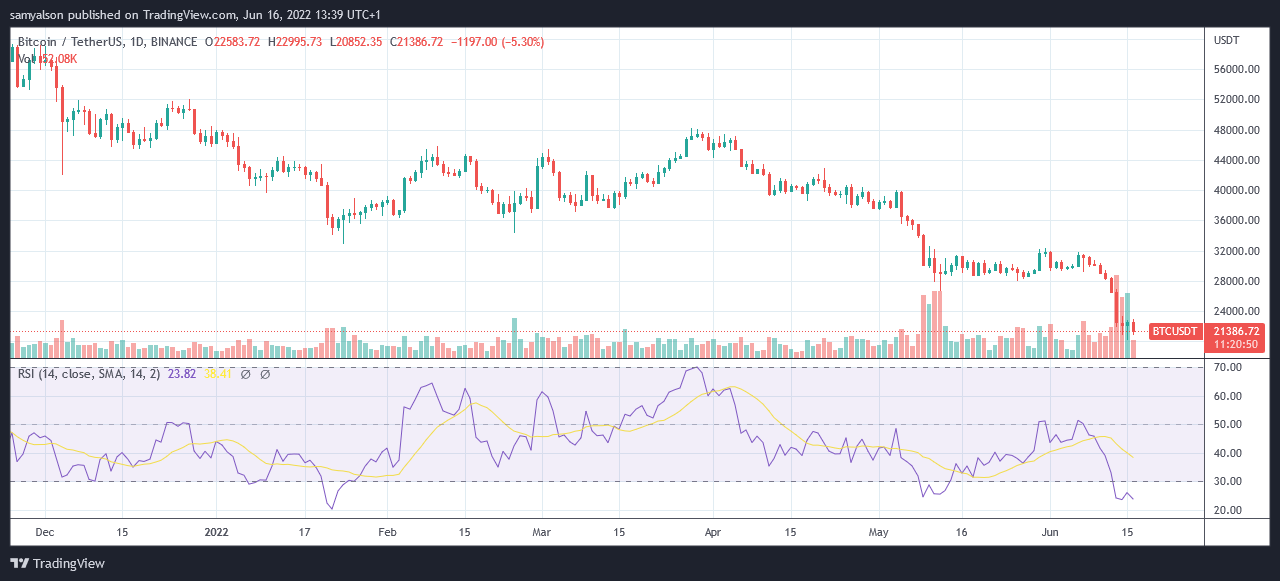
Wednesday's Fed policy meeting announced a 75-basis-point increase in the benchmark policy rate, taking the primary rate to 1.75%.
Contrary to expectations of a market sell-off, as a response, Bitcoin rose to peak at $23,000 in the early hours of Thursday (GMT).
Bitcoin exchange inflows spike amid market uncertainty
Amid this, crypto exchanges saw their highest net Bitcoin inflows since November 2018, at approximately 83,000 BTC. This indicates increasing sell-side pressure is mounting, which draws concerns over whether the local bottom, $20,100, will hold in the coming days and weeks.
Meanwhile, Glassnode data on the HODLer net position change, which examines the rate of accumulation or distribution by long-term investors, suggests weakness in the accumulation appetite of hodlers.
The chart below shows a current net hodler inflows are still net positive. But recent net inflows are down significantly since the May local top, suggesting “a weakening accumulation response” by hodlers.
“approximately 15k-20k BTC per month are transitioning into the hands of Bitcoin HODLers. This has declined by around 64% since early May, suggesting a weakening accumulation response.”
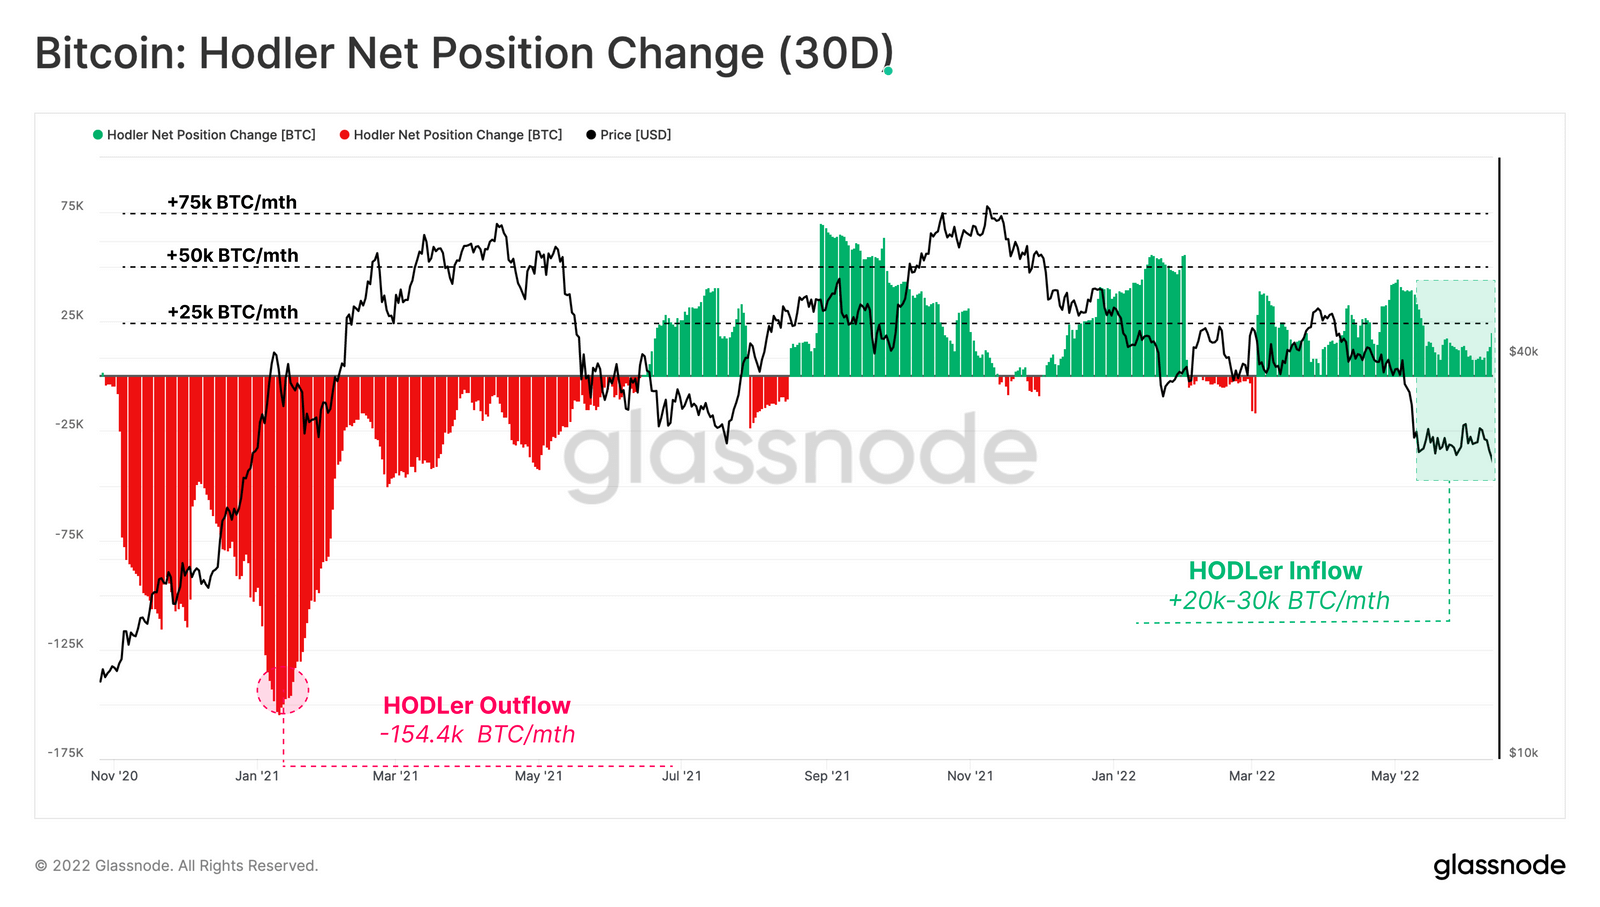
When taken in conjunction with significant exchange inflows, the signs indicate further price declines for Bitcoin. Glassnode expects BTC to drop between 40% and 64%.
But, in a divergence from his usual work, on-chain analyst Willy Woo brings in the macroeconomic factor by saying a bottom comes “when macro markets stabilize.”
“I think it's simpler than this, IMO we'll find a bottom when macro markets stabilize.“