Bitcoin, Ethereum, and XRP prepare for a significant move

Cover art/illustration via CryptoSlate. Image includes combined content which may include the use of AI tools.
Despite the high volatility seen across many altcoins, especially those based in China, the rest of the market is holding steady without much action. Some of the most prominent technical analysts in the space, such as Tone Vays, are expecting more downside. The following technical analysis will evaluate whether the top three cryptocurrencies, Bitcoin, Ethereum, and XRP, are indeed bound for a decline.
Bitcoin (BTC)
After surging to nearly $10,500 on Oc. 26, Bitcoin began consolidating between the 61.8 and the 50 percent Fibonacci retracement level. This consolidation phase led to the formation of a descending parallel channel on BTC’s 4-hour chart. Since then, every time this crypto hits the bottom of the channel, it bounces off to the middle or the top. But, when it hits the top, it falls back to the middle or the bottom.
Bitcoin is now trading around the bottom of the channel threatening to break out in a downward direction. If BTC is able to close below the 50 percent Fibonacci retracement level, it would likely move down to the next level of support around $7,900. And, if the selling pressure behind it is strong enough it could even test the 38.2 Fibonacci retracement level, at $7,250.
Nevertheless, a spike in volume that takes BTC to hit the top of the channel and close above it could invalidate the bearish outlook. If this happens, then Bitcoin could push for higher highs considering that the parallel channel on the 4-hour is part of a bull flag.
This type of technical formation is considered a continuation pattern. As Bitcoin surged to nearly $10,500, it formed the flagpole. And, the current consolidation period could be creating the flag. An increase in demand could result in a breakout in the same direction of the previous trend.
By measuring the height of the flagpole, this technical pattern estimates a 25 percent upswing upon the breakout point. If validated, Bitcoin could rise to $11,300.
Ethereum (ETH)
The sudden spike in prices that Ethereum experienced on Oct. 25 increased the odds for the validation of a double bottom pattern. This technical development formed as Ether plunged to $153 on Sept. 26, rose to $198 on Oct. 11, and then retraced again to $153 on Oct. 23. However, ETH’s inability to continue the bullish momentum that it saw in late October could be a reason to believe that the double bottom was invalidated.
Now, this crypto is consolidating within a trading range between $177 and $193.50. This is also where the 61.8 and 65 percent Fibonacci retracement area sits. Closing below this zone would signal a further decline down to $153 while closing above it could indicate a move up to $223.

Based on ETH’s 4-hour chart, the TD sequential is presenting a buy signal in the form of a red nine. This bullish signal estimates a four to sixteen hours correction to the upside. If confirmed, Ethereum could bounce off the $177 support level to test the $193.50 resistance level once again.
However, due to the inability to determine whether this bounce could lead to a breakout, it would be wiser to consider the range between $177 and $193.50 a no-trade zone. Waiting for a breakout of this area poses a lower level of risk than trading within it.
XRP
XRP is contained within the $0.24 support level and the $0.30 resistance level since mid-August. This three months-long consolidation period continues to hold the price of this crypto. At the moment, it is not clear whether XRP would be able to close above or below this area. As a result, this can be considered a no-trade zone due to the high risk that trading within it poses.
Despite the neutral sentiment behind XRP, the TD sequential indicator is presenting a buy signal on its 1-day chart. This technical index estimates that XRP could surge for one to four days or begin a new upward countdown. Therefore, a close above the 100-day moving average could indicate that this cryptocurrency will try to test the $0.30 resistance level, which is also where the 150-day moving average sits.
Moving above this significant resistance cluster would likely take XRP to test the next level of support provided by the 200-day moving average. If the buying pressure behind this crypto is durable enough for it to break through all of these levels of resistance, then a breakout of the no-trade zone would take place.
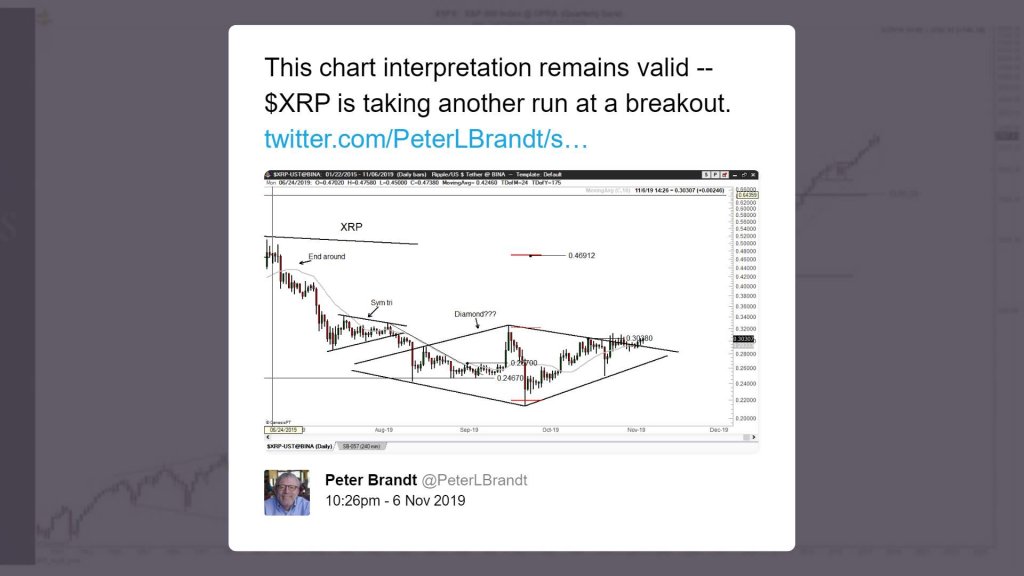
On one of his latest assessments about XRP, Peter Brandt stated that a diamond bottom pattern could be developing. According to the technical analyst, diamond bottoms are reversal patterns that are not common in traditional markets.
He said:
“The diamond pattern has always been a top pattern among traditional markets. I suppose pattern might work for a bottom in crypto markets.”
Brandt expects that if XRP can close above $0.30, it could shoot up more than 50 percent to $0.47.
Despite Brand’s bullish perspective, it is worth noting that if XRP closes below $0.24, it would likely plunge to $0.20 or $0.17.
Overall sentiment
Based on the technical analysis previously presented, it seems like the top three cryptocurrencies by market cap are sitting at pivotal points in their trends facing low levels of volatility. If Bitcoin closes below $8,500, it could bring the entire market down with it. If so, BTC could be aiming for a retest of the $7,300 support level. If such decline influences the rest of the market, Ethereum would likely plummet to $153 and XRP to $0.24.
Nonetheless, an increase in the buying pressure behind these cryptocurrencies could take them to test their respective resistance levels once again. Bitcoin could go up to $9,300 level, Ethereum to $193.5, and XRP to $0.30. But, if the volume is strong enough, then higher highs would be very likely.