Bitcoin consolidating above former resistance, but what’s next?

Cover art/illustration via CryptoSlate. Image includes combined content which may include the use of AI tools.
Bitcoin is doing what it’s done best over the last decade and continuing to climb, despite skeptics, antics, and rhetoric.
While some traders are expecting price movement to retest the former resistance zone, there are signs suggesting a retrace into that zone may not be necessary in a bullish continuation. That said, the various technical details on Bitcoin at the moment seem to point everywhere but down.
The four-hour-charts, shown below, each suggest different possible price movement based on the timeframe analyzed. The first being a simple line chart, marking the price at closing value, along with the standard candlestick chart, highlighting the high, low, open and close of the given period.
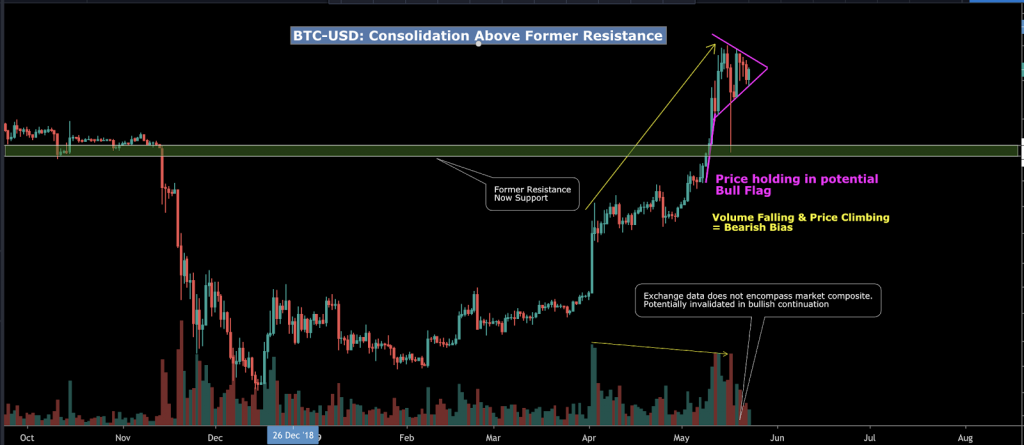
Notice the volume decreasing with price (red-lines) while the line chart confirms a consolidation attempt, known as a bull pennant/flag.
A bull-flag/bear flag, and a move to its respective direction, will illustrate a pole formation, with the attempt to consolidate afterward as the ’flag' as shown below.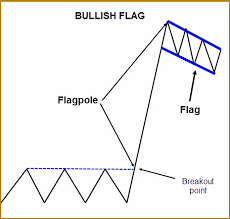
The bull pennant can still be invalidated with a price movement that breaks the lower trendline of the pennant and leaves the possibility that bitcoin can take a large swing downward in the event bears take control.
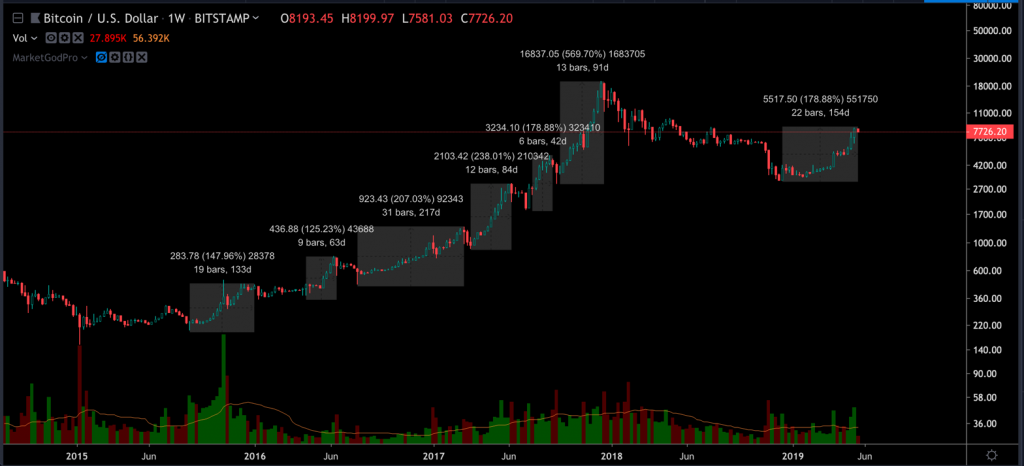
The most recent surge of late February-to-now appears to be in alignment with the previous swings in 2014 to 2017, in which the first two years of price movement to the upside consisted of 100–200 percent surges over 2–3 month periods. Under that logic, it would be entirely possible to see the $5,500 to $6,500 range tested again in the event the potential bull flag were to be invalidated. What to expect if the bull flag is invalidated can be read here.
On the fundamental side of things, the news on the upcoming ETF decision, JP Morgan Chase admitting to liking Bitcoin, and other initiatives like Hyperledger or Enterprise Ethereum from Amazon, are just a few highlights of steady progress.
Ultimately, any move from Bitcoin at these levels will be impressive. BTC dominance continues to grow. And, as the coin gets closer to the halving, based on previous halvings, it’s likely to see another jump in price.
For more in-depth analysis of Bitcoin price action subscribe to CryptoSlate Research, my go-to for both quick updates and in-depth reads.