Top 5 forecast: Bitcoin, Ethereum, XRP, Bitcoin Cash, and Litecoin technical analysis
Cover art/illustration via CryptoSlate. Image includes combined content which may include the use of AI tools.
After several weeks of bullish momentum, most of the top market cap cryptos are going through a period of consolidation. It’s unclear whether the market will pullback or experience new highs, and overall it seems wise to wait for confirmation before re-entering the market.
Bitcoin
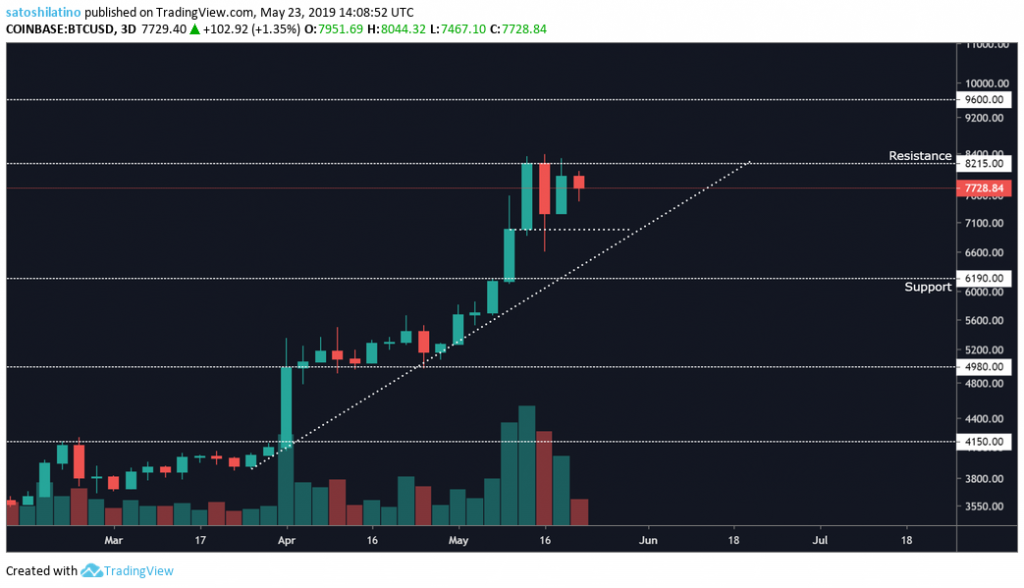
Over the last week, Bitcoin has been trading between $7,000 and $8,000, following a parabolic move since the beginning of April.
On the 3-day chart, the $8,200 resistance level has been holding the price of BTC from going higher. If this level breaks with significant volume it could take Bitcoin to new yearly highs, as it will try to test the $9,600 resistance point.
Although the bullish trend has been strong, it could be expected that Bitcoin will correct for a healthy continuation of the trend. Breaking below $7,000 could take this cryptocurrency to test the support trendline or even the $6,200 support level.
Therefore, based on the 3-day chart Bitcoin is in a $1,000 no-trade zone between $7,000 and $8,000. An impulse above or below this zone will determine where the price will go, either to test new yearly highs or to experience significant pullback.
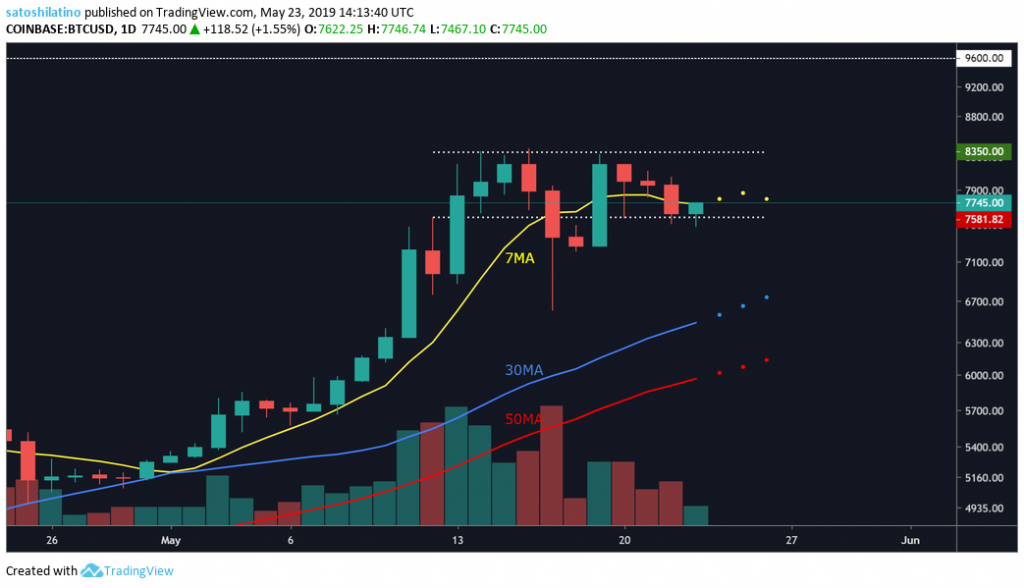
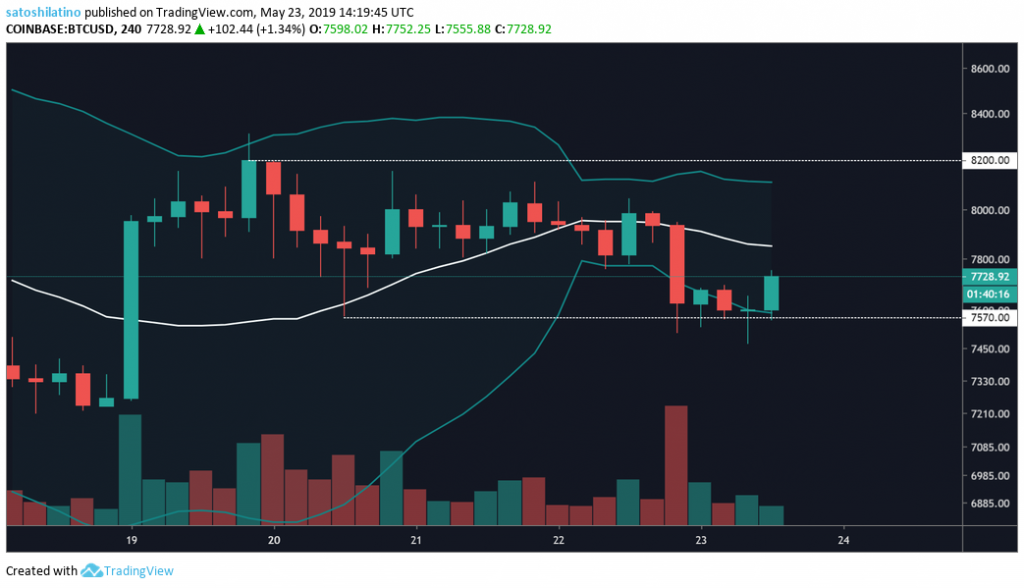
On the 1-day chart, the $7,600 support and the $8,350 resistance level are containing the price of BTC. Even though on Apr. 17 Bitcoin broke below this zone, two days later it came back inside it.
At the moment, it will be wiser to wait for confirmation before getting into a bullish or bearish trade.
To the downside, the next level of support given by the 1-day chart is around the 30-day MA, which is trading around $6,700.
To the upside, if Bitcoin is able to break above $8,350, the next level of resistance it will have to fight is around $9,600.
The Bollinger Bands on the 4-hour chart squeezed right before the price of BTC went down from around $8,000 to $7,600. Bitcoin’s market valuation has been able to stabilize around this area.
The next bullish or bearish impulse could be given by a break above or below the upper or lower Bollinger Band. Although BTC could move to the middle line (20 MA), it will be wiser to wait for a break above or below the bands, which will determine the direction of the price.
Ethereum
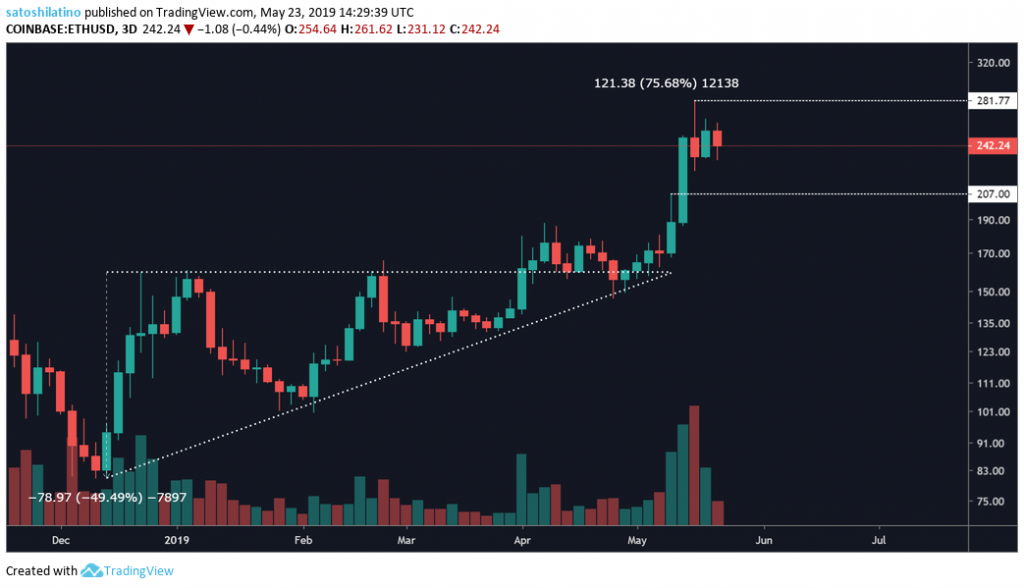
After breaking above the ascending triangle formation seen in the 3-day chart, Ethereum passed the 49.5 percent target given by the pattern by 26 percent, reaching a yearly high of $282.
Now, ETH seems to be consolidating before its next move. A pullback to $207 could be possible after the bullish momentum this cryptocurrency went through. However, if Ethereum is able to trade above $282 it could reach new yearly highs.
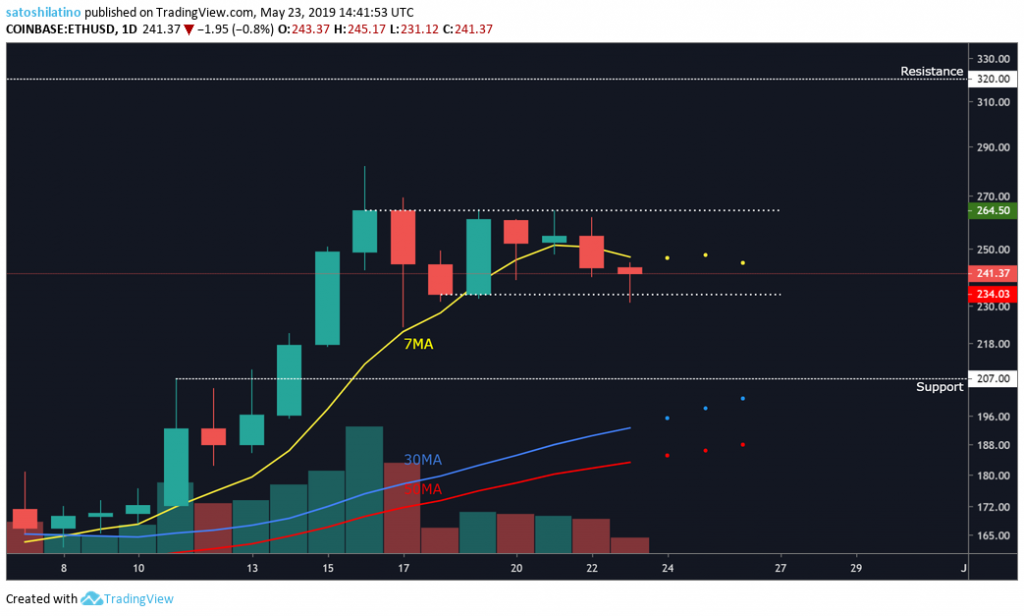
A $30 no-trade zone could be drawn on the 1-day chart between $264 and $234 since the price of Ethereum has been stuck within this range for the last week. A break above this zone could take ETH up to $320, but a break below it could take it down to $207 or where the 30-day moving average is trading.
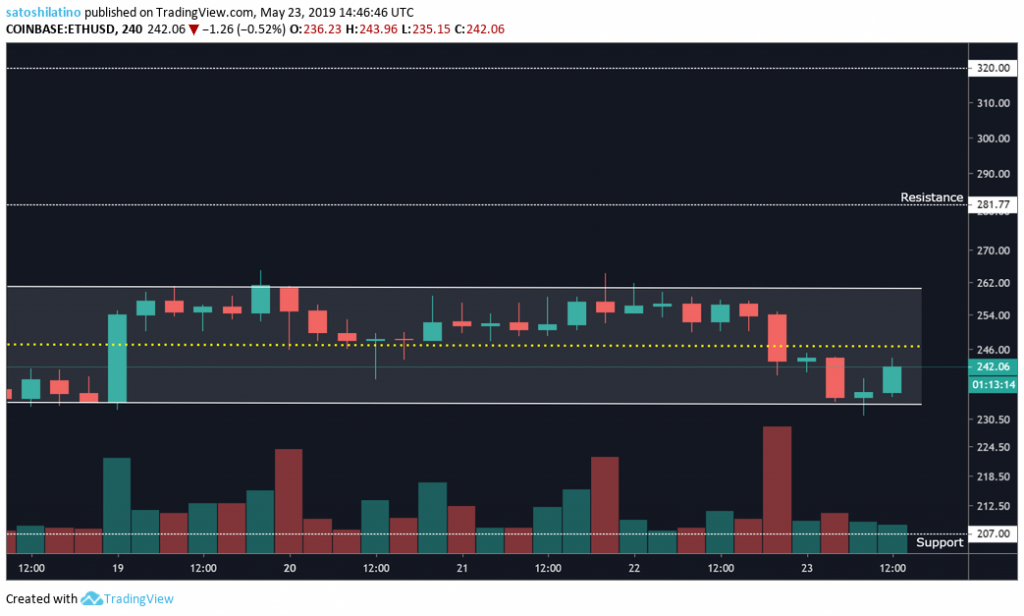
On the 4-hour chart, Ethereum can be seen trading inside a parallel channel since Apr. 18. Now that it has touched the bottom of the channel, a move to the middle or the top of the channel could be expected.
If ETH moves above the parallel channel, it could test the $282 resistance level once again. Nonetheless, a move below the channel could take it down to the $207 support level.
XRP
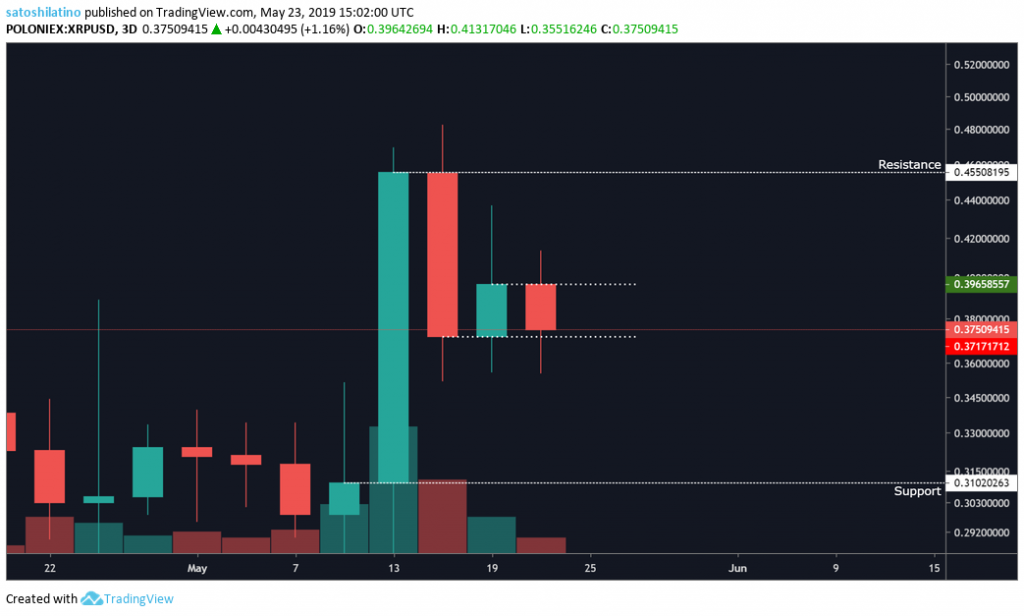
Over the last week, XRP has been trading between $0.4 and $0.37 for the most part. Although it has experienced certain spikes up and down, it goes back to trade within this range based on the 3-day chart.
If a 3-day candlestick trades above this zone, then XRP could go up to test the $0.45 resistance level. Conversely, a candlestick below this zone could take this crypto down to $0.31.
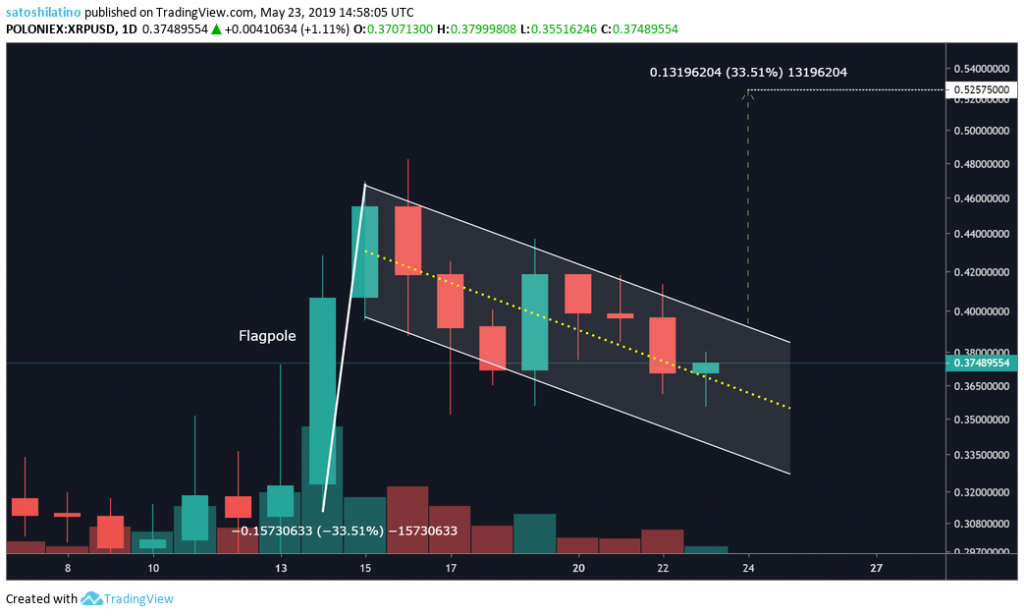
A bull flag has been forming on XRP’s 1-day chart. This pattern projects a target of 33.5 percent to the upside, which is given by the height of the flagpole, once the flag breaks. The pattern will be invalidated if XRP trades below $0.32.
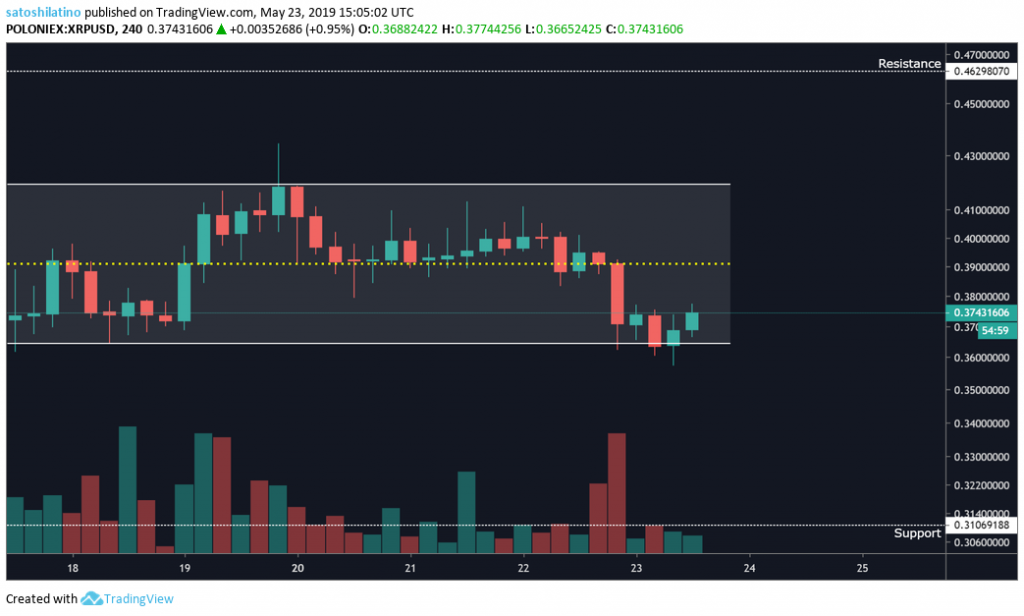
On the 4-hour chart, XRP can be seen trading within a parallel channel since Apr. 18. Now that it has reached the bottom of the channel, it could go up to the middle of the channel to around $0.39 before it consolidates, retraces to the bottom or goes up to the top at $0.42.
A bullish impulse could be seen if XRP is able to break above the channel, but it could go through a bearish movement if it breaks below it.
Bitcoin Cash
Bitcoin Cash can be seen trading inside an ascending parallel channel since the middle of March. A move above the middle line or below the bottom of the channel will determine whether BCH will make new yearly highs or pullback to $260 or even lower.
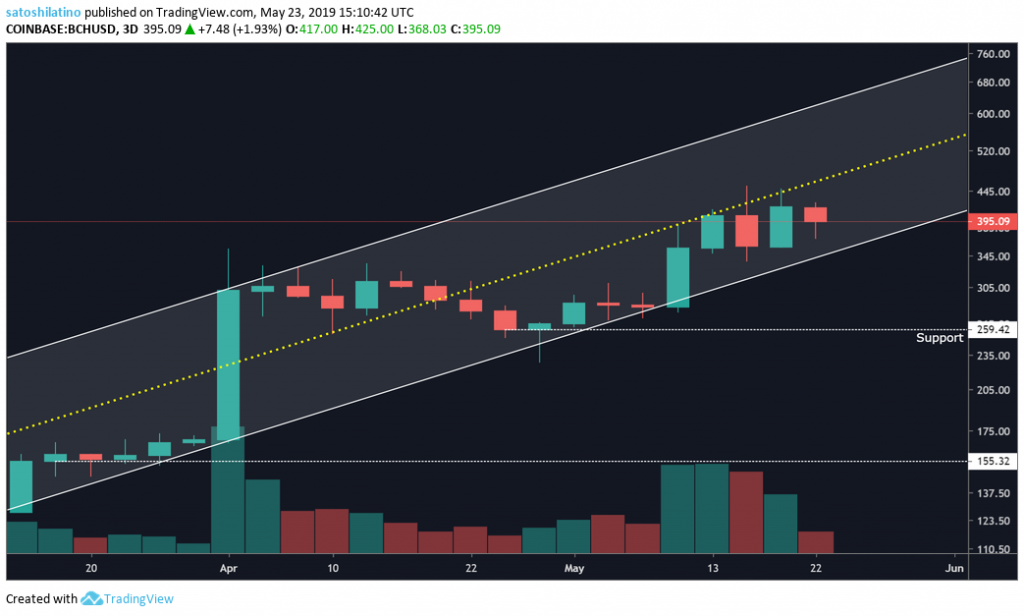
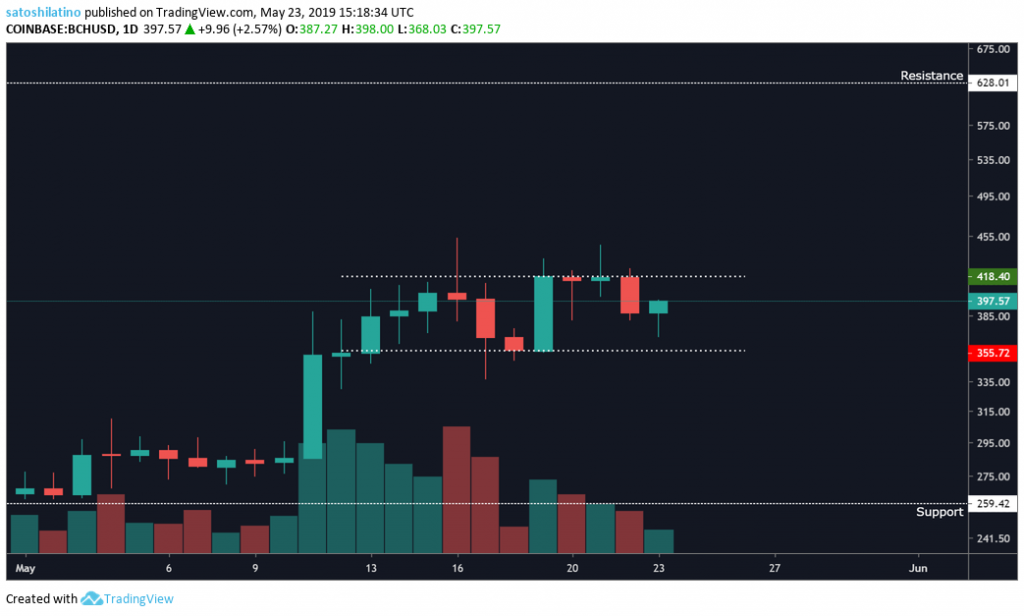
On the 1-day chart, Bitcoin Cash has been trading between $420 and $360. Breaking above this range could take BCH as high as $630, but breaking below it could take this cryptocurrency down to $260. In the meantime, it will be wiser to wait for a break of this range before entering a trade.
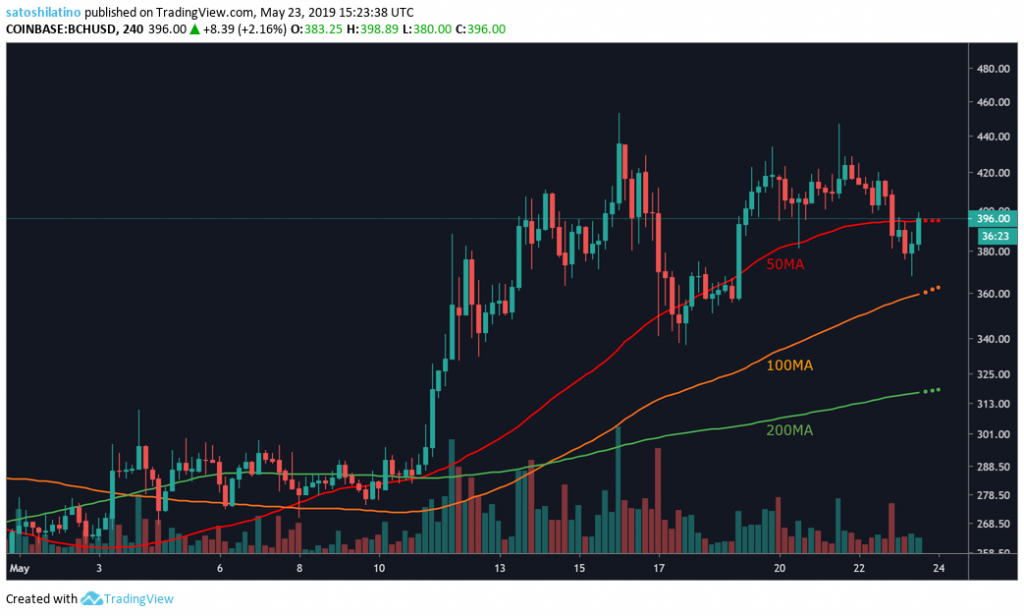
Since the beginning of May, Bitcoin Cash sits above the 50 moving average on the 4-hour chart. Although it has moved below it on different occasions, BCH goes back above it within a matter of hours.
If this cryptocurrency keeps trading above the 50 MA it will continue the bullish trend it has been going through. A move below this moving average could take it down to the 100 MA or even the 200 MA.
Litecoin
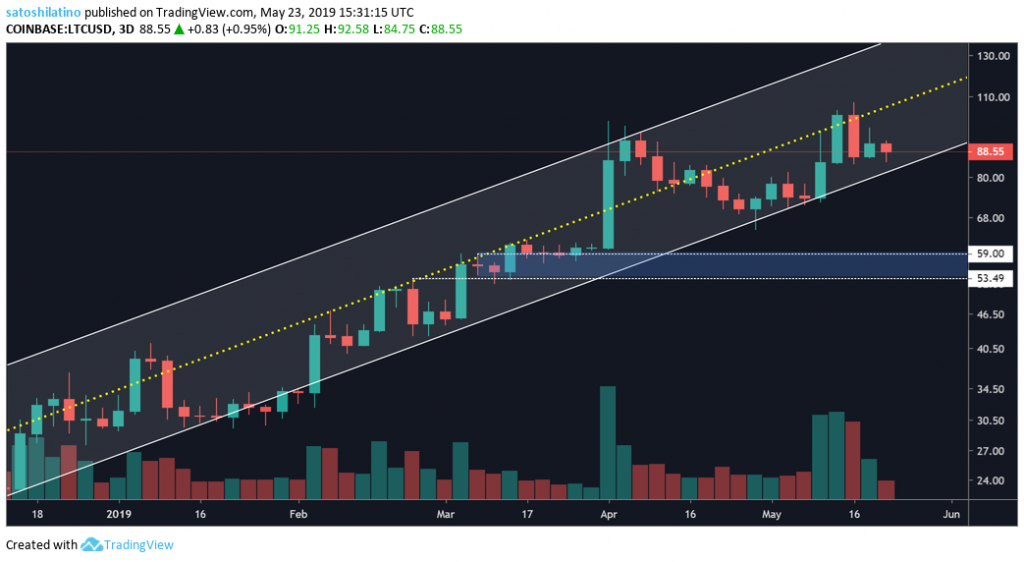
Litecoin has been steadily increasing its market valuation since Dec. 2018, when it reached a low of $22. As a matter of fact, an ascending parallel channel can be drawn since that moment up to now on the 3-day chart.
Currently, LTC is trading at the bottom of the channel, but if it continues to rise it may encounter some resistance against the middle line of the channel. A move above the middle line of the parallel channel could take it to new yearly highs. On the other hand, a break below the channel could take Litecoin down to around $60 to $54.
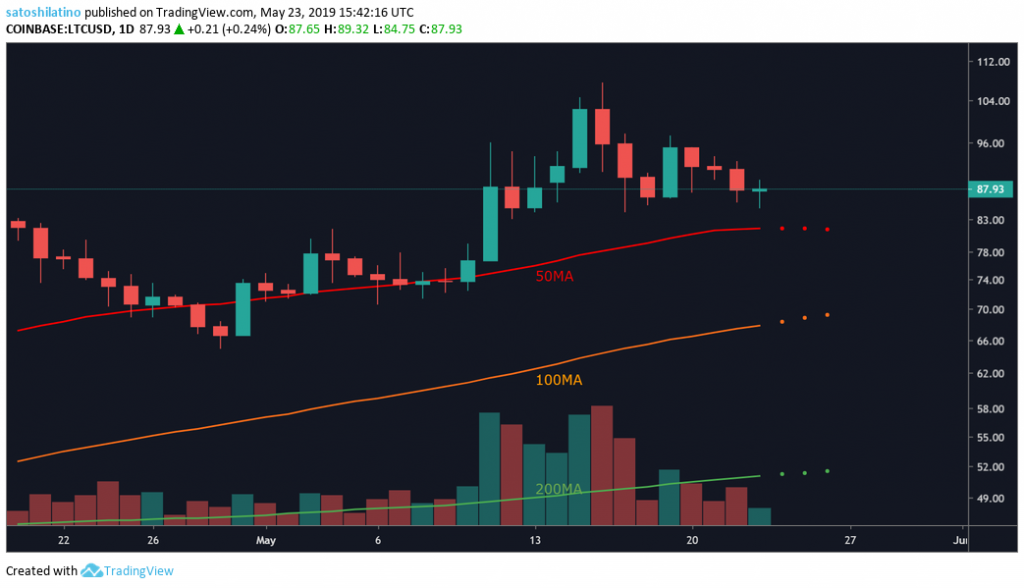
On the 1-day chart, Litecoin has been trading above the 50-day moving average. If it remains above this moving average, the bullish trend could continue. However, if it moves below the 50-day MA it could test the 100 or 200-day MA, sitting at $70 and $52 respectively.
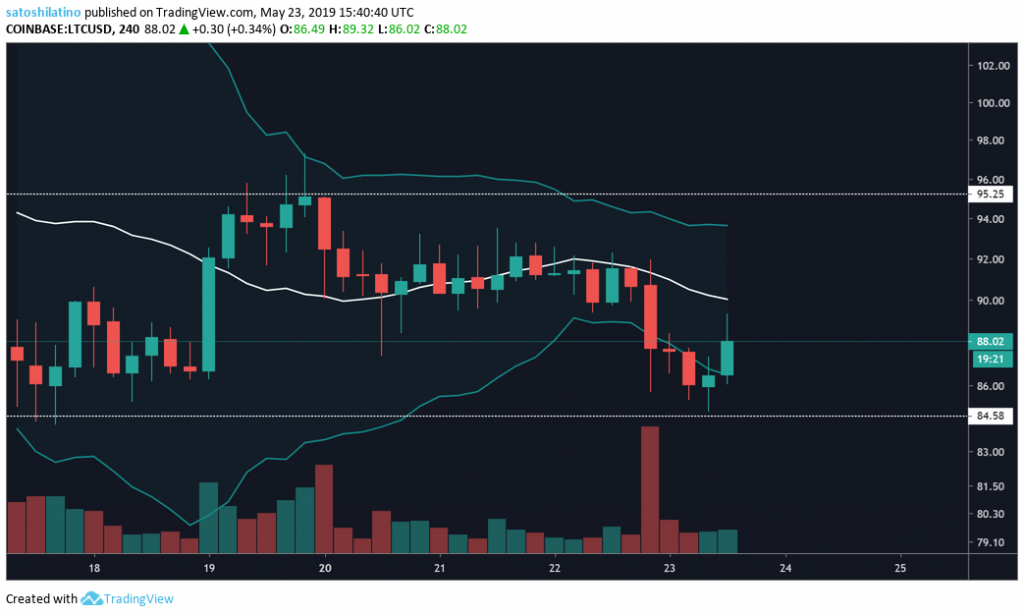
On the 4-hour chart, the Bollinger Bands could determine Litecoin’s next move. A clear break of the upper or lower band could take LTC to new highs or through a correction. Therefore, the important levels to watch out for are the $84.5 support and the $95 resistance.
Overall Sentiment
After the bullish momentum that most of the top cryptocurrencies by market cap have experienced, they all seem to be going through a consolidation period. It is unknown whether a pullback or new higher highs will come after this phase, but overall it seems like it will be wiser to wait for confirmation before expecting a bullish or bearish movement.