Bitcoin is one of the best-performing assets of 2019

Cover art/illustration via CryptoSlate. Image includes combined content which may include the use of AI tools.
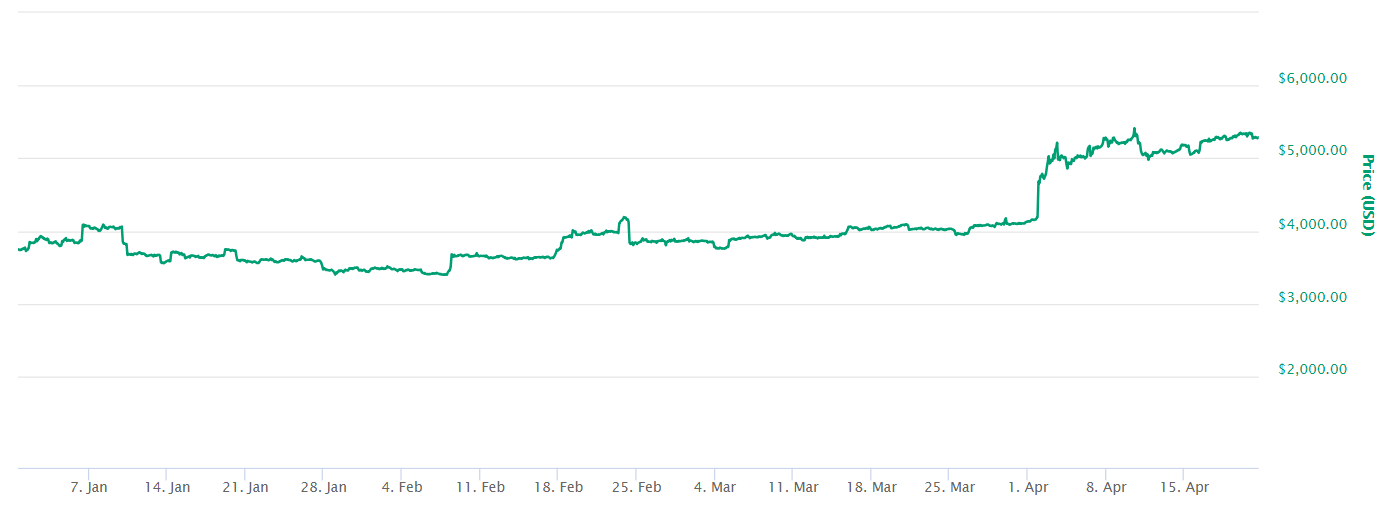
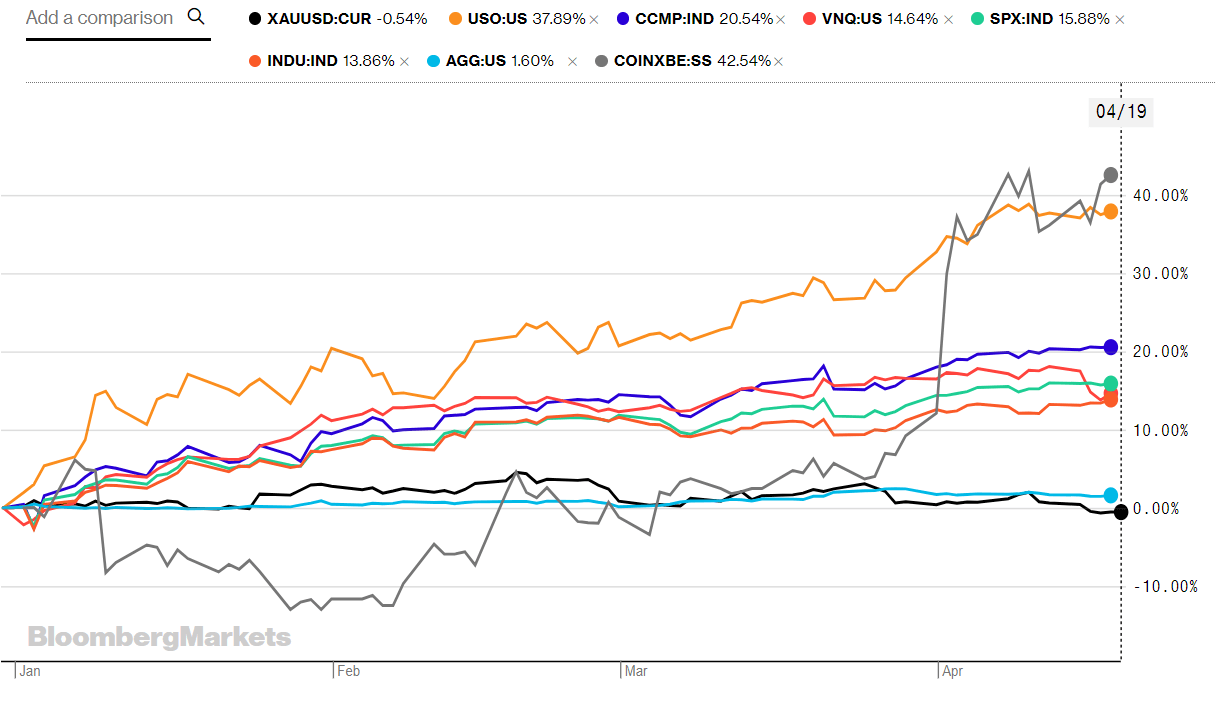
Since bitcoin’s epic rally in April, the cryptocurrency has recaptured its position as one of the best-performing assets in year-to-date yield. Currently, BTC is outperforming mainstream tradable assets—including the Nasdaq, S&P 500, real estate, oil, and gold.
Bitcoin Shows Outstanding YTD Performance
Bitcoin had an epic rally in the first week of April, surging from $4,130 to $5,300. Since the rally, BTC has remained in a range between $4,800 and $5,300. Considering BTC began the year at $3,760, the asset has demonstrated outstanding YTD growth with returns of over 40 percent.
The following article will chart the price of bitcoin against other top-performing assets YTD, including stocks, bonds, real estate, and gold, in order of performance.
Rising Oil Prices
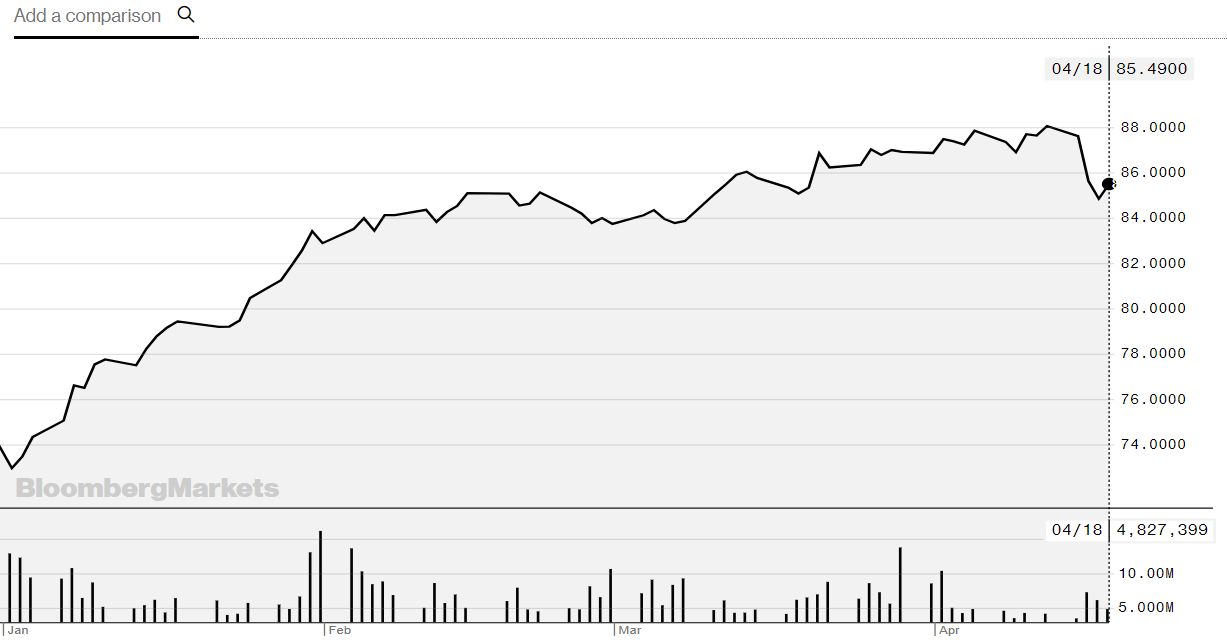
This year oil has been a top-performing asset. The performance of oil companies in the sector has largely been influenced by the rising cost of oil—with one barrel going from $46.3 to $63.4 according to the WTI Crude Oil Spot Price, up 37 percent since the beginning of the year.
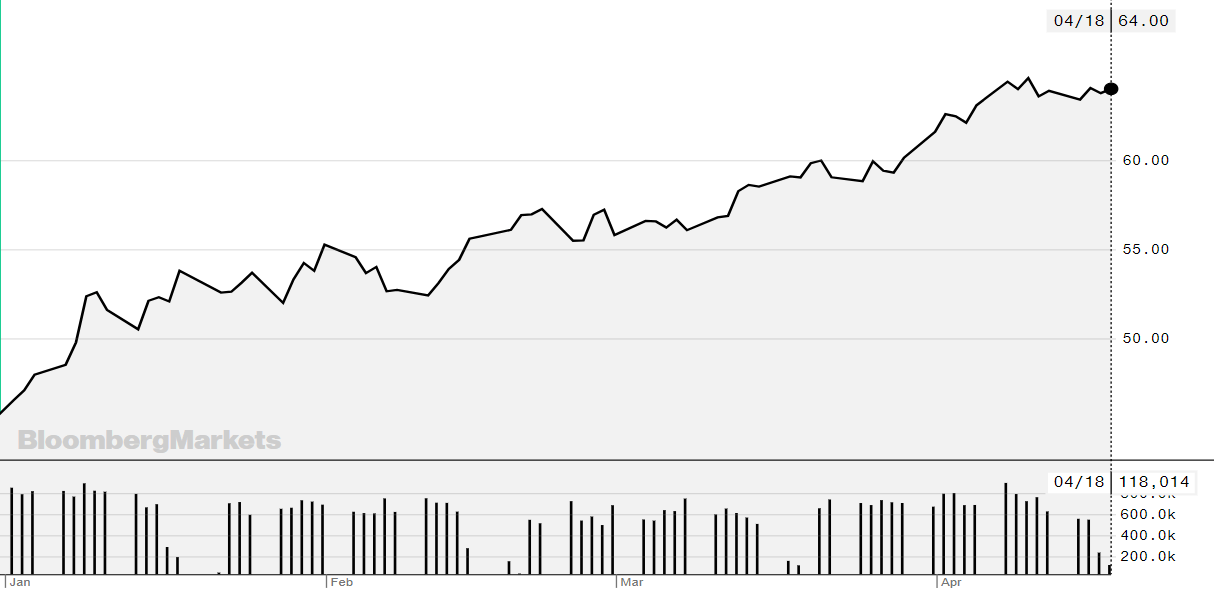
Oil prices have been at historical lows following a drop in prices in 2014. Experts attribute low prices to a combination of factors, including record oil output in the United States stemming from fracking, high output in Saudi Arabia, waning global economic growth and a strong US dollar—which makes oil more expensive in other countries—converging to create a decrease in demand and an increase in supply.
In 2019, according to CNBC, prices are once again rising due to better than expected demand, in conjunction with OPEC production cuts and tightening US sanctions on Iran and Venezuela. Consequently, those who purchased investments in oil have seen strong returns on their investments.
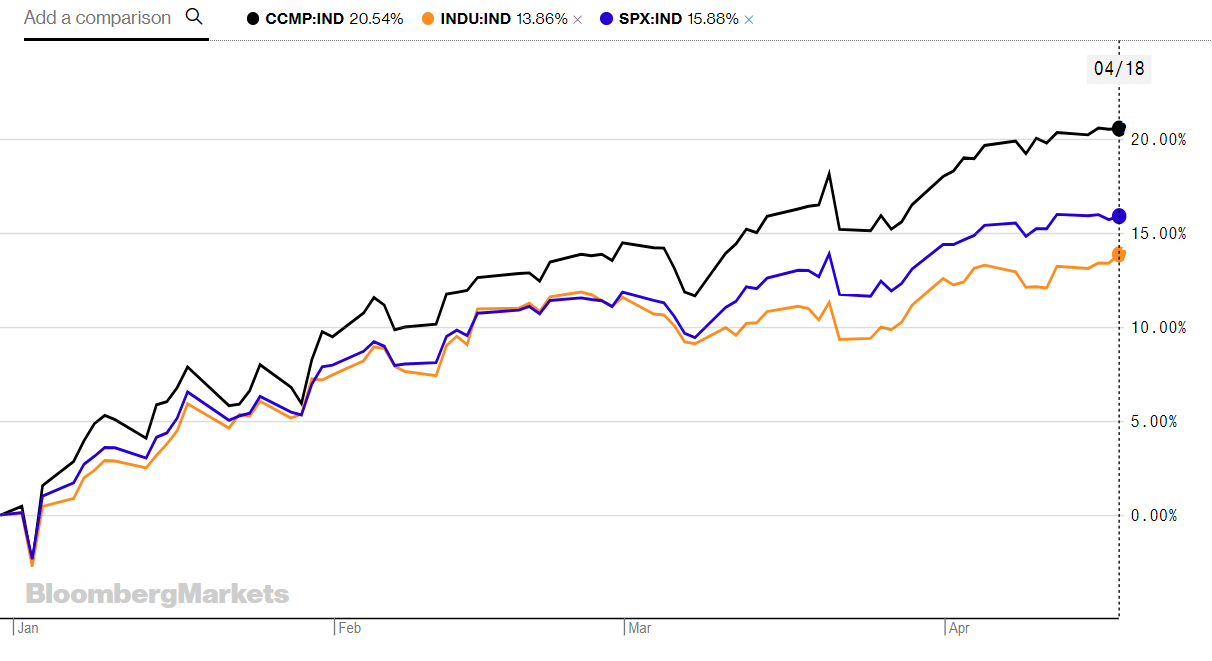
Stock Market Rallies after Christmas Crash
The three major indices—the Nasdaq, a composite weighted towards information technology companies; the S&P 500, an index based on the market capitalization of the 500 largest US companies; and the Dow Jones Industrial Average, a market index of 30 large well-recognized US companies—are all up double digits.
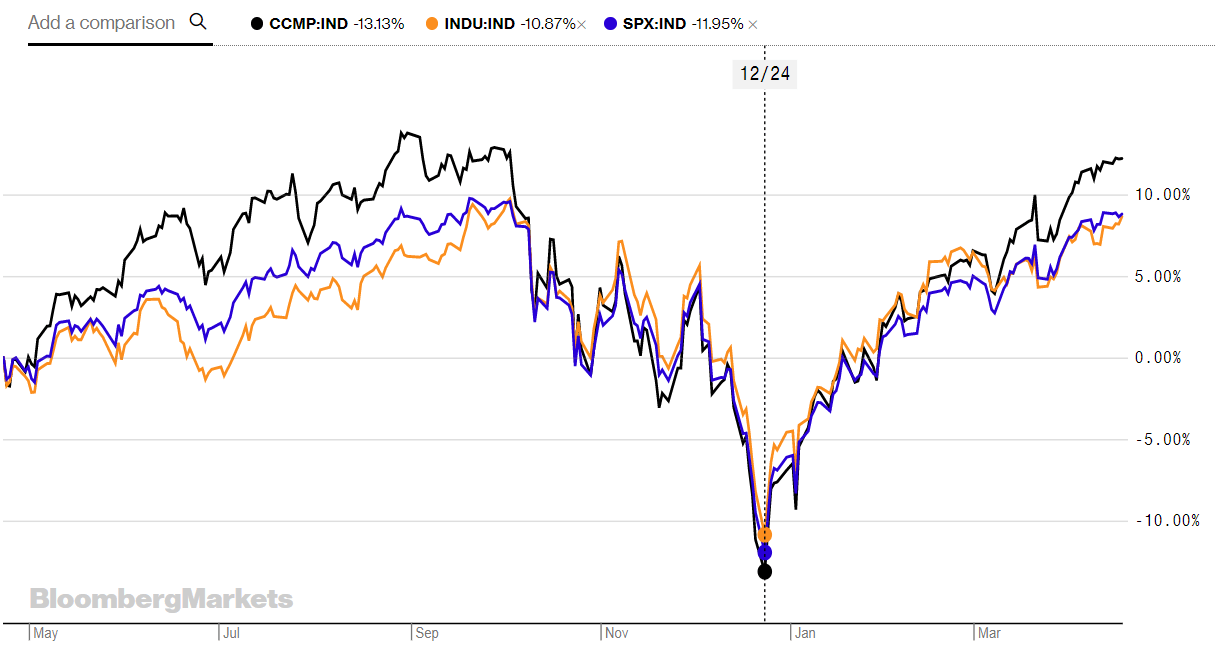
The exceptional performance of the stock market comes after a major rout on Christmas with all three indices losing ten or more percent. The sudden crash is attributed to forecasts of a worldwide economic slowdown from the Federal Reserve, IMF, and other major economic agencies—in conjunction with growing trade tensions between the US and China.
Year-to-date, the Nasdaq is up 20.5 percent, the Dow is up 13.9 percent, and the S&P is up 15.9 percent respectively.
Real Estate Shows Impressive Growth
Second to the Nasdaq, real estate indexes have also performed incredibly well. Investments by real estate investment trusts (REITs), which purchase income producing properties such as office buildings, hotels, and other real property have shown impressive growth.
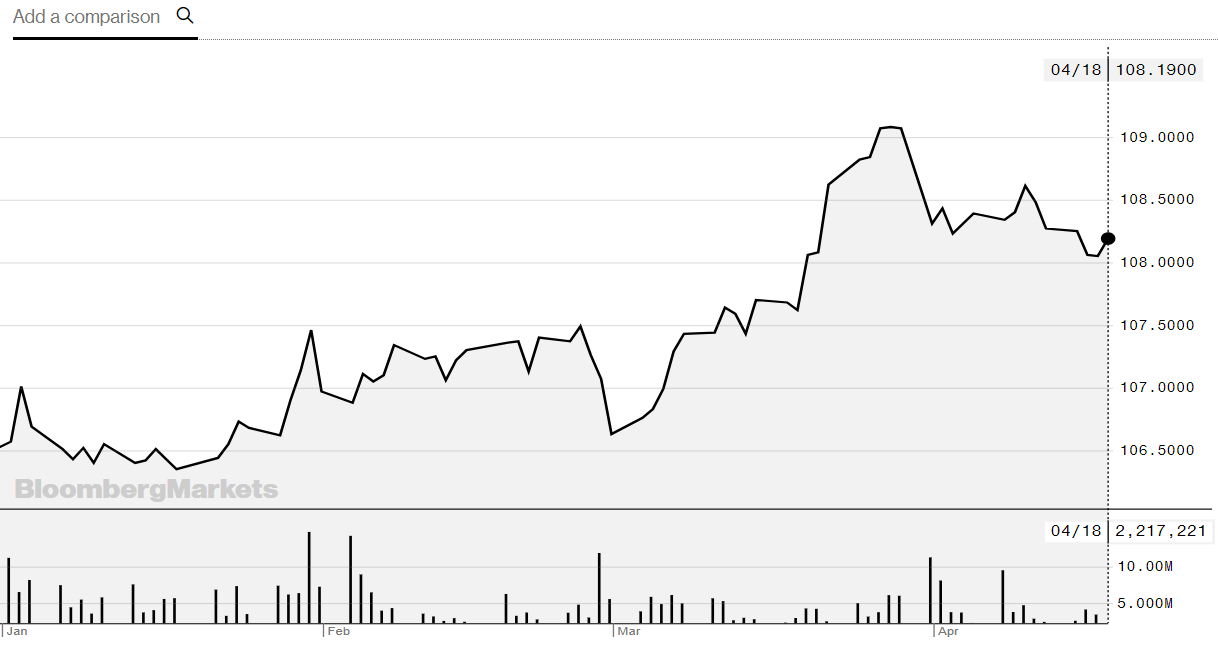
The Vanguard Real Estate ETF (VNQ) posted 17 percent YTD returns
Bonds Show Lackluster Performance
Bonds tend to be safer than stocks but offer lower returns. As a result, investors usually turn to bonds during times of low confidence in the economy. However, thus far it seems that the stock market has continued its trend of growth despite lackluster forecasts and an unnerving crash in December of 2018.
The iShares Core US Aggregate Bond ETF (AGG) attempts to track an index composed of the total US investment-grade bonds market. Since January, the AGG has posted 2 percent growth according to figures from Bloomberg.
Gold Underperforms
Meanwhile, bitcoin’s tangible competitor gold has underperformed since the beginning of 2019. Investors generally buy gold as a way of diversifying risk and to hedge against other assets in a portfolio with higher average yields but greater risk. Based on data from the last 10 years, on average, the price of gold increases by 4.8 percent per year.
For data year-to-date, gold has underperformed considerably based on the spot price of gold (ticker XAU):
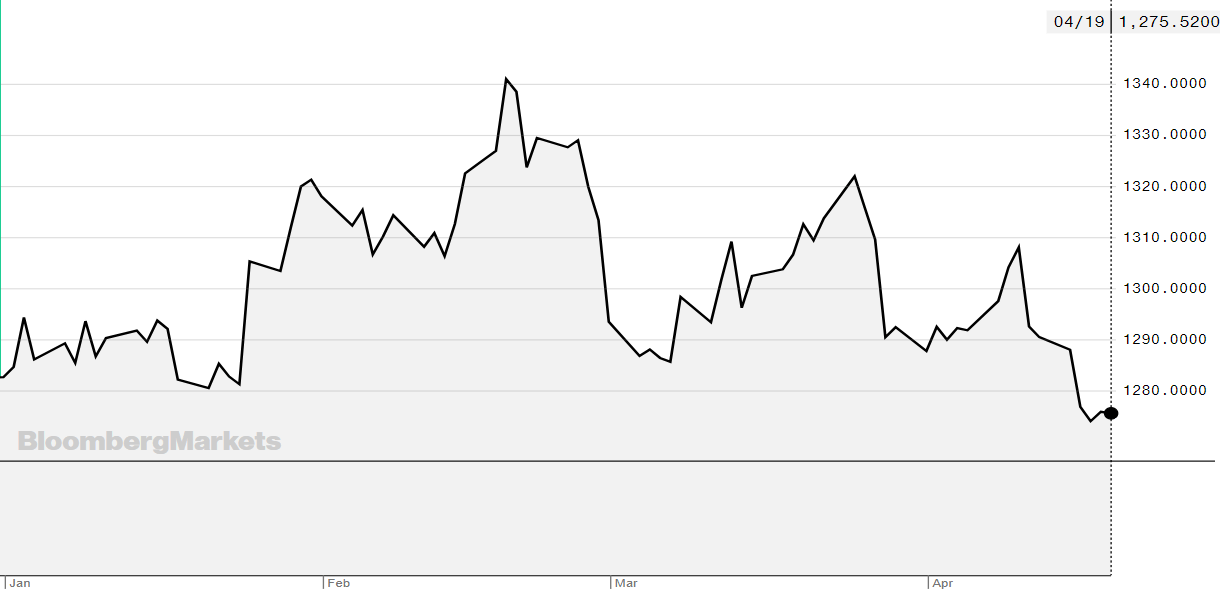
Since January, gold has yielded losses of 0.4 percent, a far cry from bitcoin’s 40 percent returns.
Performance Analysis
In aggregate, bitcoin rallied from one of the worst-performing assets of the year to one of the best-performing thanks to BTC’s astronomical rally in April:
Not only that, based on historical data bitcoin is the best performing asset of the decade. Just looking at annual lows starting from 2015, BTC has grown from—$185, to $365, to $780, to $3,200 in 2018.
However, BTC’s extreme volatility make it a risky investment for those who need reliable access to invested funds. Furthermore, the past performance of bitcoin does not necessarily hold true for predicting future returns. There are still a huge number of skeptics who believe that bitcoin is destined to fail or fall into irrelevancy.
That said, there is also a larger, much more vocal community that is confident that bitcoin will continue to grow, potentially becoming a new asset class like stocks and gold—only time can tell.