 Capital outflows, stablecoin drama and realized loses – new Glassnode data on a crazy week in crypto
 Capital outflows, stablecoin drama and realized loses – new Glassnode data on a crazy week in crypto
New Glassnode Insights help us explain what was one of the craziest week's of the year in crypto.

Cover art/illustration via CryptoSlate. Image includes combined content which may include AI-generated content.
This week’s on-chain data report by the analytics company Glassnode looks into three major events — the depegging of the USDC stablecoin, net capital outflows and futures open interest data.
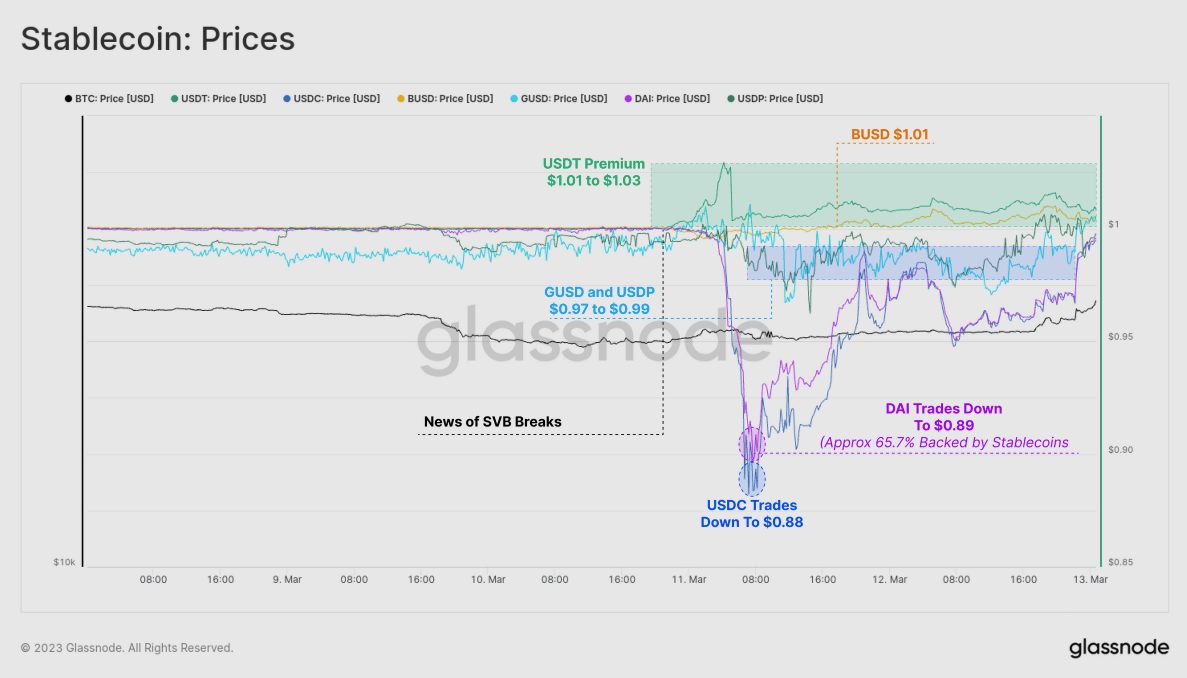
This has caused USDC and DAI to trade at lower values of $0.88 and $0.89 respectively. DAI’s value drop is because it is backed by stablecoin collateral of only about 65.7%. Gemini’s GUSD and Paxos’ USDP also dipped below their $1 peg, while BUSD and Tether traded at a premium.
Tether, in particular, traded at a premium between $1.01 and $1.03 during the weekend, which is ironic because it is seen as a safe haven in the face of potential risks in the heavily regulated US banking sector. This is the first time since the LUNA-UST project collapse that there has been volatility in stablecoin prices.
DAI / USDC
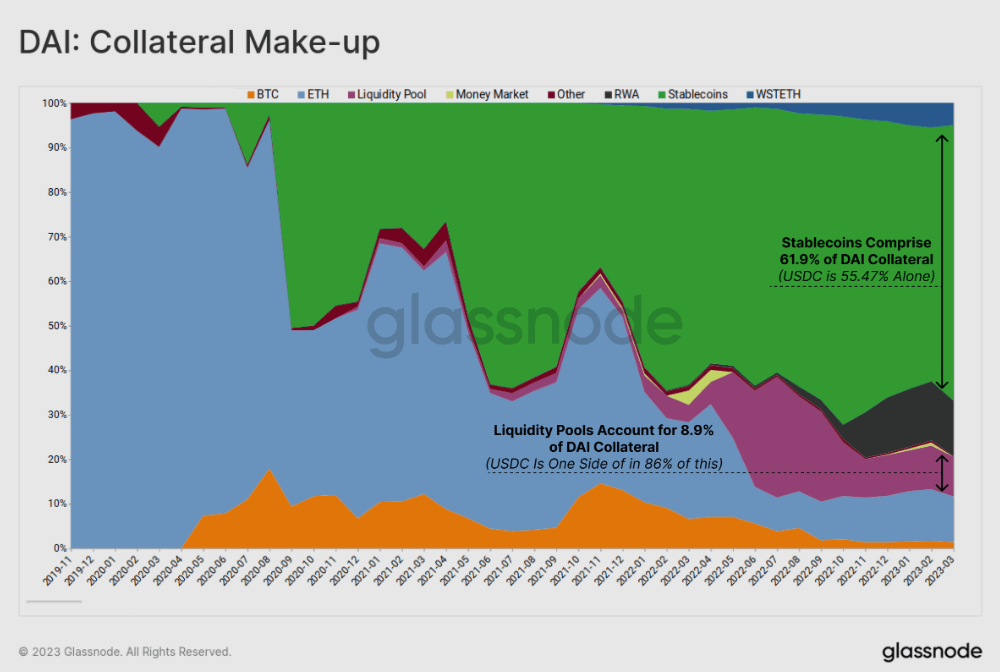
Stablecoins, particularly USDC, have become the primary form of collateral supporting DAI. This trend has been consistent since mid-2020, with USDC making up around 55.5% of direct collateral and a significant portion of Uniswap liquidity positions, totaling to about 63% of all collateral.
According to Glassnode data, dependence on stablecoins for collateral raises questions about the decentralized nature of DAI. This recent event highlights how DAI’s price is closely tied to the traditional banking system due to its collateral mix, which also includes 12.4% in tokenized real-world assets.
Tether USDT dominance
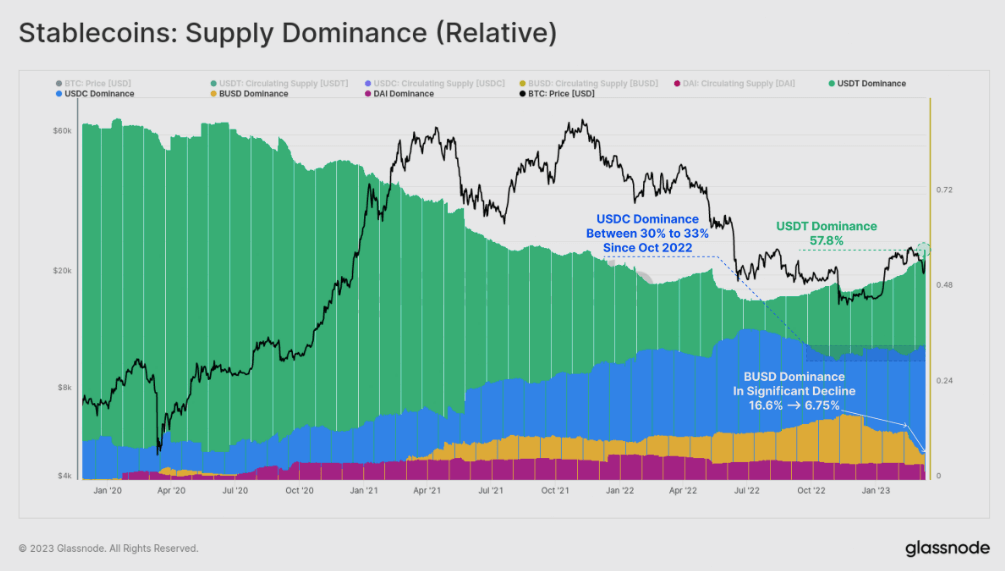
In mid-2022, Glassnode reported that Tether’s dominant position in the stablecoin market had been declining structurally since mid-2020. However, due to regulatory actions against BUSD and concerns regarding USDC stemming from its recent depegging, Tether’s dominance has rebounded to over 57.8%, it’s highest level in 18-months.
Since October 2022, USDC has maintained a dominant market share of between 30% and 33%. However, it remains to be seen whether its supply will decrease as the redemption window reopens on March 20. On the other hand, BUSD has experienced a significant decline in recent months, with issuer Paxos ceasing new minting, and its dominance falling from 16.6% in November to only 6.8% at present.
Aggregate Capital Outflows
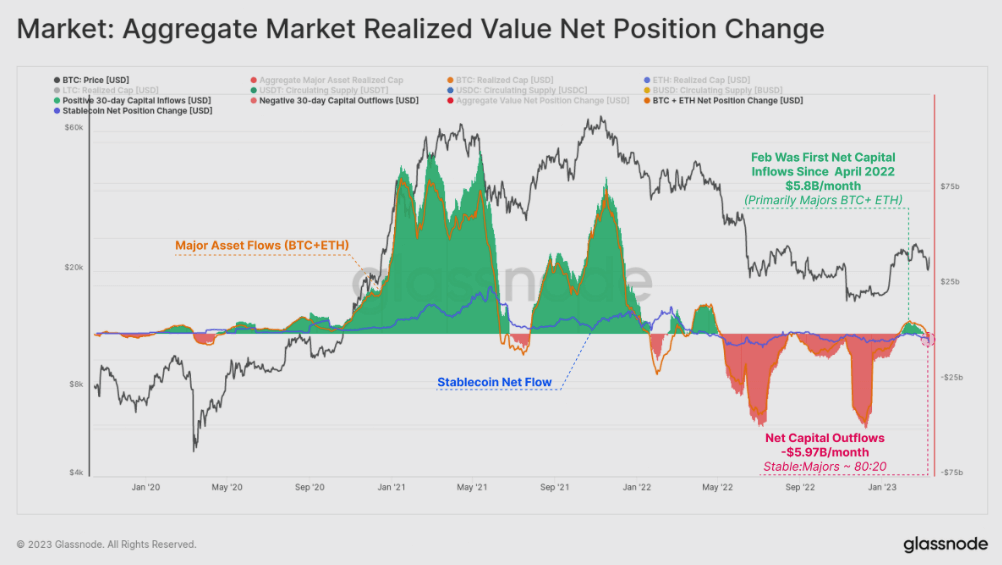
Estimation of the true capital inflows and outflows, Glassnode estimates that the last month, the market has seen a reversal outflow of -$5.97B, with 80% of that a result of stablecoin redemption (BUSD primarily), and 20% from realized losses across BTC and ETH.
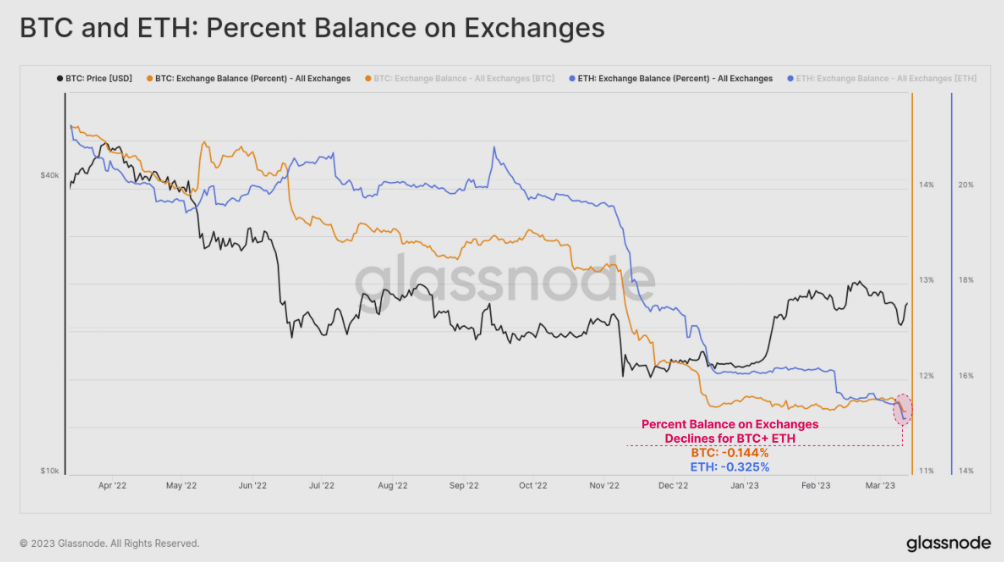
SVB fall out on percentage of BTC and ETH on exchanges
Approximately 0.144% of all BTC, and 0.325% all ETH in circulation was withdrawn from exchange reserves, demonstrating a similar self-custody response pattern to the FTX collapse. On a USD basis, the last month saw over $1.8B in combined BTC and ETH value flow out of exchanges.


 Farside Investors


 CoinGlass


