 This Ethereum data metric spiked before ETH peaked; here’s what it means
 This Ethereum data metric spiked before ETH peaked; here’s what it means

Photo by Adam Miller on Unsplash
Ethereum has been caught within a firm uptrend in recent times that has allowed it to gain some serious ground against Bitcoin in recent weeks.
This uptrend did show some signs of faltering yesterday, which came about alongside the decline seen by Bitcoin and the aggregated crypto market yesterday.
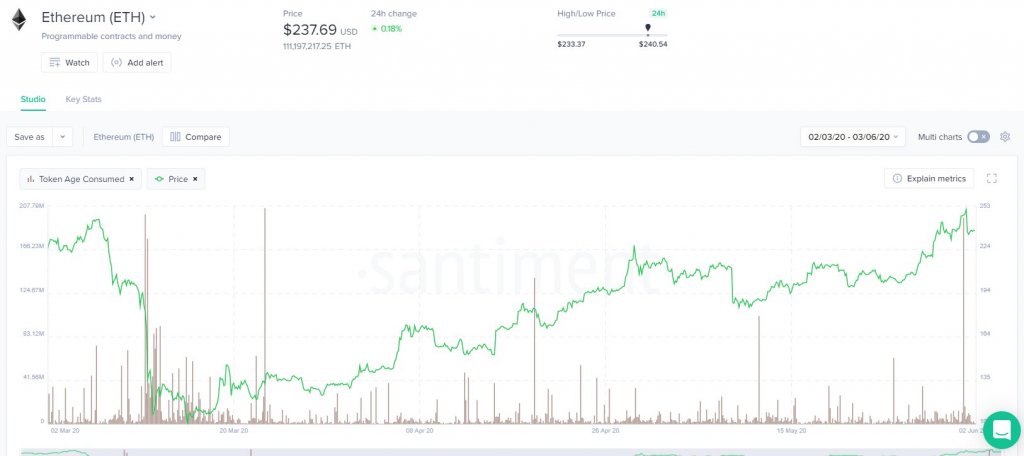
Right before ETH peaked, the Token Age Consumed metric spiked – signaling that a significant amount of the tokens moved addresses just prior to it plummeting.
This metric has since seen a sharp decline, and if history rhymes, this could mean it is poised to continue extending its newfound uptrend.
Ethereum’s technical strength mounts as it outperforms Bitcoin
Ethereum has shown some signs of strength in recent times, with it breaking its BTC trading pair’s downtrend last week when it rallied from lows of $205 to highs of $251.
ETH tapped these highs in tandem with Bitcoin rallying all the way up to highs of $10,400. Its subsequent decline from these highs led it to lows of $8,600, which is where buyers stepped up and propelled it higher.
Although the rejection at $10,000 did rock the entire crypto market, Ethereum appears to be trading quite well in the face of this turbulence
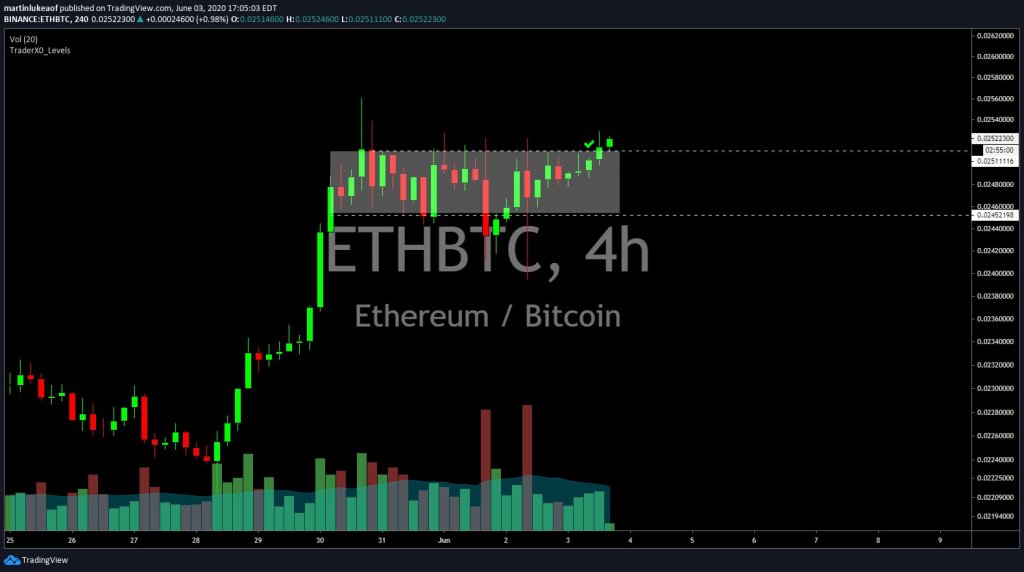
The crypto is now in the process of breaking out against its BTC trading pair, leading one respected analyst to note that he anticipates this trend to continue strong in the near-term.
Luke Martin – a trader and the host of the Coinist Podcast – spoke about this in a recent tweet, noting that it is breaking out of a consolidation range that it has been caught within over the past 5-days.
“ETH is breaking out of the range it’s been consolidating in for the past 5 days. Expecting continued outperformance.”

ETH’s Token Age Consumed metric paints a positive picture for its near-term outlook
Analytics firm Santiment pointed to an interesting trend in a post, explaining that the Token Age Consumed indicator spiked just before this rejection at $251 took place.
They explain that this metric gauges the amount of tokens changing wallets at a specific point of time, and the chart they offer seems to suggest that Ethereum typically sees uptrend continuance directly after the initial selloffs occur.
“This metric shows the amount of tokens changing addresses on a certain date, multiplied by the number of days since they last moved. In short, it’s an extremely solid way to identify price direction changes.”

This historically bullish pattern coupled with technical strength could provide Ethereum with a significant boost in the days and weeks ahead.


 Farside Investors


 CoinGlass


