


Technical Analysis: Bitcoin, Ethereum and Litecoin

Photo by Martin Sanchez on Unsplash
After cryptocurrency markets saw a total market capitalization drop from $800 billion to $300 billion, they have bounced back into the low $400 billion range. This article will discuss the current price of Bitcoin, Litecoin, and Ethereum through the lens of technical analysis.
Disclaimer: This article is not meant to constitute trading/investment advice. Please use extreme caution when trading any cryptocurrency.
Bitcoin
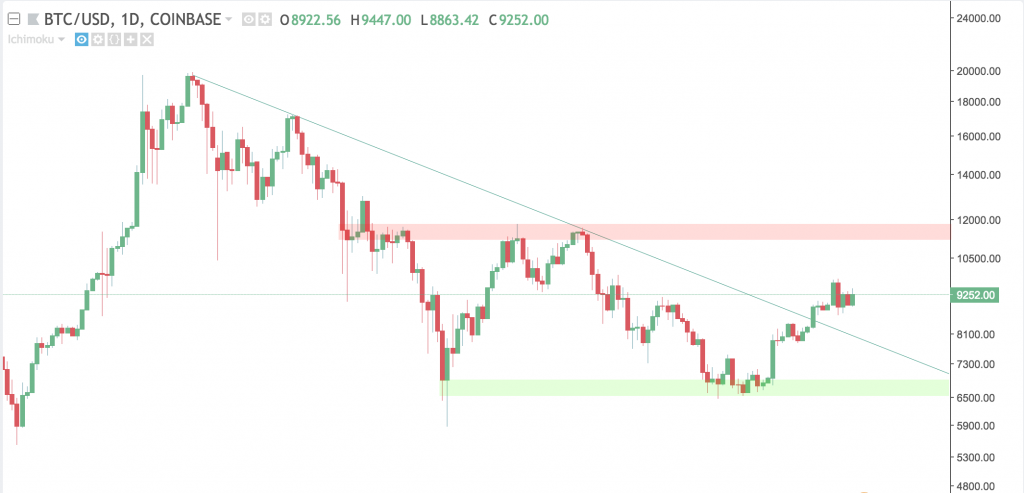
The current state of the BTC/USD pairing is relatively bullish. On the 1D chart, a significant downward trend since the all-time high of $19,800 has been broken as of mid-April.
There appears to be a support level around $6600, as we have successfully bounced off the area several times.
For resistance, Bitcoin's next major obstacle is the $11,500 area. There have been two recent bounces off the area in February and March. A definitive breakthrough of this level could indicate we are heading back to the all-time high.
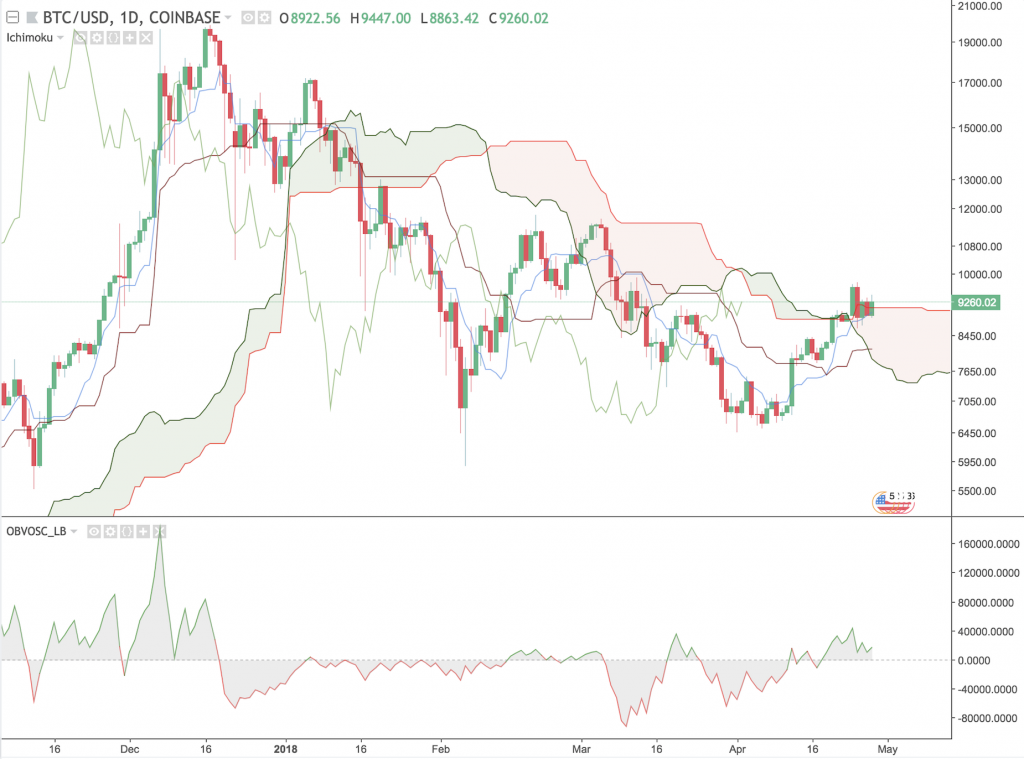
In order for a cloud break to be significant, we need three things:
- Definitive price breakout above the cloud
- Chikou Span above price and the cloud
- Bullish cloud with Senkou Span A over B
Depending on the action over the next few days, this could be a great trade opportunity.
Litecoin
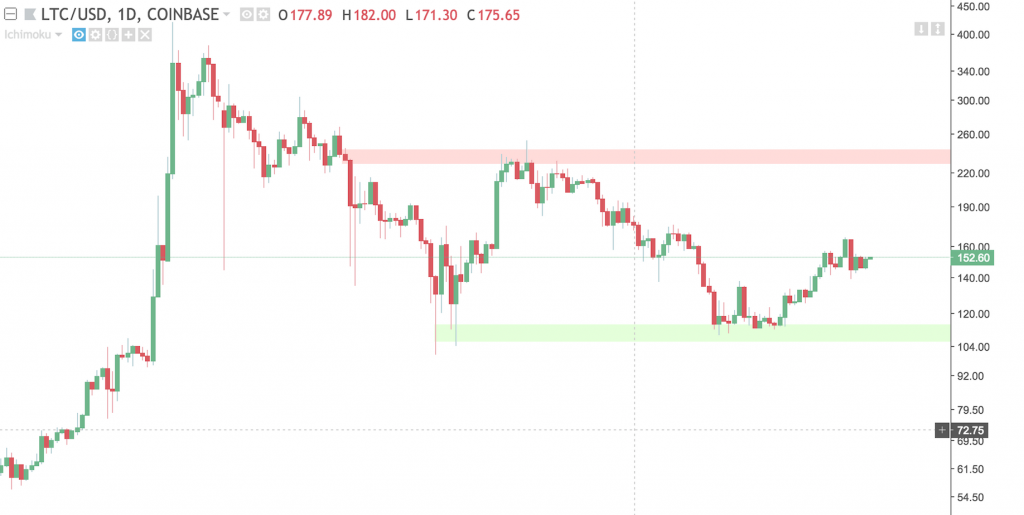
Litecoin, like most cryptocurrencies, typically follows Bitcoin’s trend, so their patterns are nearly identical.
On the 1D LTC/USD, we have horizontal support at $105 area and resistance at the $230 area. Depending on how cryptocurrency markets do these next few weeks, keep an eye out for bounces off either of these levels.
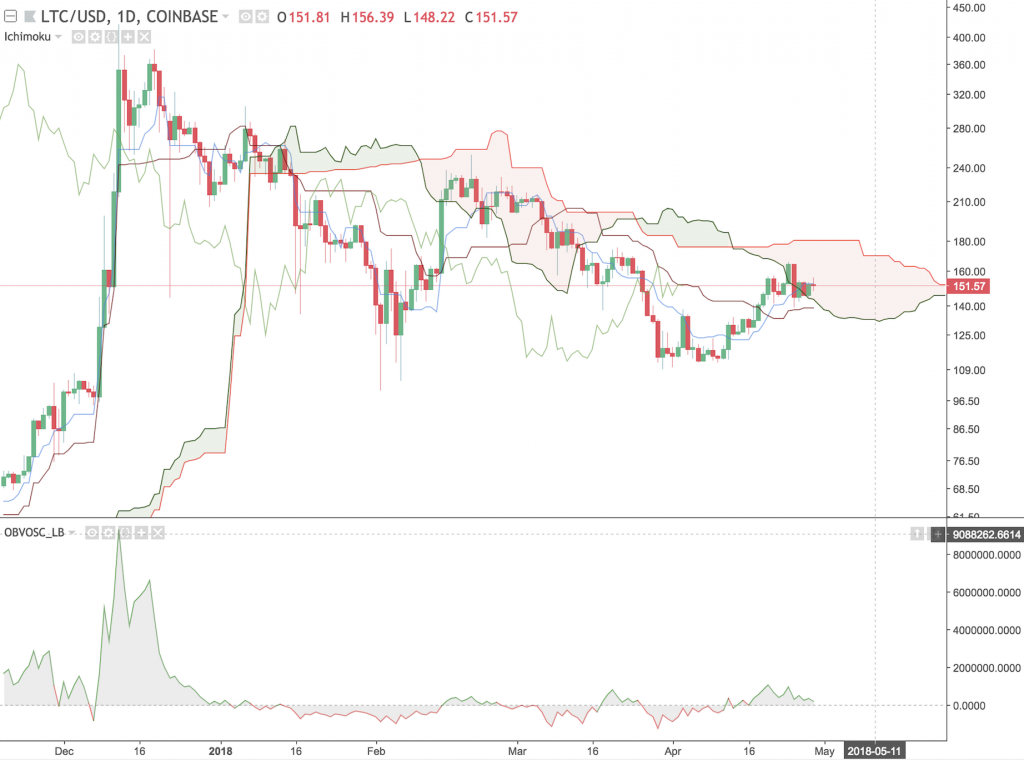
Just like the current Bitcoin situation, we need to see a definitive breakout from the cloud before we can think of entering the trade.
A large part of technical analysis is capitalizing on trends. Price inside of a cloud is a neutral signal and is difficult to capitalize on with a high rate of success.
Ethereum
There is a local support level in the $350 area and a strong resistance level around the $700 area.
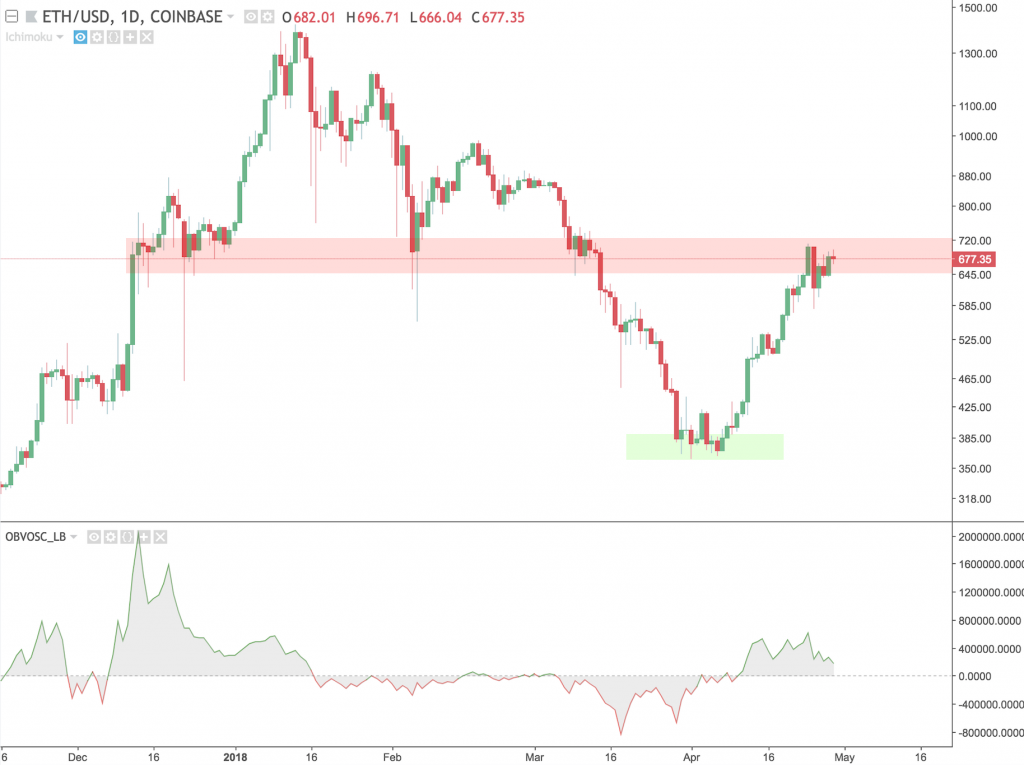
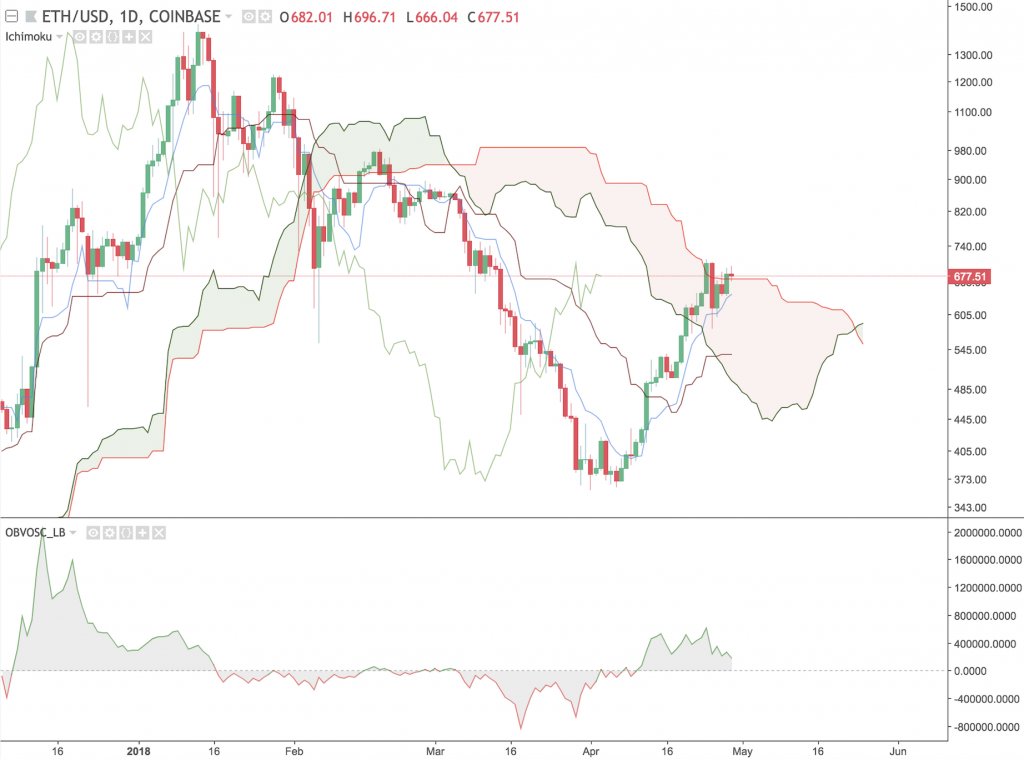
The cloud is skinny and recently “twisted bullish,” meaning a breakthrough could be on the way. The only thing missing from this being a great trade opportunity is a Chikou span above the cloud.
The Chikou Span is calculated by shifting the current price back x amount of periods. Given enough time, the Chikou Span can easily make a move above the cloud, which would cause me to take this trade.
Conclusions
There are no guarantees with technical analysis. A combination of technical and fundamental analysis should be used when making trades.
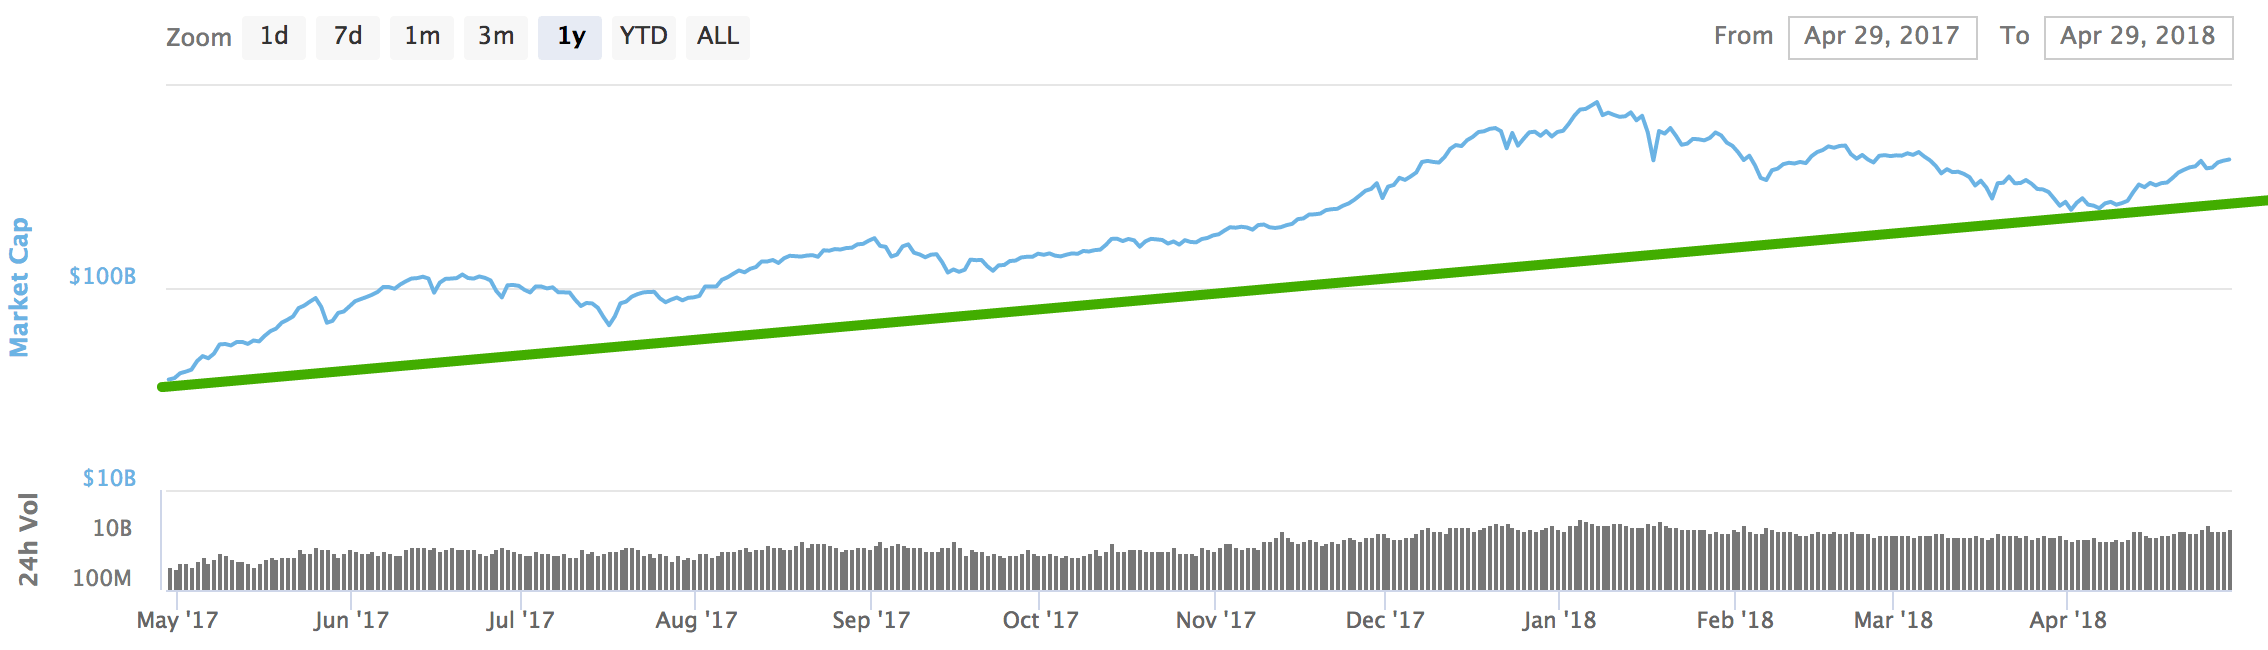
With the total cryptocurrency market cap back at $430 billion, the market is finally showing signs of life. A very conservative trend line can be drawn on the total cryptocurrency market cap indicating a clear upward trend.