Technical Analysis: Bitcoin, Ethereum, Bitcoin Cash, Litecoin and Ripple

Photo by Jeremy Thomas on Unsplash
Cryptocurrency markets continued the bullish trend this week with an almost $40 billion increase in market cap at one point. Over the weekend, however, a strong pullback occurred leaving the overall market cap around $430 billion. This week, we will use technical analysis to look into the current price action of Bitcoin, Litecoin, Ethereum, Bitcoin Cash, and Ripple.
Disclaimer: This article is not meant to constitute trading/investment advice. Please use extreme caution when trading any cryptocurrency.
Bitcoin (BTC)
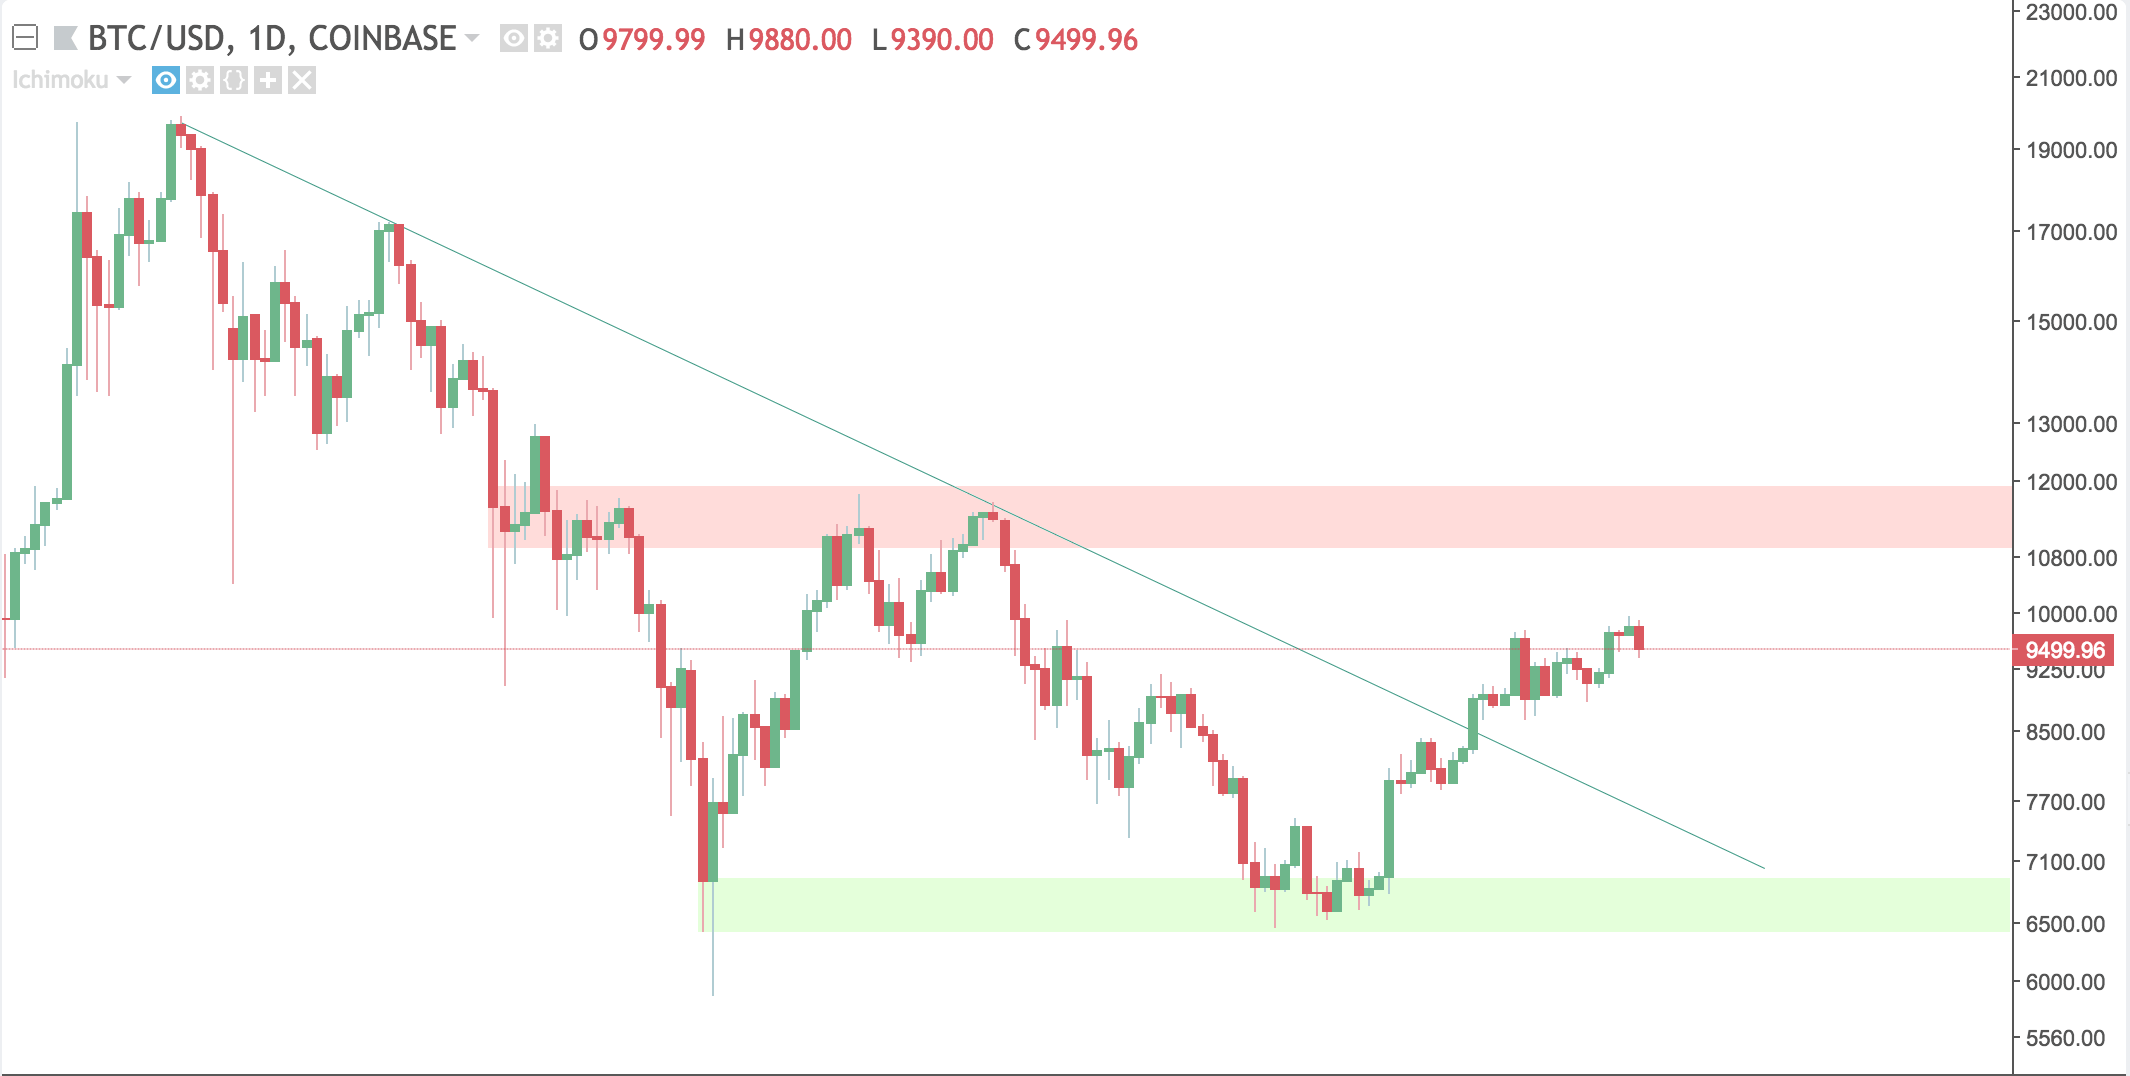
Bitcoin made a run for $10,000 but ran out of steam around the $9990 area.
In the short term, $10,000 will be a key resistance level, but if Bitcoin definitively breaks that level it looks to be on its way to the red resistance area. Using past information, the chart shows Bitcoin has rejected the red area several times.
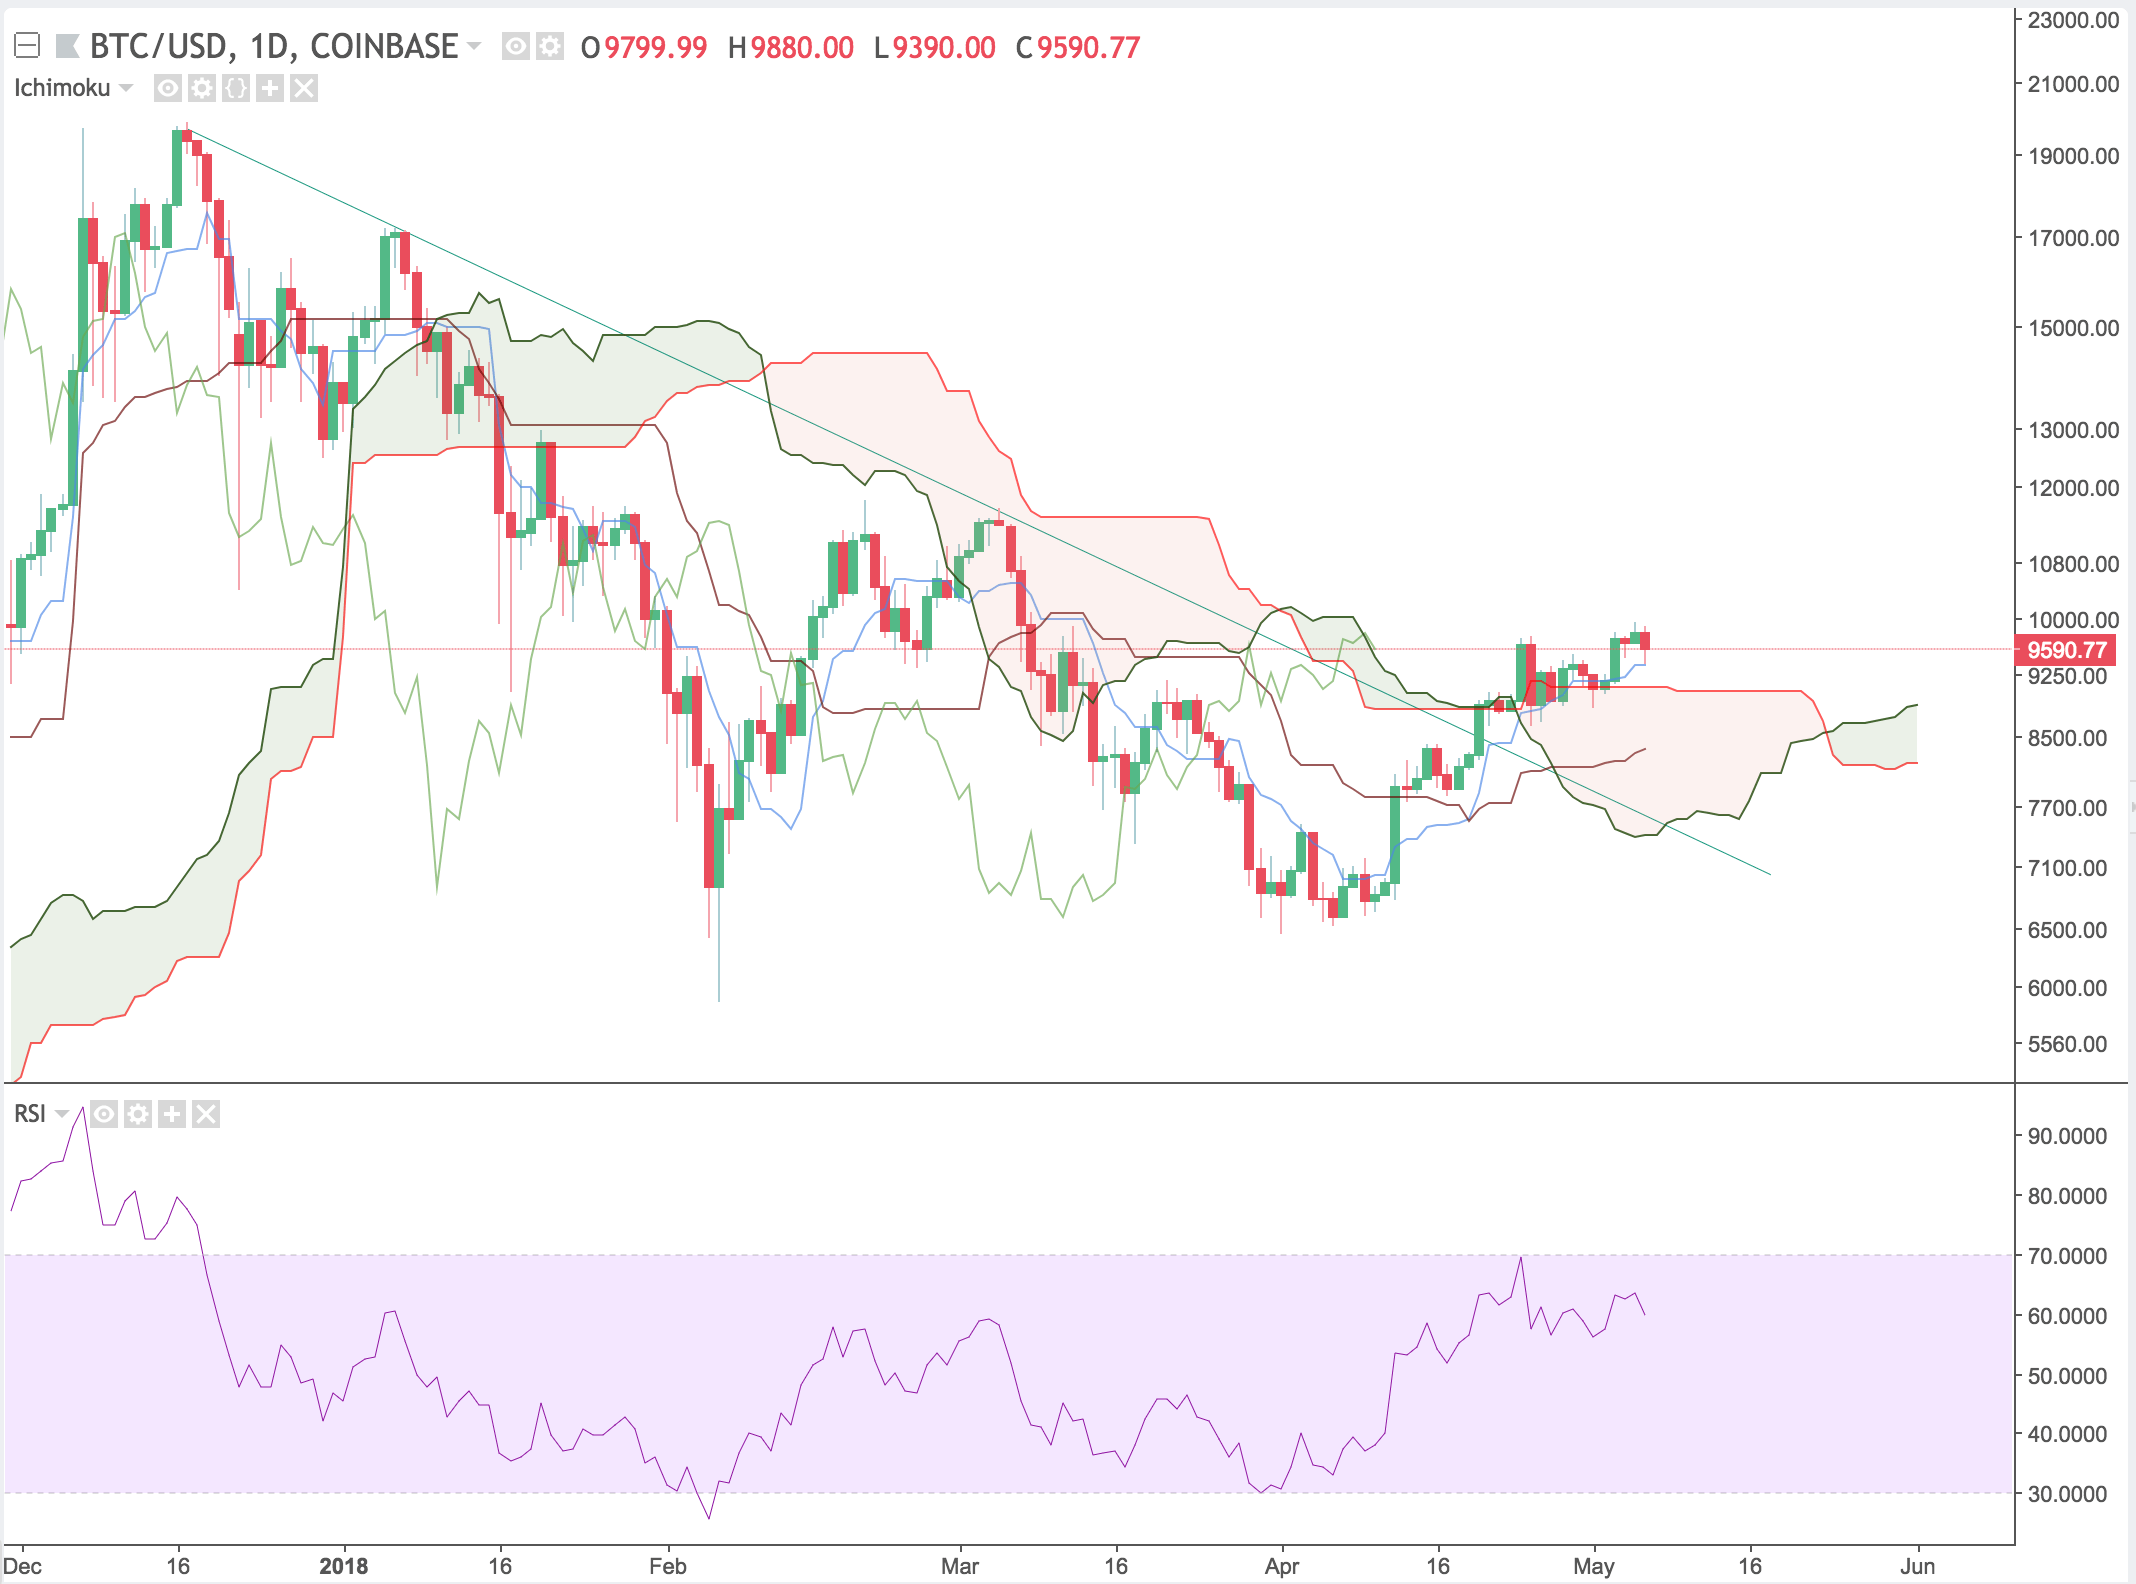
Using our indicators, we see a similar scenario to last week on the 1D BTC/USD chart. The lagging span is about to break out from the cloud, and the latest candle looks to be bouncing directly off the Tenkan-Sen. RSI is somewhat overbought, with slight bearish divergence.
Ethereum (ETH)
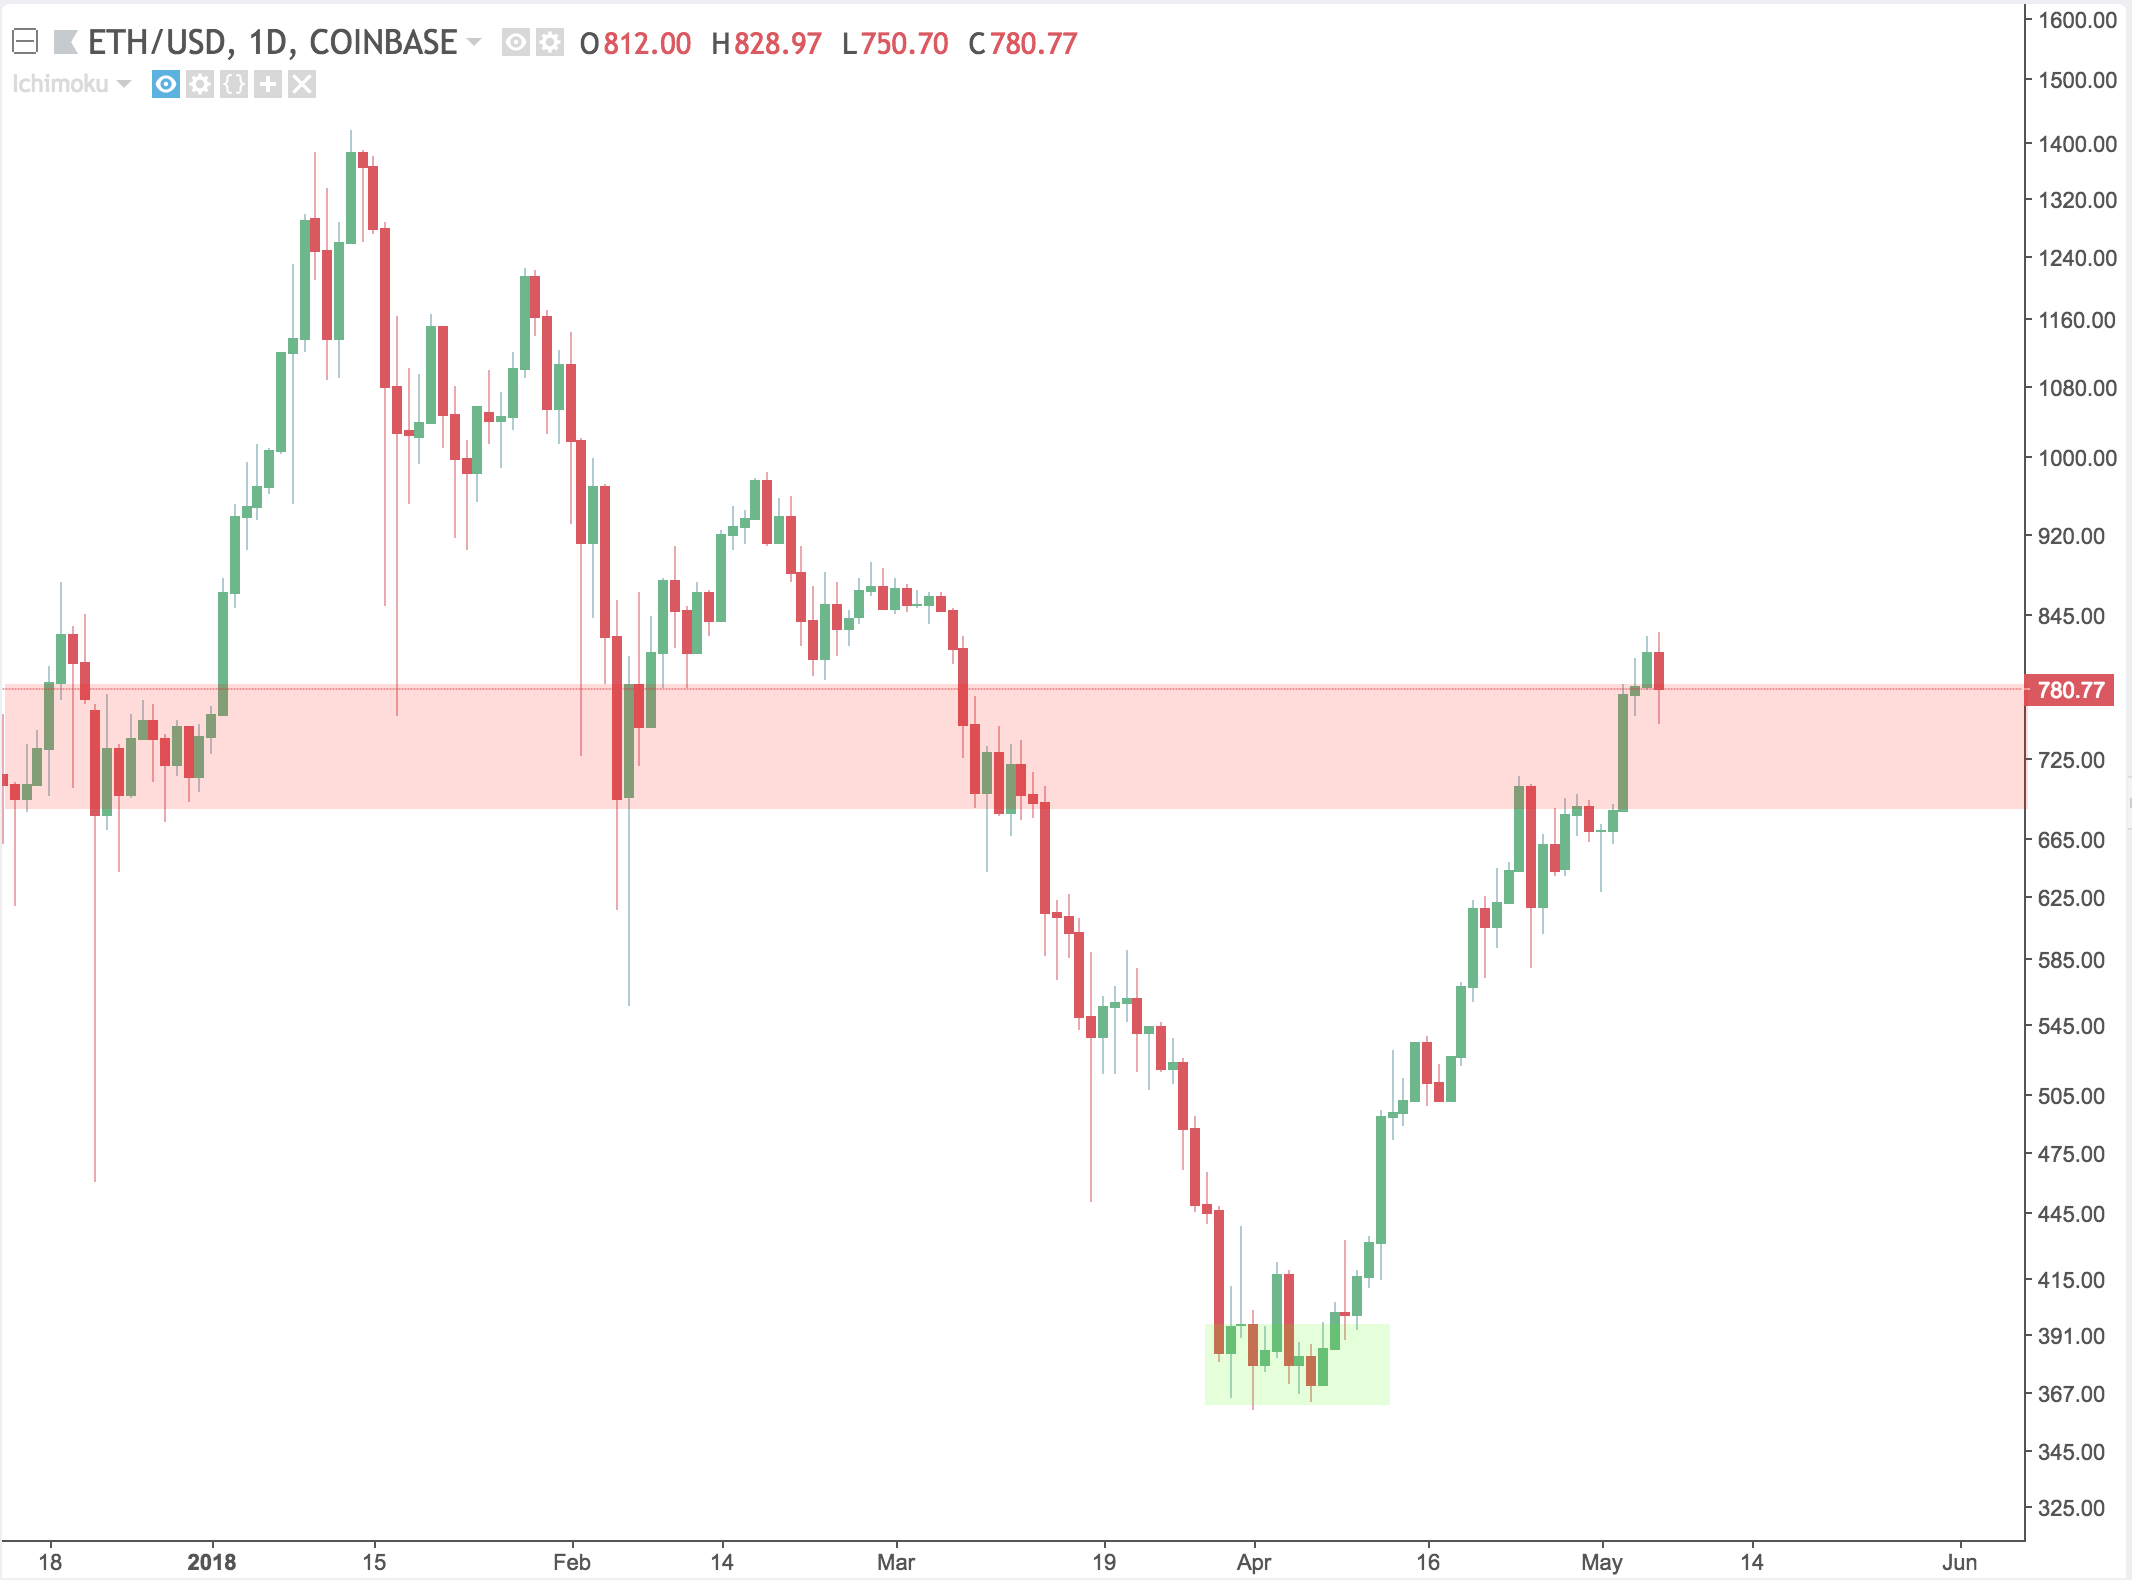
Ethereum blew right through the highlighted resistance level last week after breaking out of the cloud. This week, it sits on top of the level. After resistance levels are breached, they often turn into support levels. Keep an eye out for the price action over the next few weeks to look for bounces off the area.
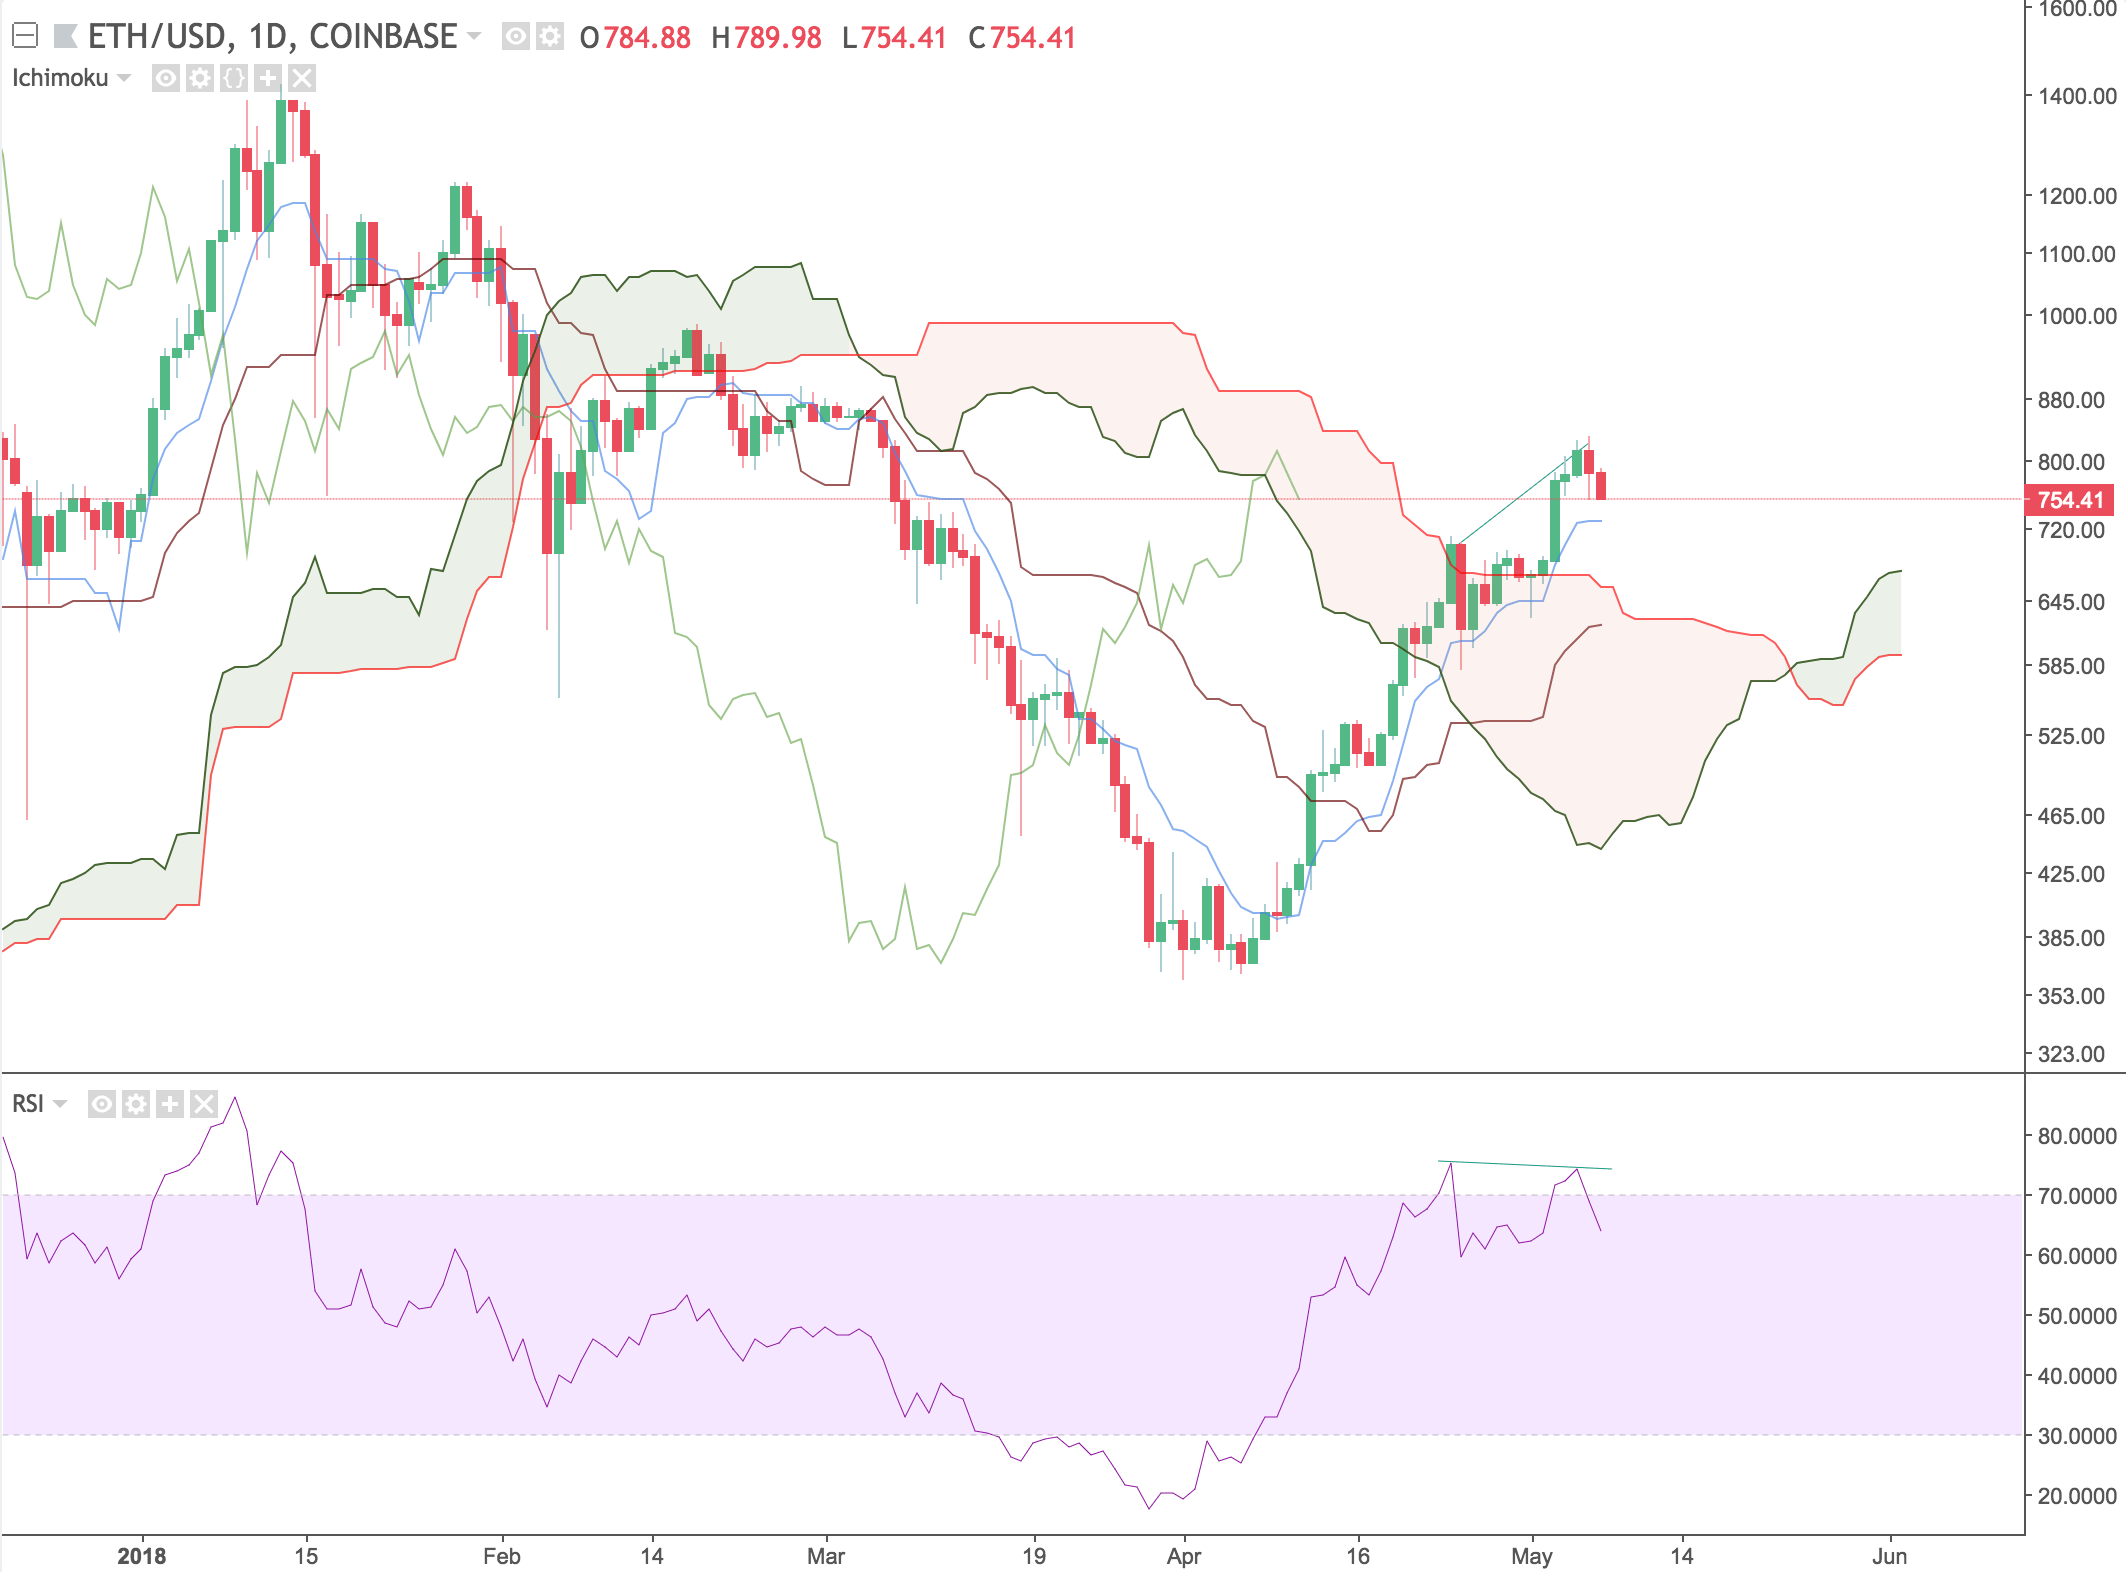
After making a major move out of the cloud, Ethereum is heading towards the Tenkan-Sen. The Tenkan-Sen was sloping upwards indicating high momentum in the market, but it is currently flattening out.
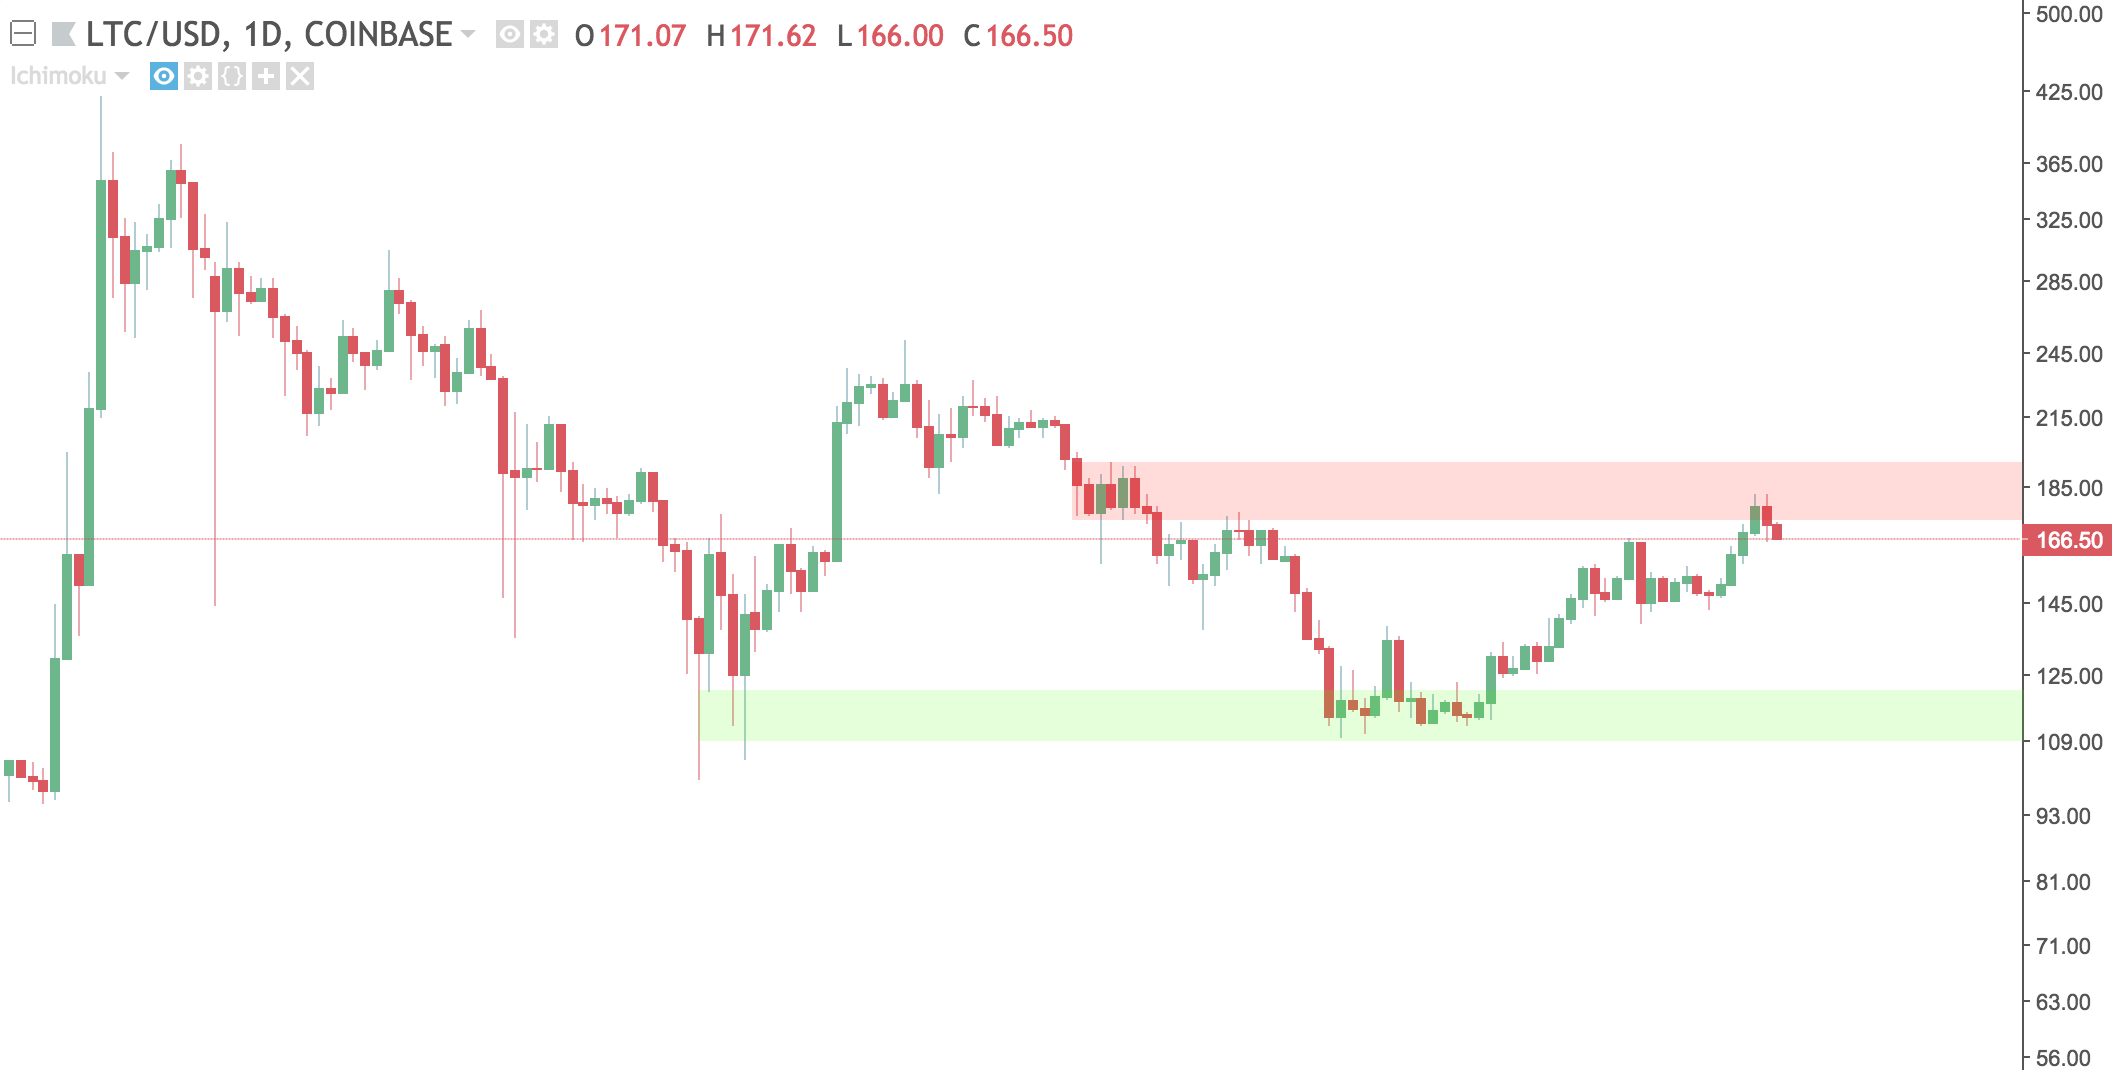
Litecoin (LTC)
Litecoin looks similar to last weeks chart after making around a 10% move. It tested a local resistance level but turned away. Expect retests of this level in the coming weeks.
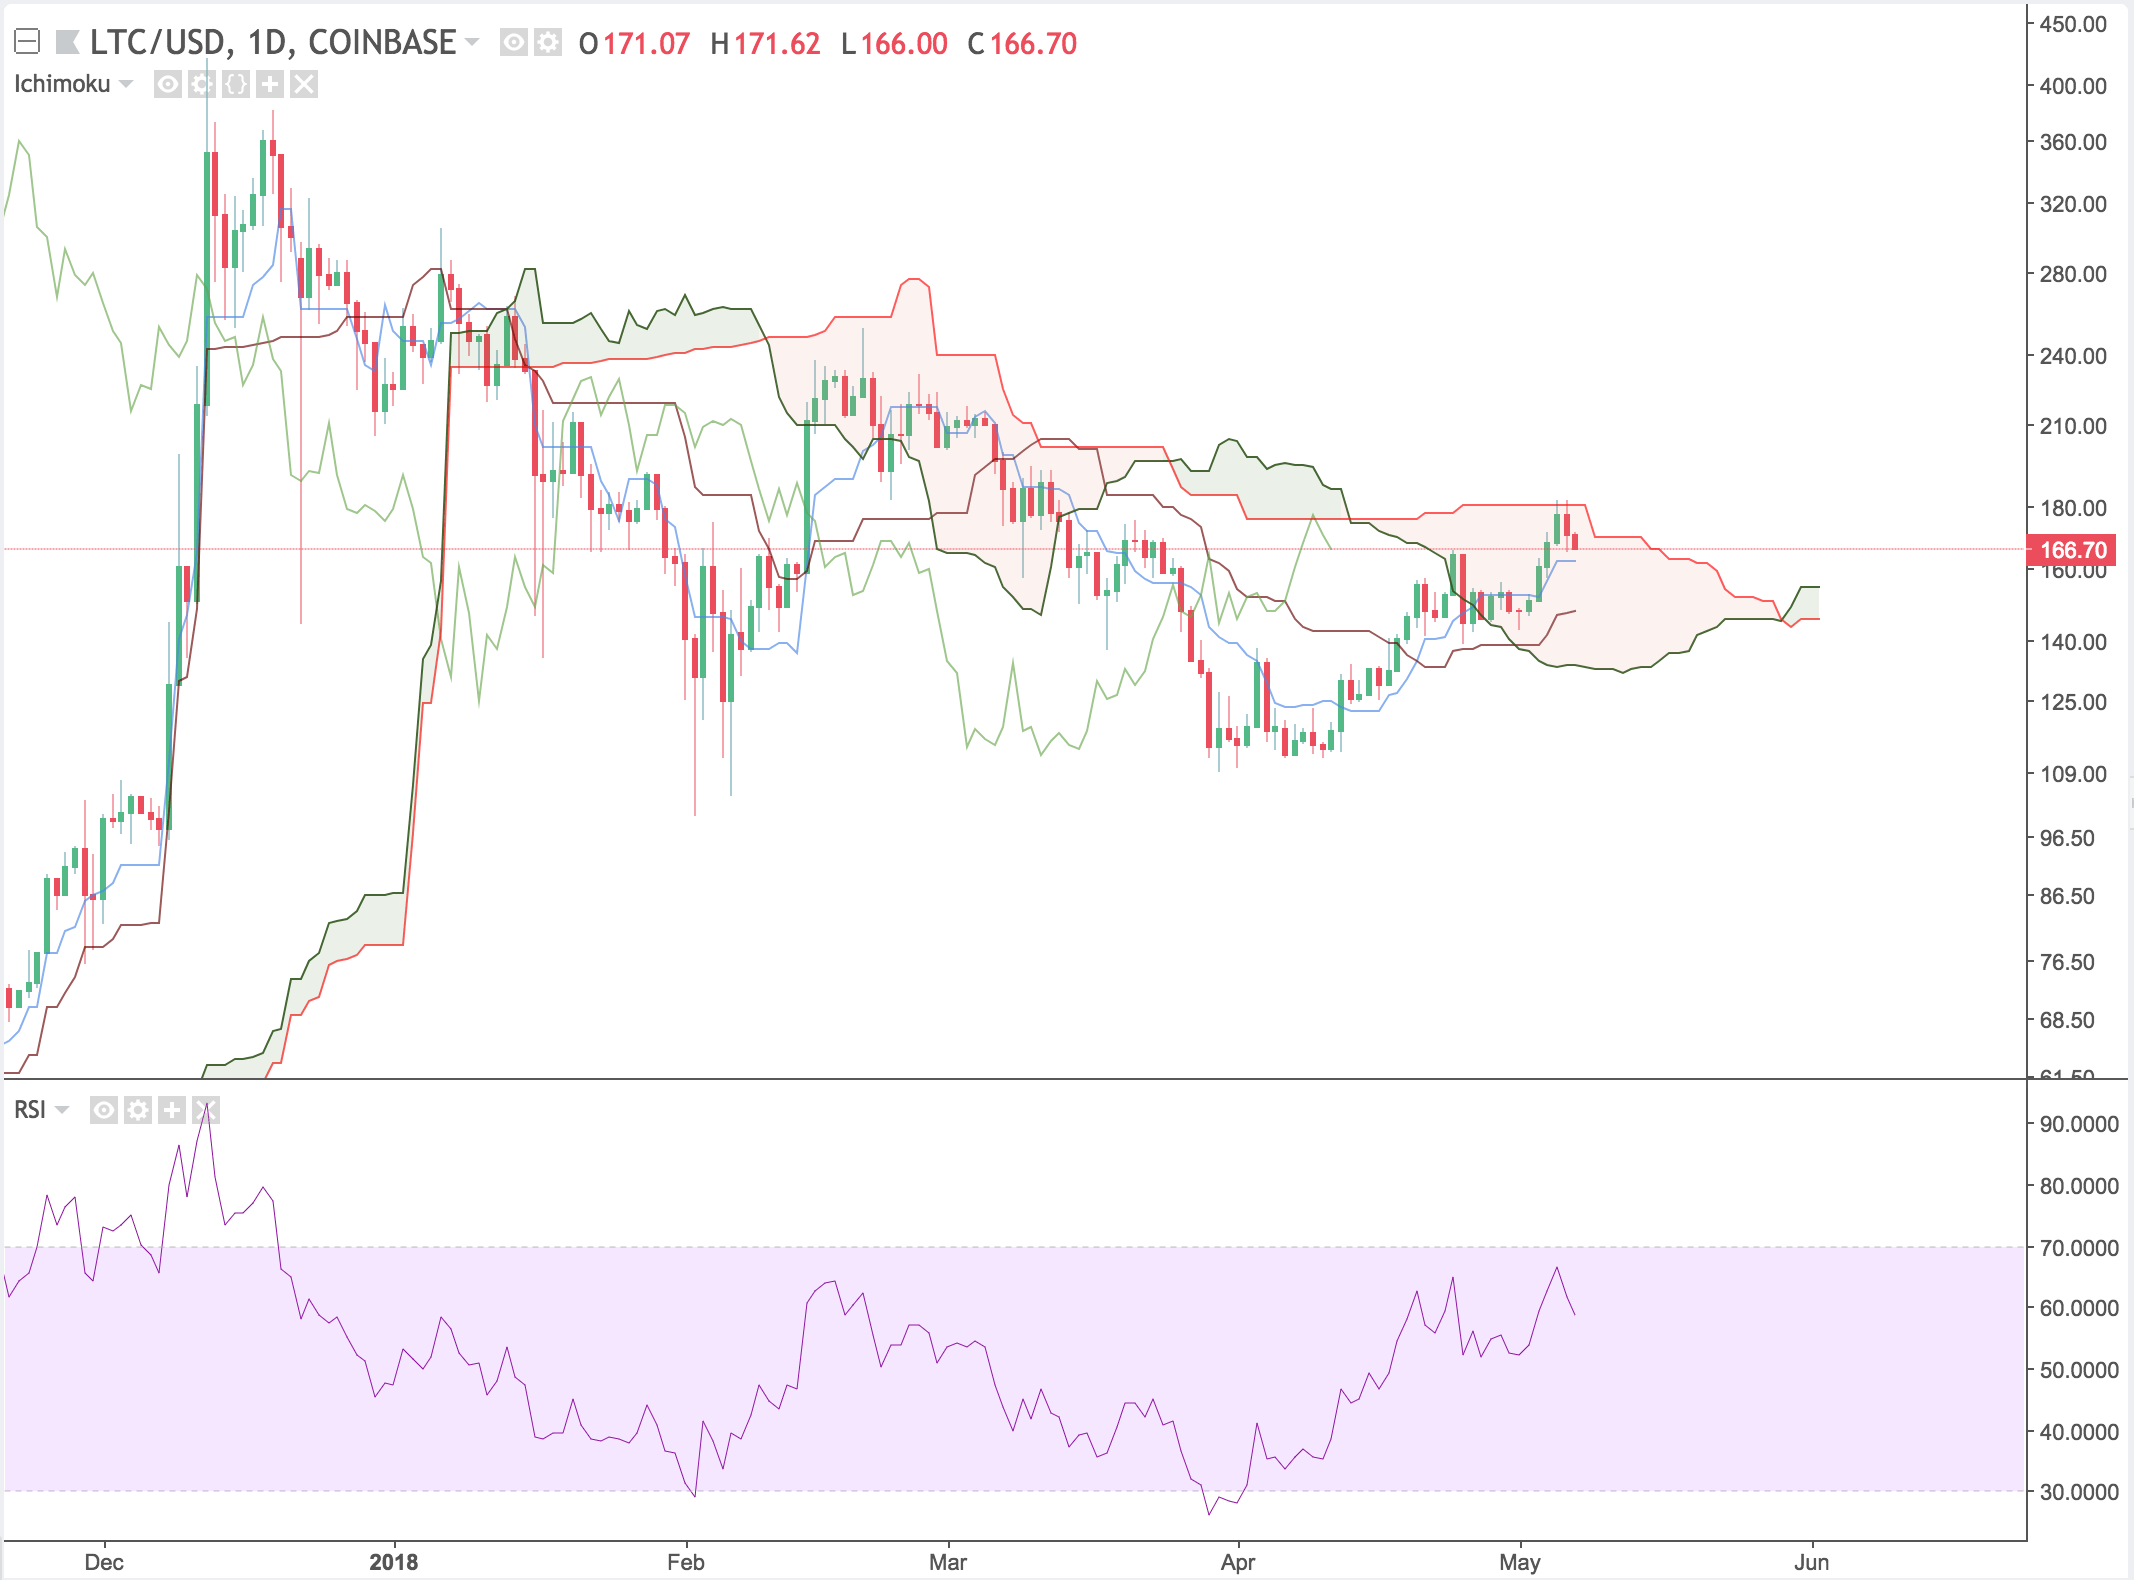
Adding Ichimoku Clouds, we see Litecoin is close to exiting the cloud. The lagging span is somewhat close to the current price which shows that the trend isn't very strong. Over the next week or so we should be able to tell how strong of trade signal this cloud break will be.
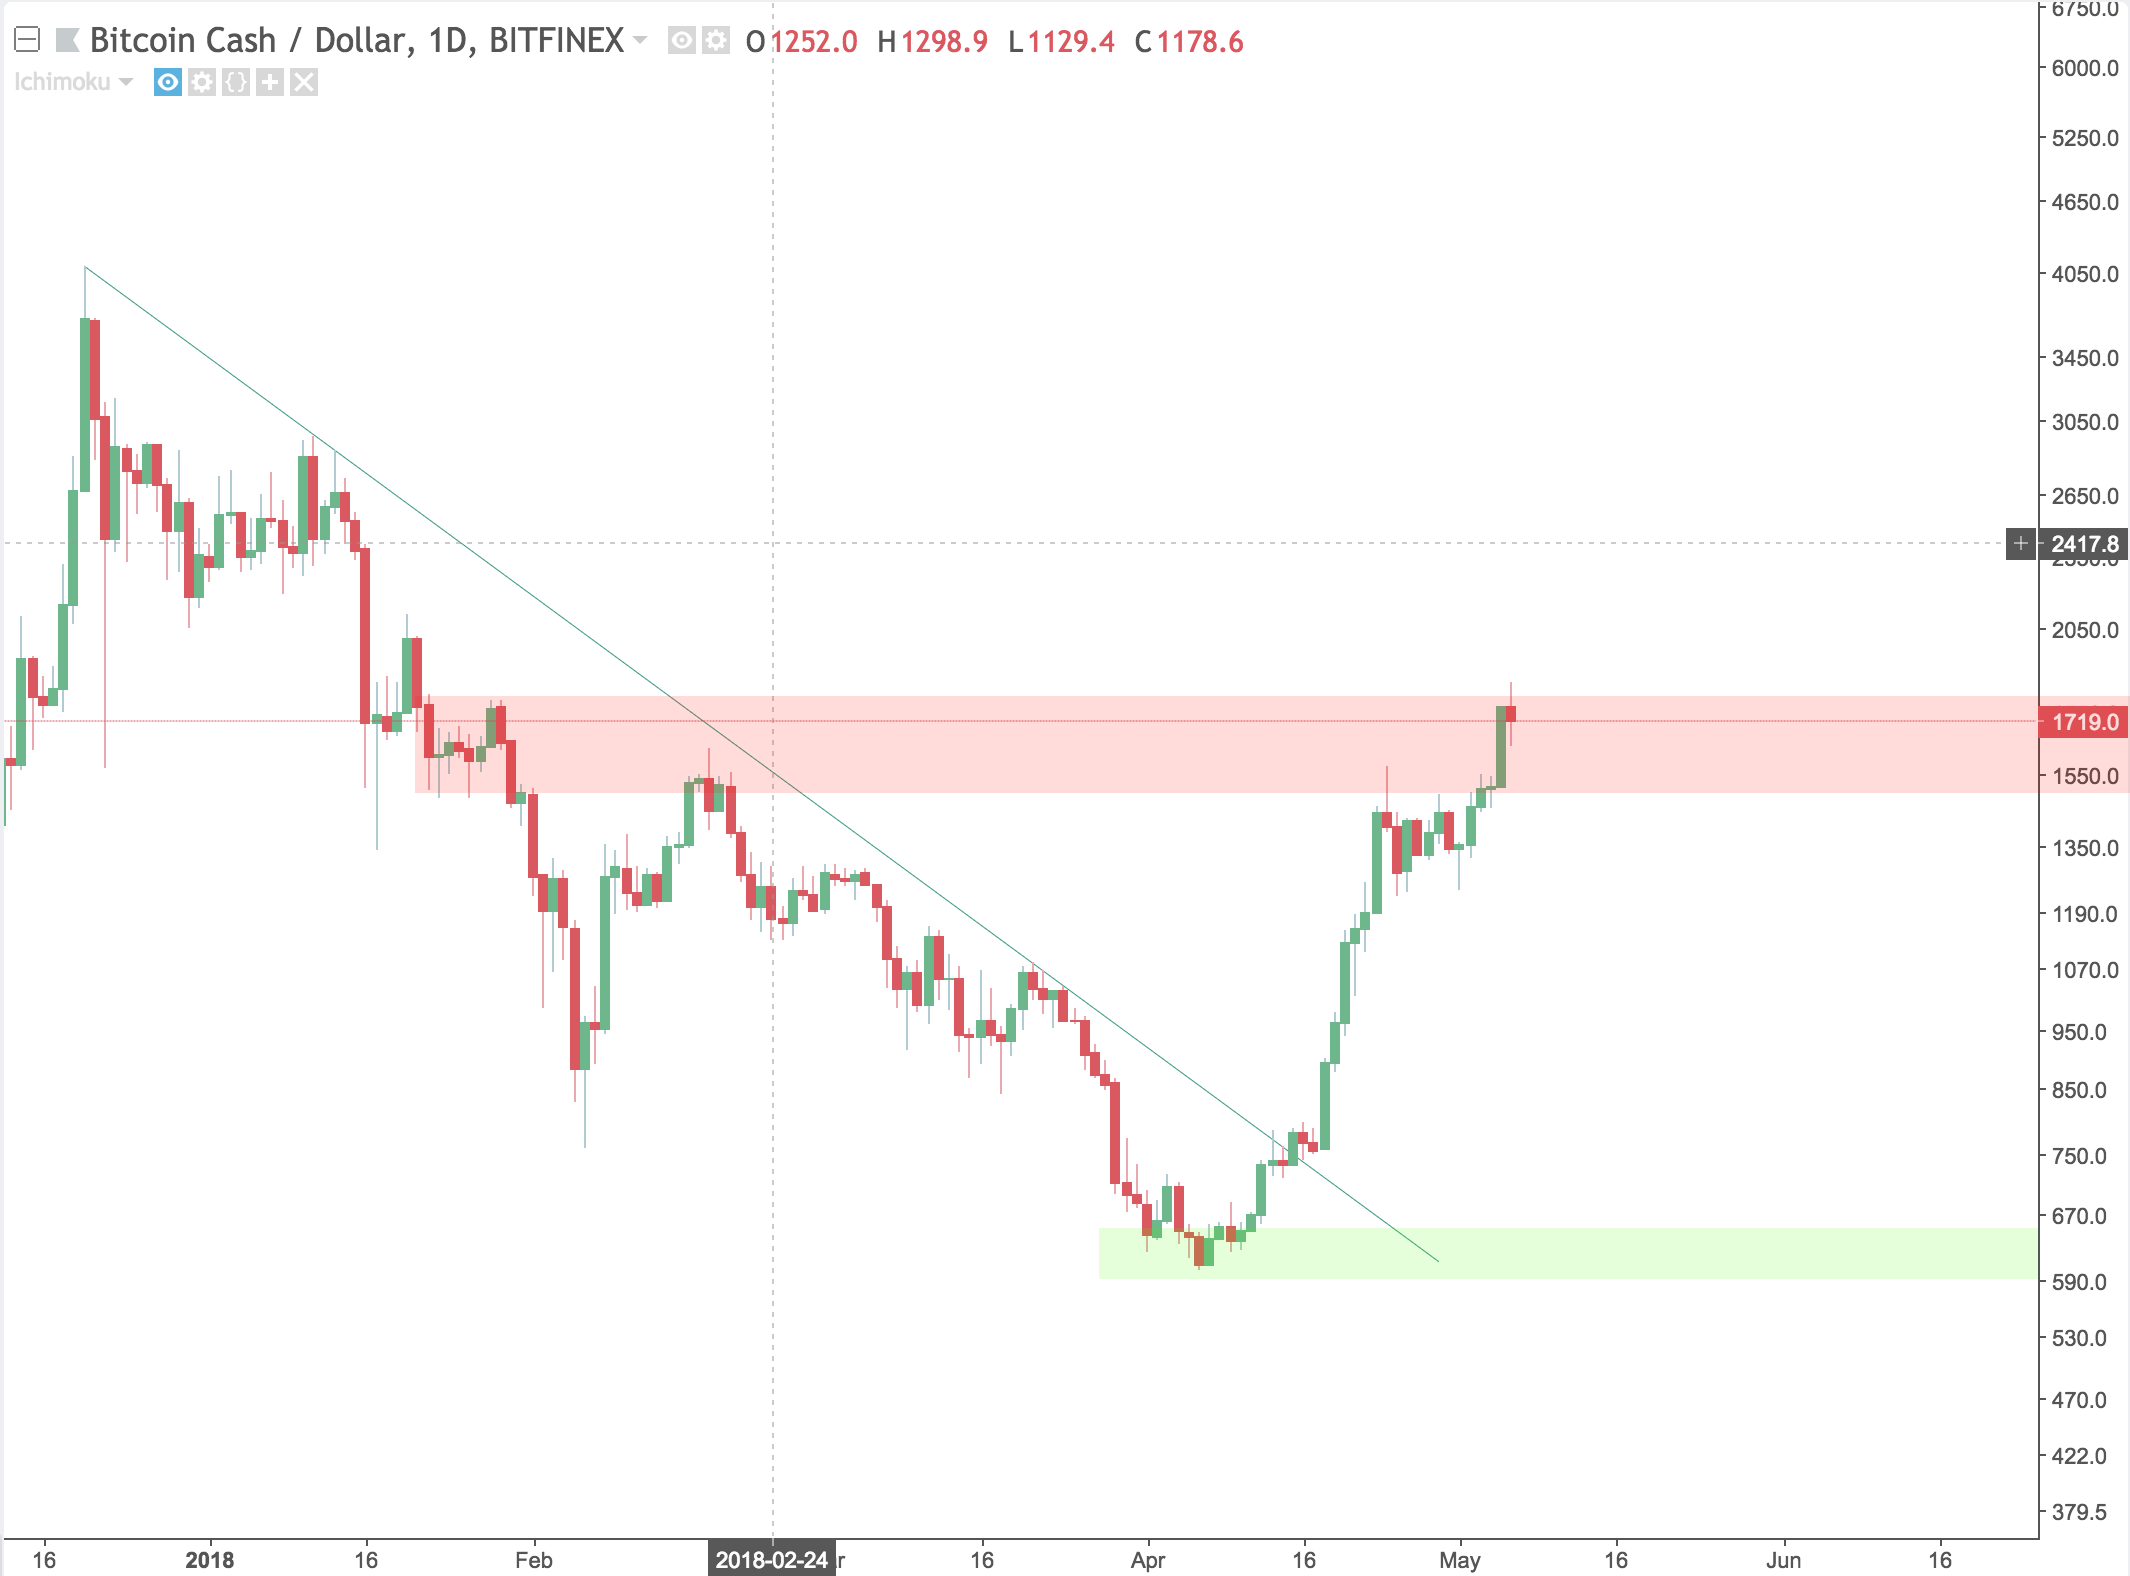
Bitcoin Cash (BCH)
Bitcoin Cash was one of the weeks largest gainers, seeing a 35% increase. It is towards the top of a resistance level, and if it makes a significant breakout of the range, it could see even more upside.
Using Ichimoku Clouds, we saw three signs of entry.
- Cloud Break
- Kumo Twist
- Lagging Span exists cloud above price
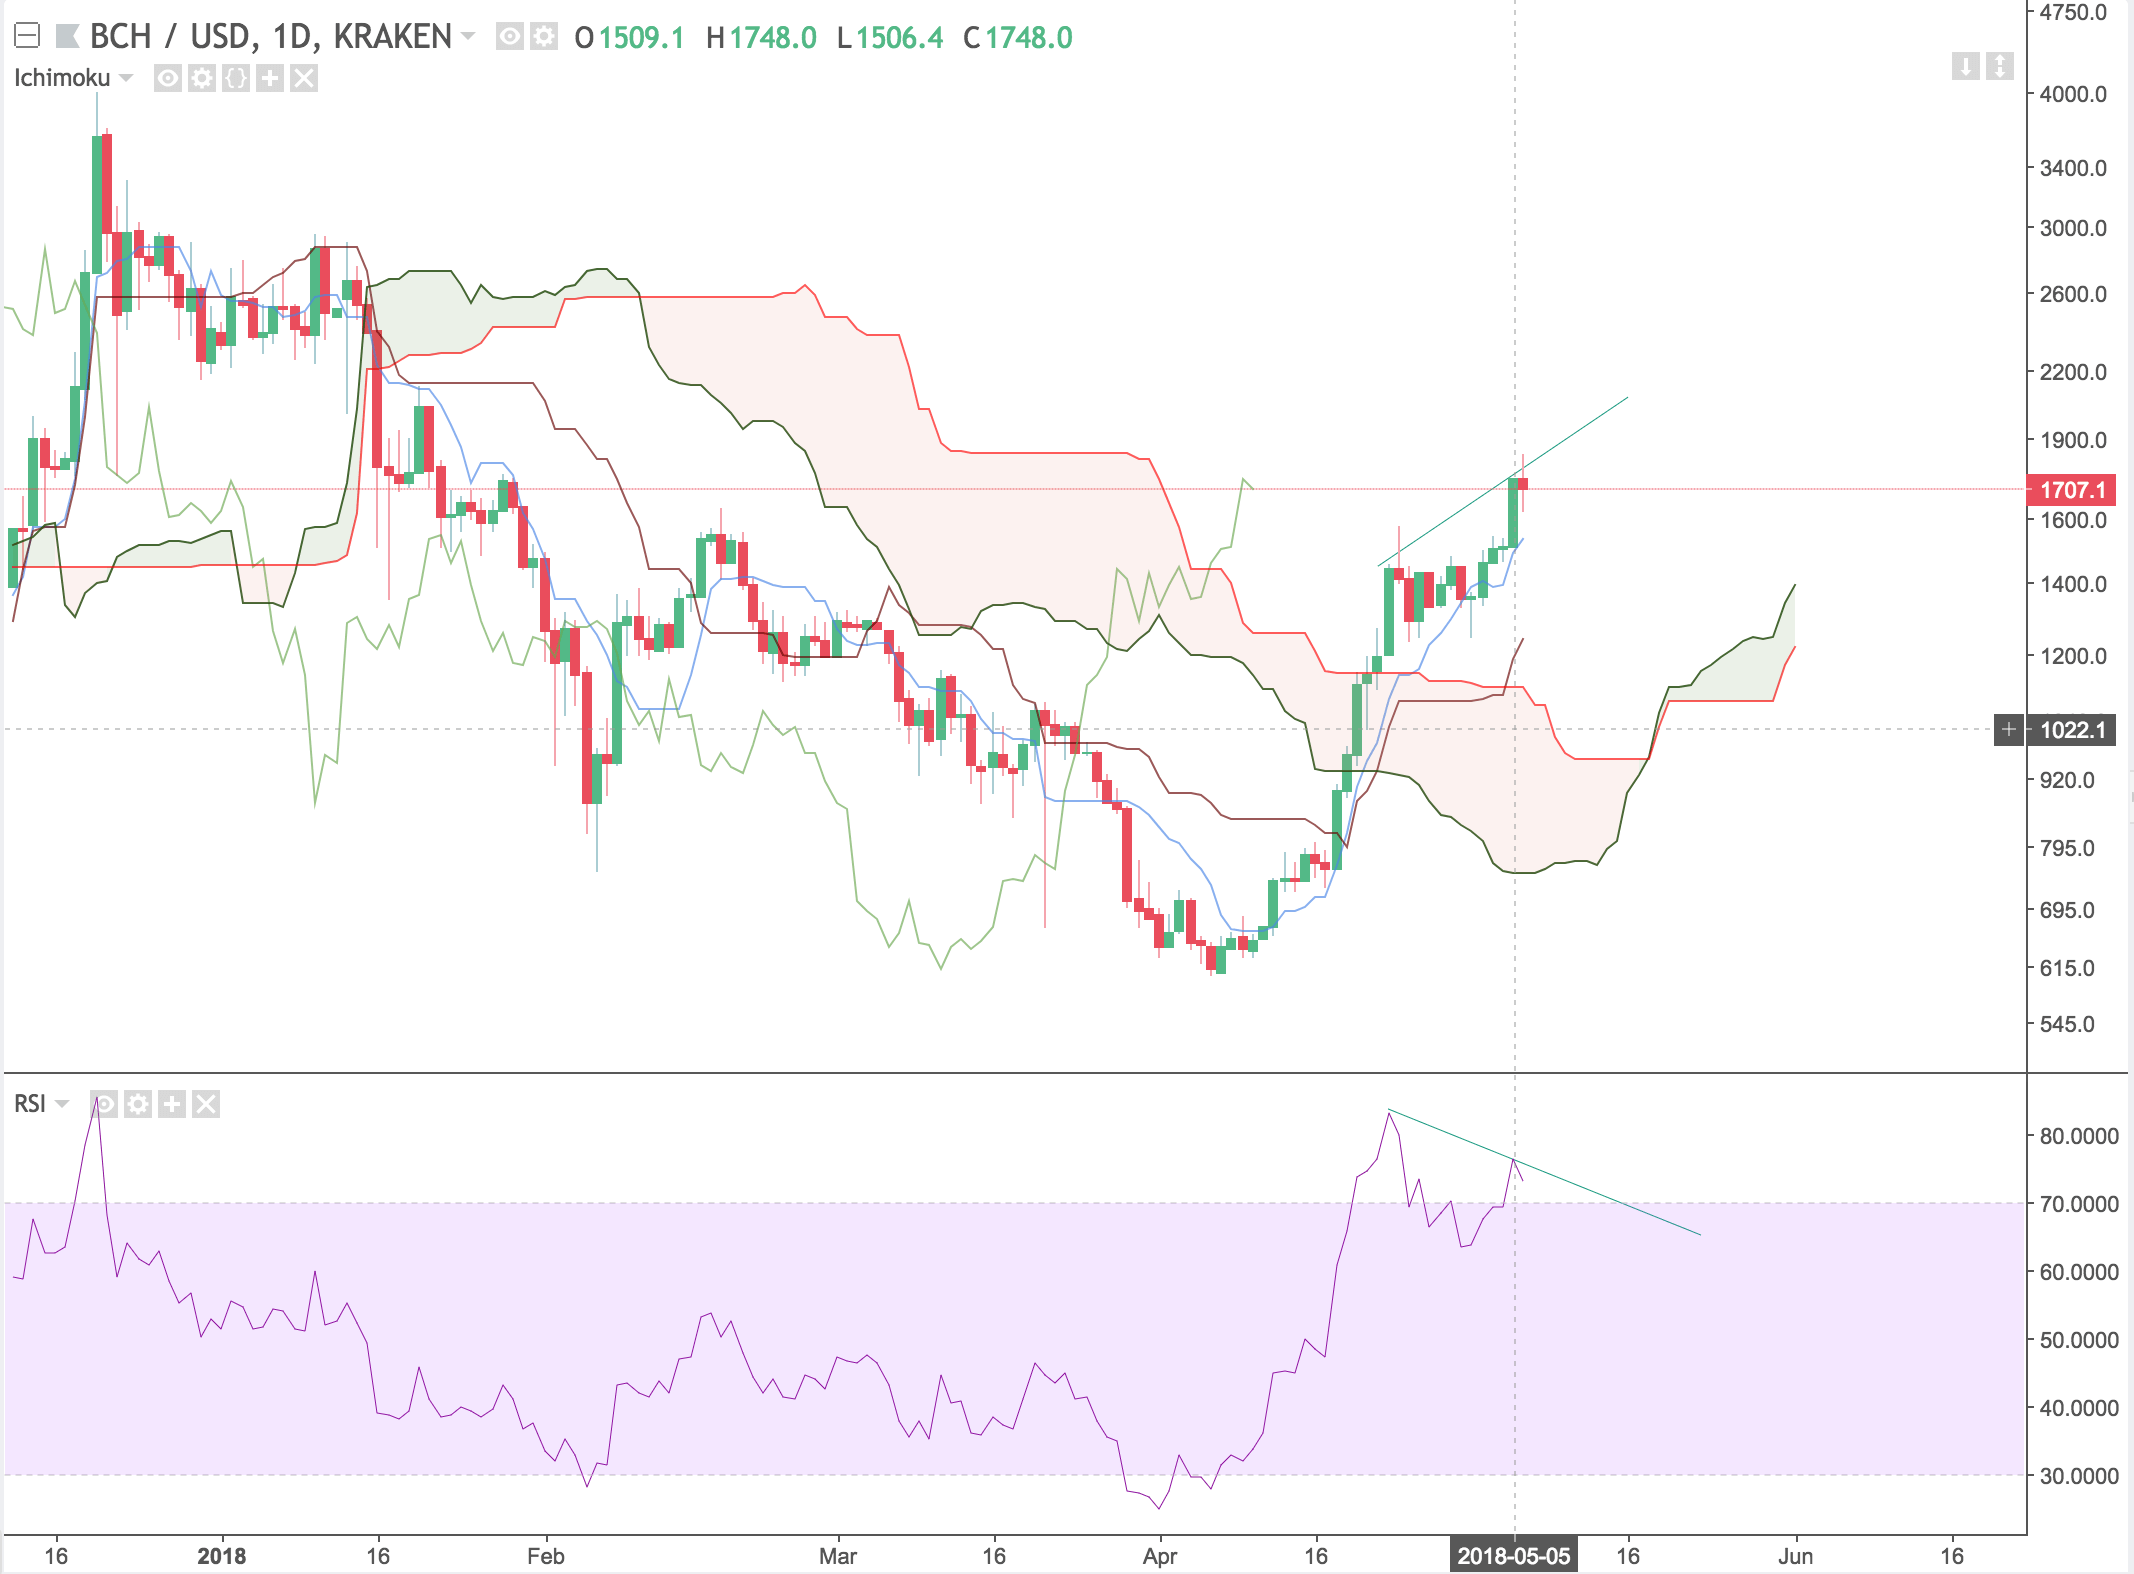
This trade has already seen most of its gains after going up $400 in a week. You can spot RSI divergence with the drawn diagonal lines. Price is making higher highs while RSI is trending downwards.
Ripple (XRP)
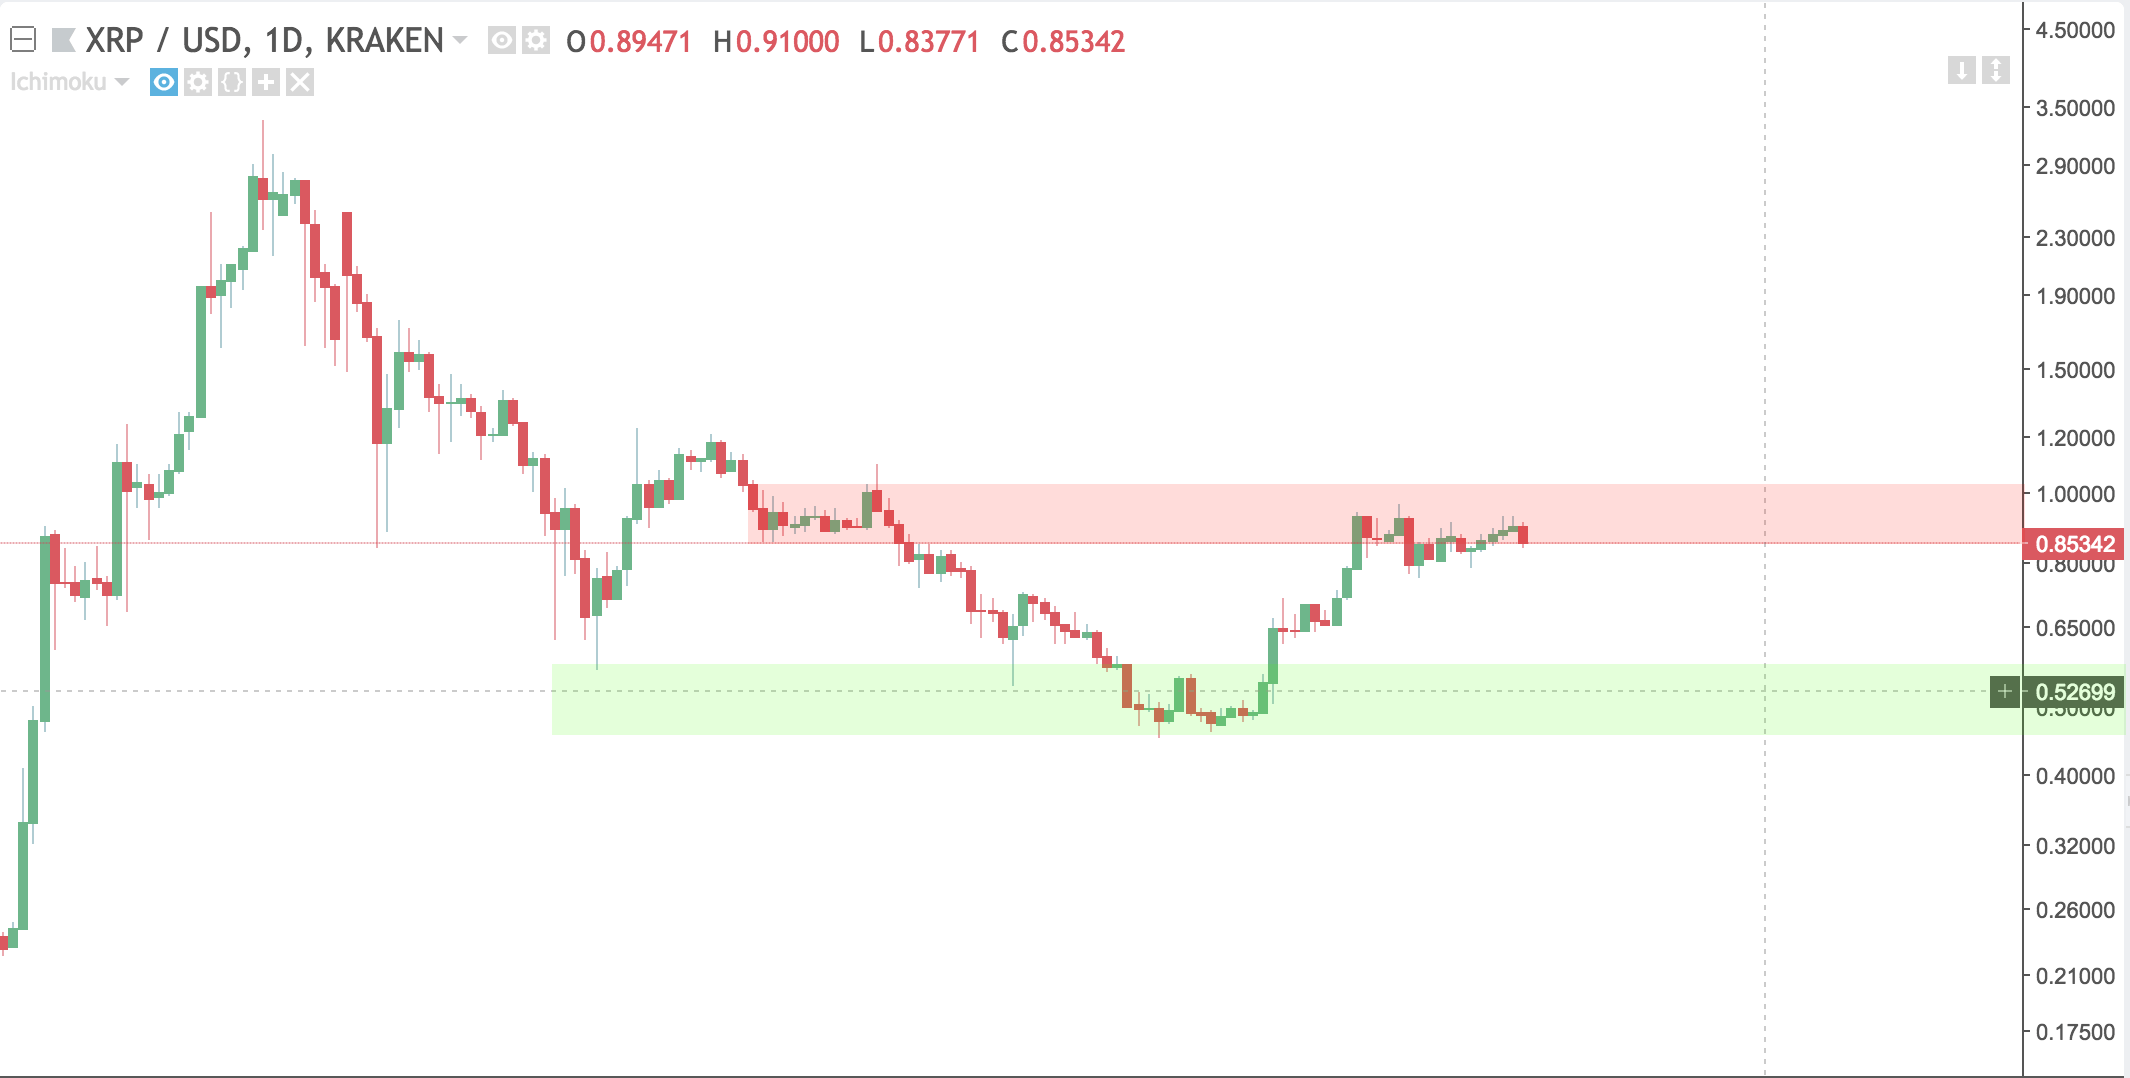
Despite Ripple being hit with a class action lawsuit, its price has been holding up well. Ripple is finding itself back at the $.85 cent level that we saw back in late February.
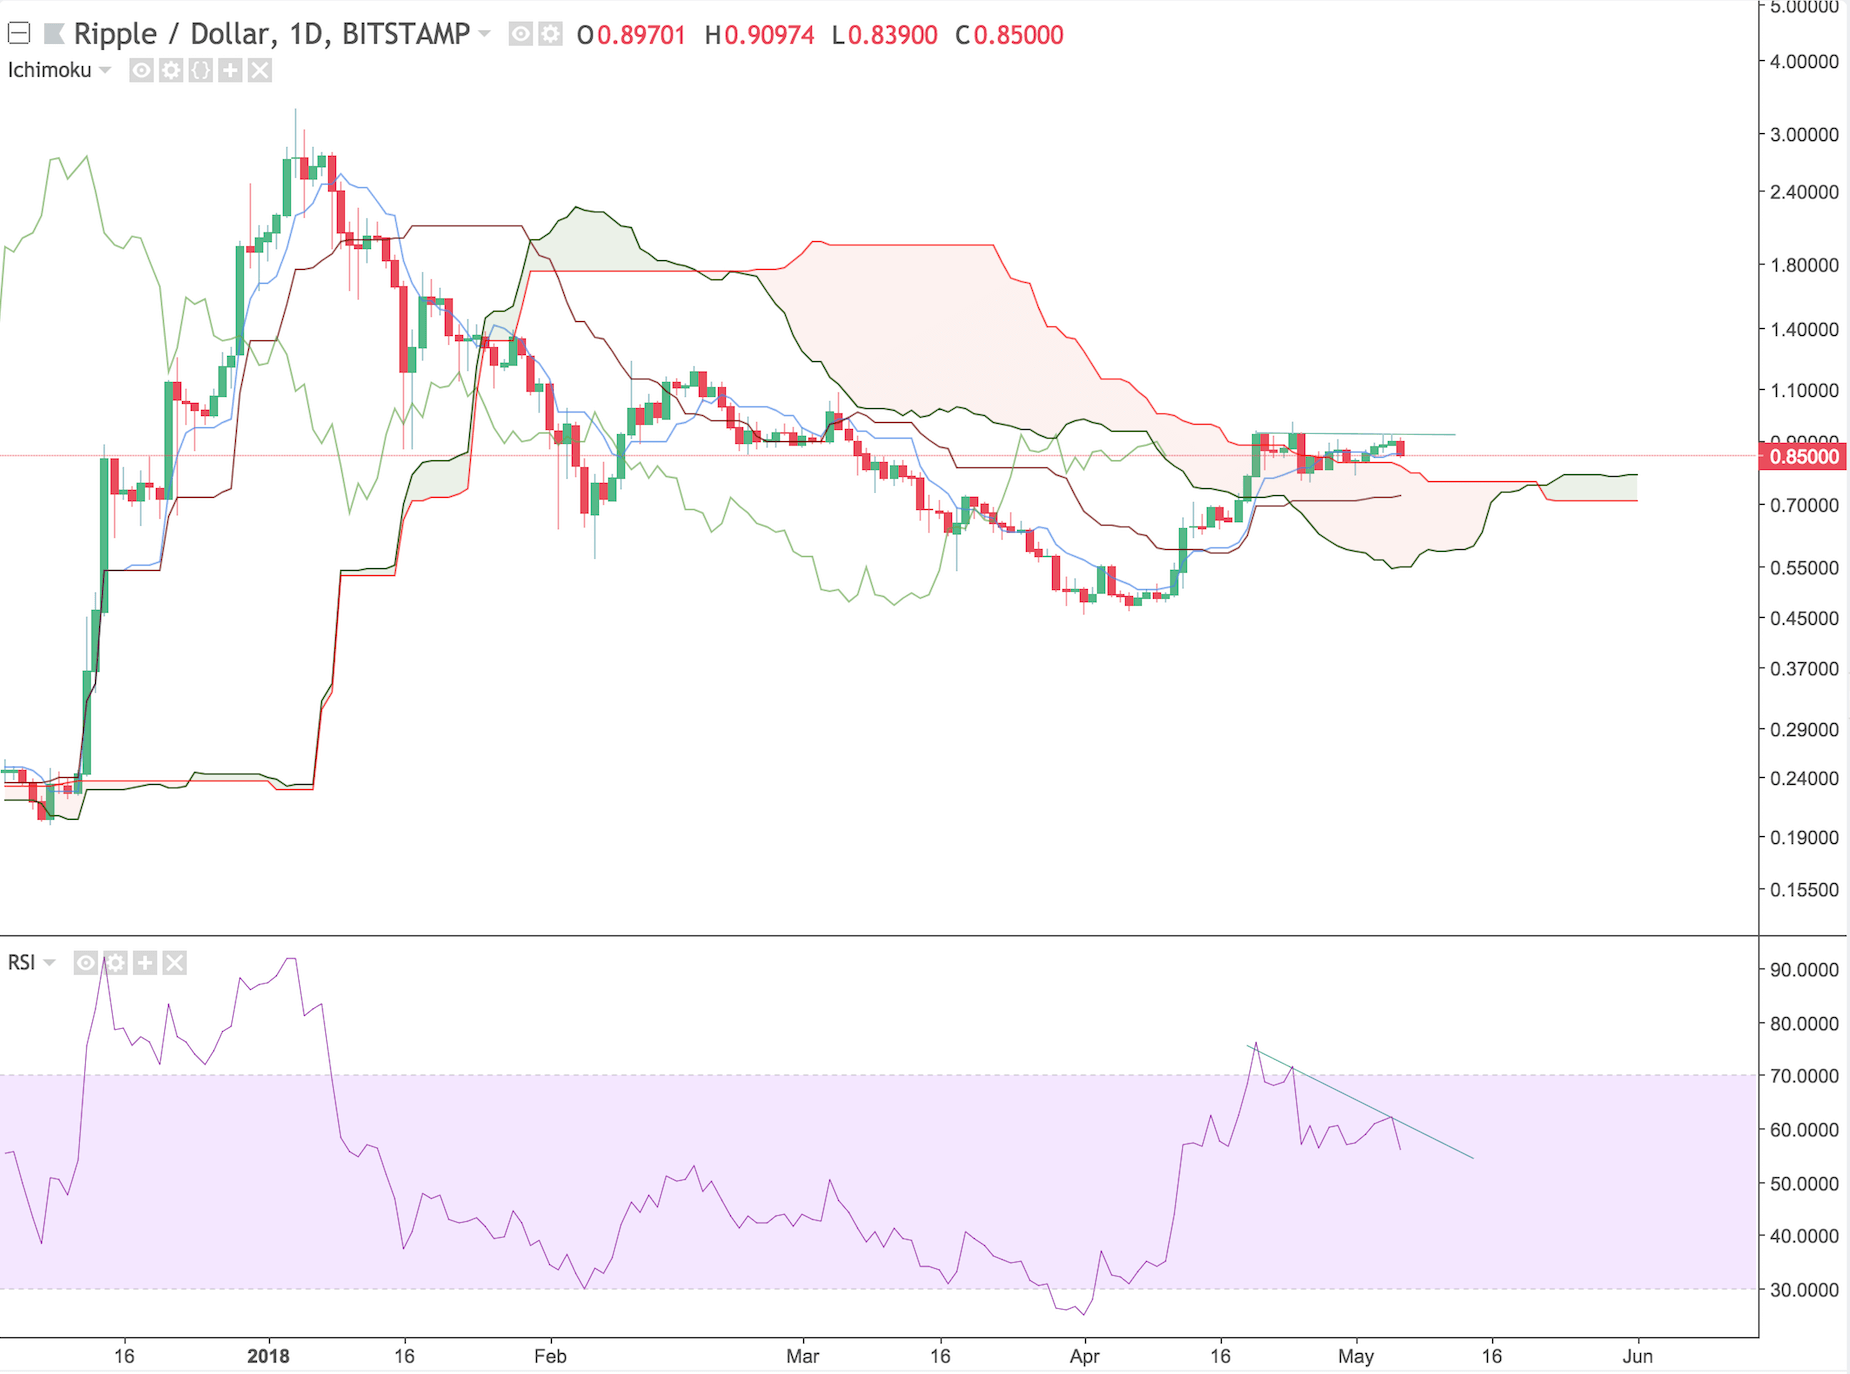
Adding RSI and Ichimoku Clouds to the picture, we see some key information. The cloud recently flipped bullish which is a great sign considering price also broke outside of the cloud. Depending on if the lagging span breaks out as well, you could make a trade here and catch some upside. There is some bearish RSI divergence which can be a red flag, but this trade is still developing.
Conclusions
Many of the above examples show signs of bearish RSI divergence. Bearish divergence occurs when an oscillator such as RSI is making lower highs, while the price is making higher highs.
It is possible that the market is pulling back slightly after a very bullish week. Technical analysis is not always correct, and should only be used to make more educated guesses on your trades. A combination of both fundamental and technical analysis should be used to ensure more successful trading.