Weekly MacroSlate: Fed Chair Powell remains hawkish while BOE seem confused, lack unanimity and lose all credibility as the pound sinks along with the British economy
A weekly recap of key Bitcoin metrics and the macro factors affecting its price performance in the market, published every weekend.
The BoE hiked its Bank rate 75bps to 3% while forecasting a two-year recession Jerome Powell hiked a fourth consecutive 75bps that puts the target rate at 3.75% – 4%. ADP employment report, job...
Read the full TL;DRTL;DR
- The BoE hiked its Bank rate 75bps to 3% while forecasting a two-year recession
- Jerome Powell hiked a fourth consecutive 75bps that puts the target rate at 3.75% – 4%.
- ADP employment report, job openings, and jobs added all came in hot and above the median forecast
- Unemployment rose to 3.7% from 3.5%
Coinbase burns $546M of USD resources as it reports another quarter in the red with a 55% revenue decline.
MicroStrategy Q3 loss narrows, but revenue drops year-over-year; 301 BTC added to portfolio
- Bitcoin remains flat for the week trading around $20k
- Bitcoin hash rate continues to explode higher, approaching 300 EH/s
Macro Overview
Powell is not ready to pause
Investors are looking for a sign of a slowdown from Fed chair Powell, which they initially thought they were getting despite a fourth consecutive 75bps hike that takes the target rate to 3.75% – 4%. US equities and bonds rallied ahead of Powell’s conference, with Powell emphasizing;
“very premature to be thinking about pausing rate increases.”
U.S. GDP for the third quarter showed signs of growth. However, it came at a cost, with core inflation accelerating and the labor market remaining robust, with housing starting to tumble but unemployment at historic lows of 3.5%. Since the hikes began in March, little to suggest the impact of hikes has been felt.
Chair Powell was evident in his statement;
“end-point [for rates] is likely higher than it was, given how inflation data continue to come in hot.”
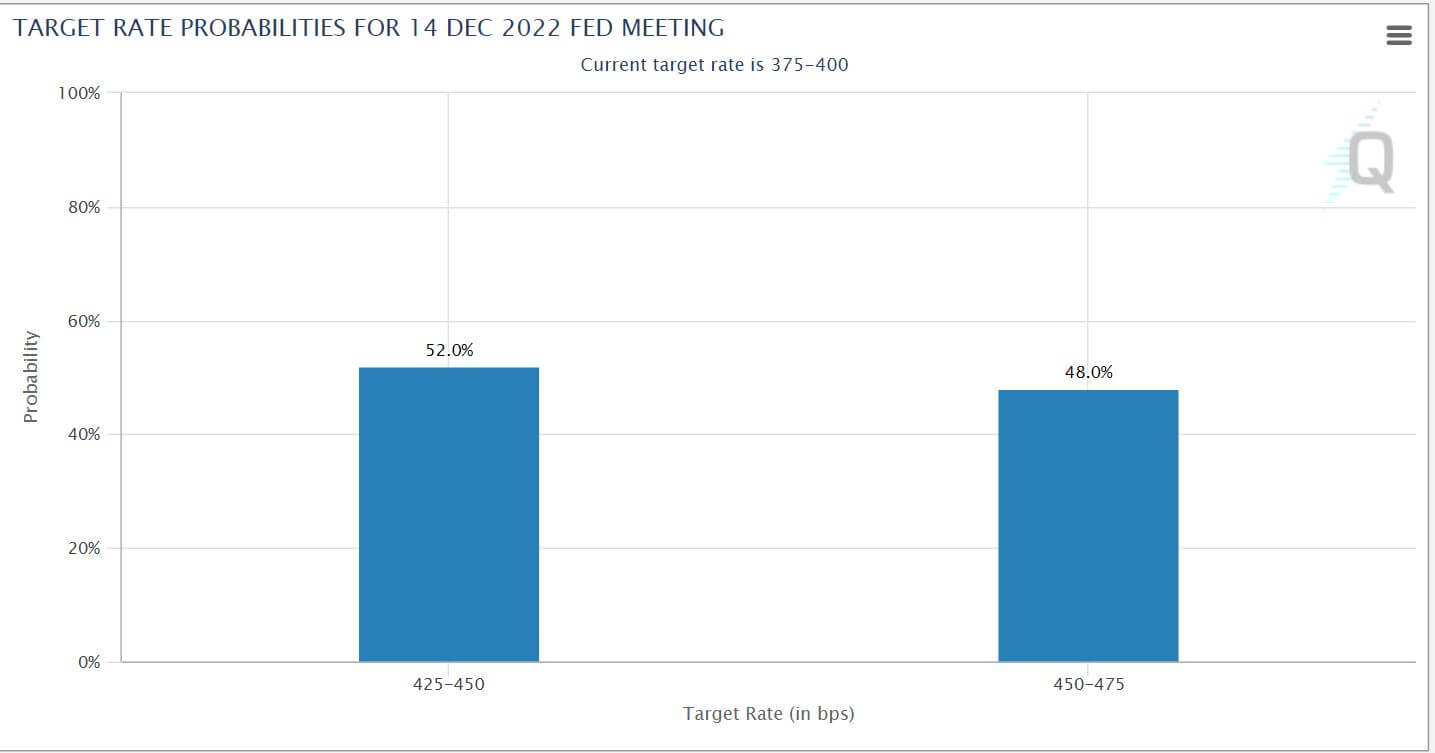
The next rate hike is scheduled for Dec. 14; the U.S. has two further CPI prints and two labor market reports with Powell indicating no action has been taken yet on the size of the future hike.
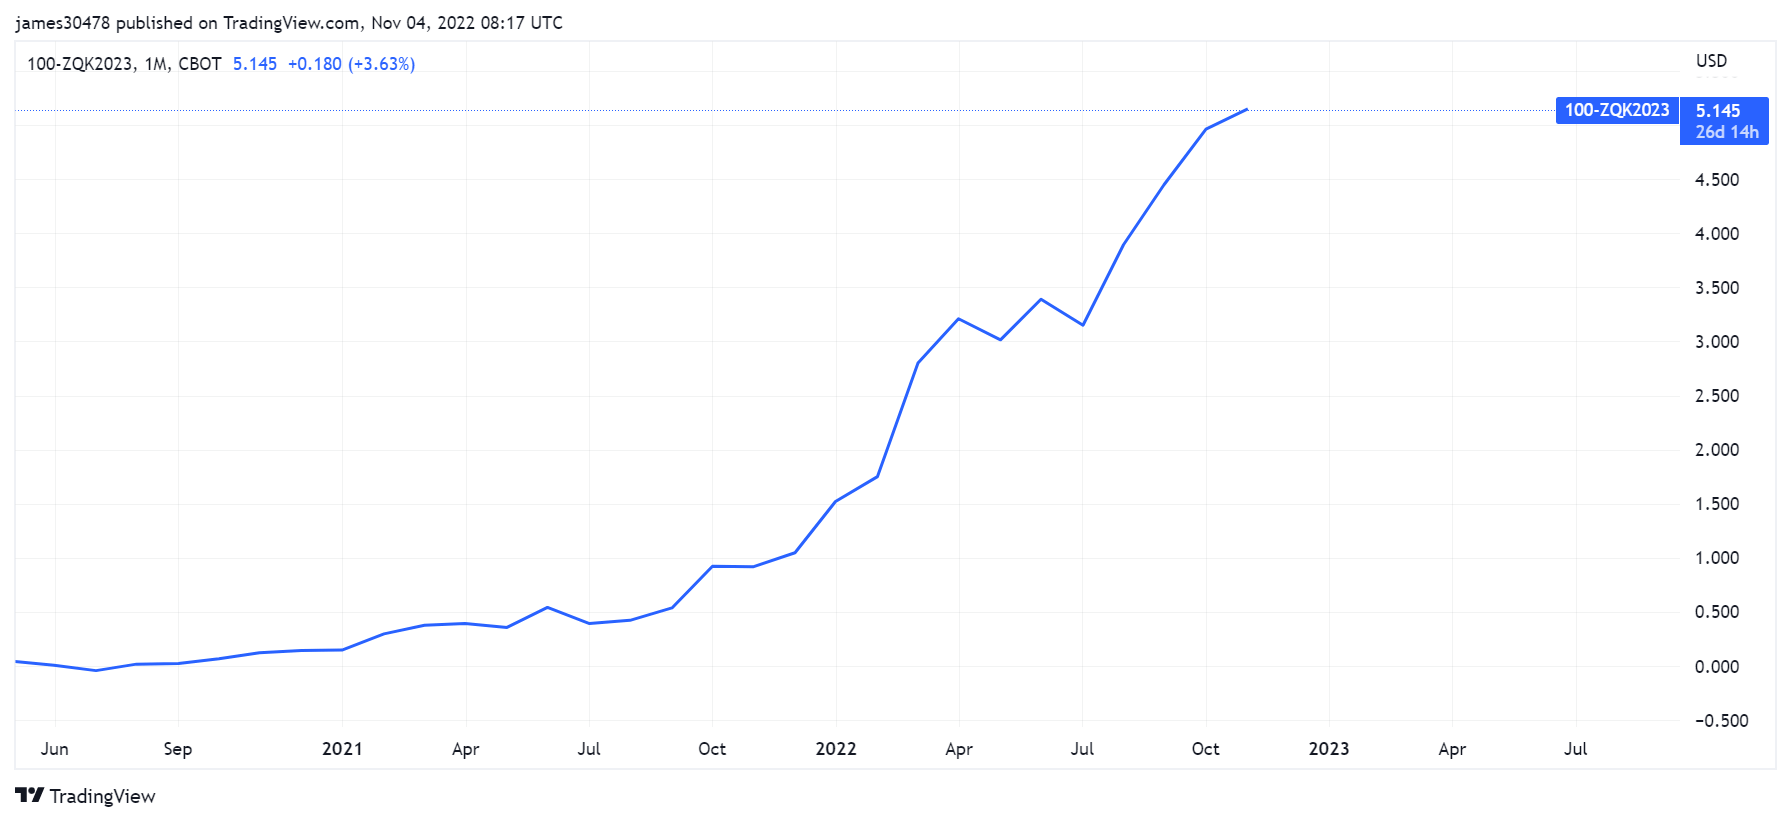
Currently, markets are predicting fed funds rates will get to 5.1% by the first half of 2023, while there is a 50% chance of a 75bps hike for Dec. 14.
Correlations
ETH/BTC outperformance
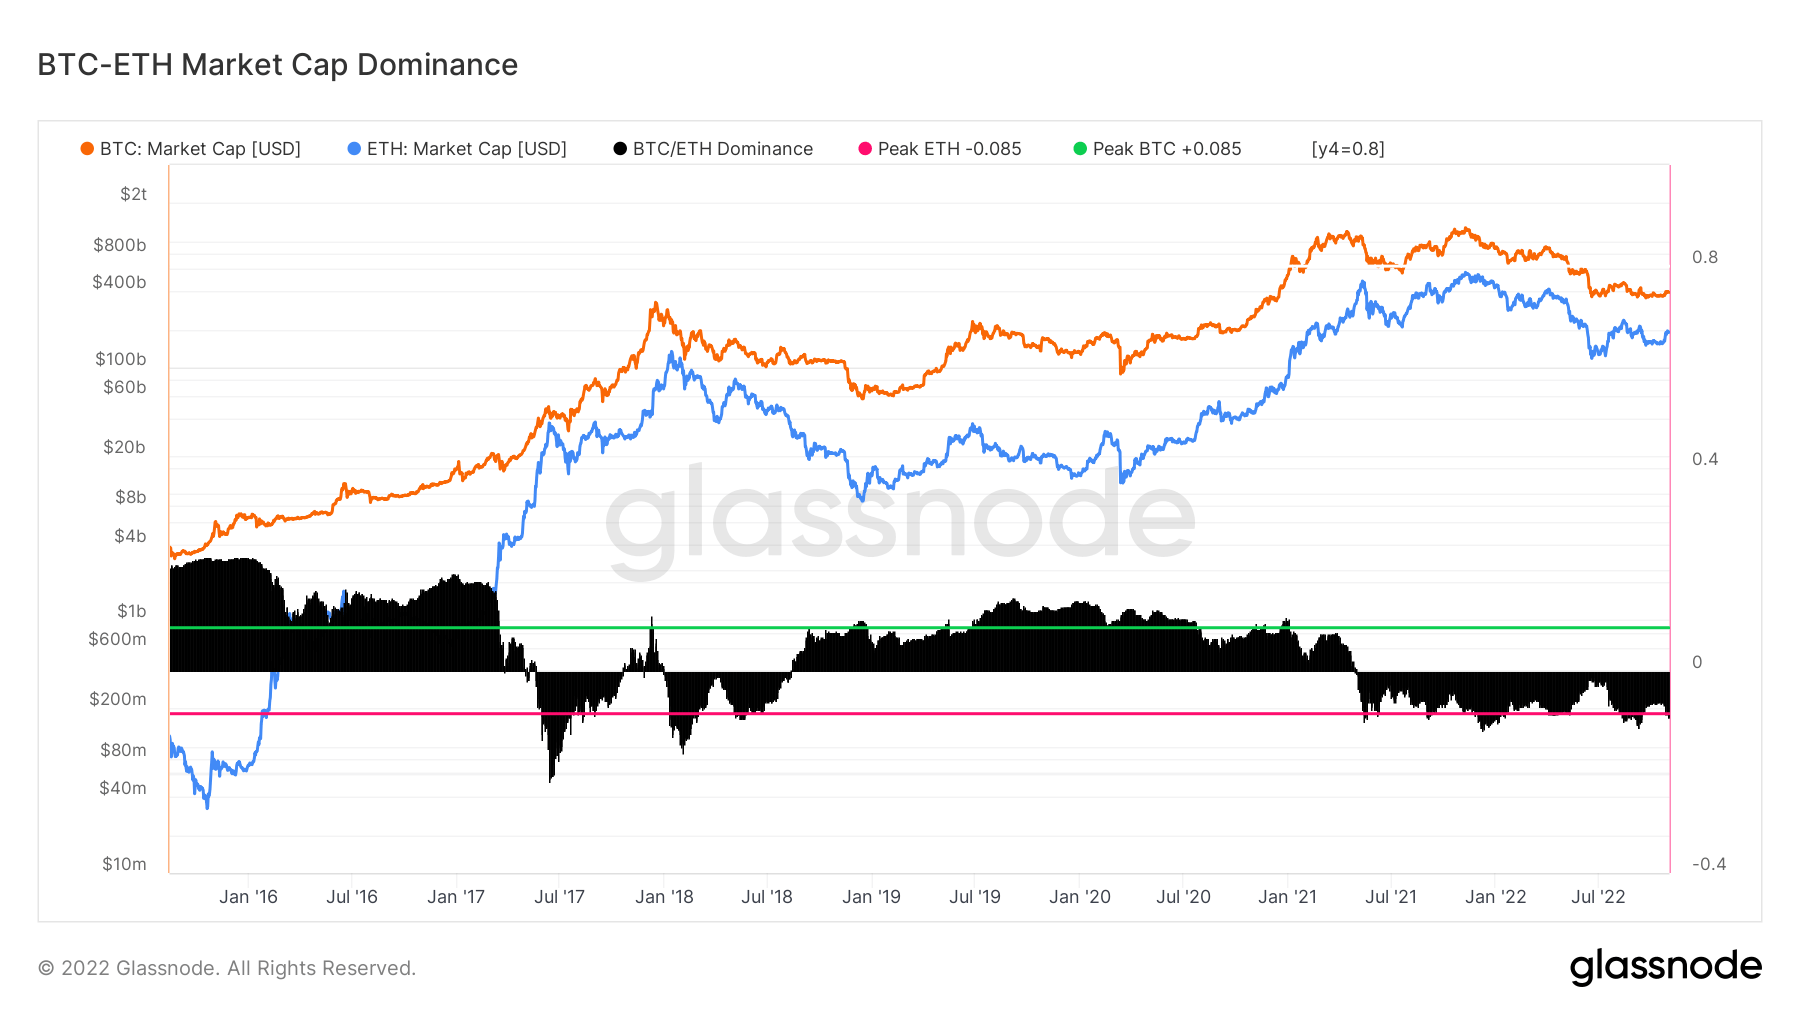
Ethereum has regained its peak dominance against Bitcoin. The BTC-ETH Dominance metric is an oscillator that tracks the macro outperformance trends between the top two crypto-assets. It considers only the market cap of Bitcoin relative to the combined market cap of the digital currencies.
So when the metric is over the pink line, ETH outperforms on a relative basis and vice versa with the green line for BTC.
A look at the charts showed that Ethereum’s dominance over Bitcoin has risen since July 2021 and peaked in July 2022, just a few months before the Merge.
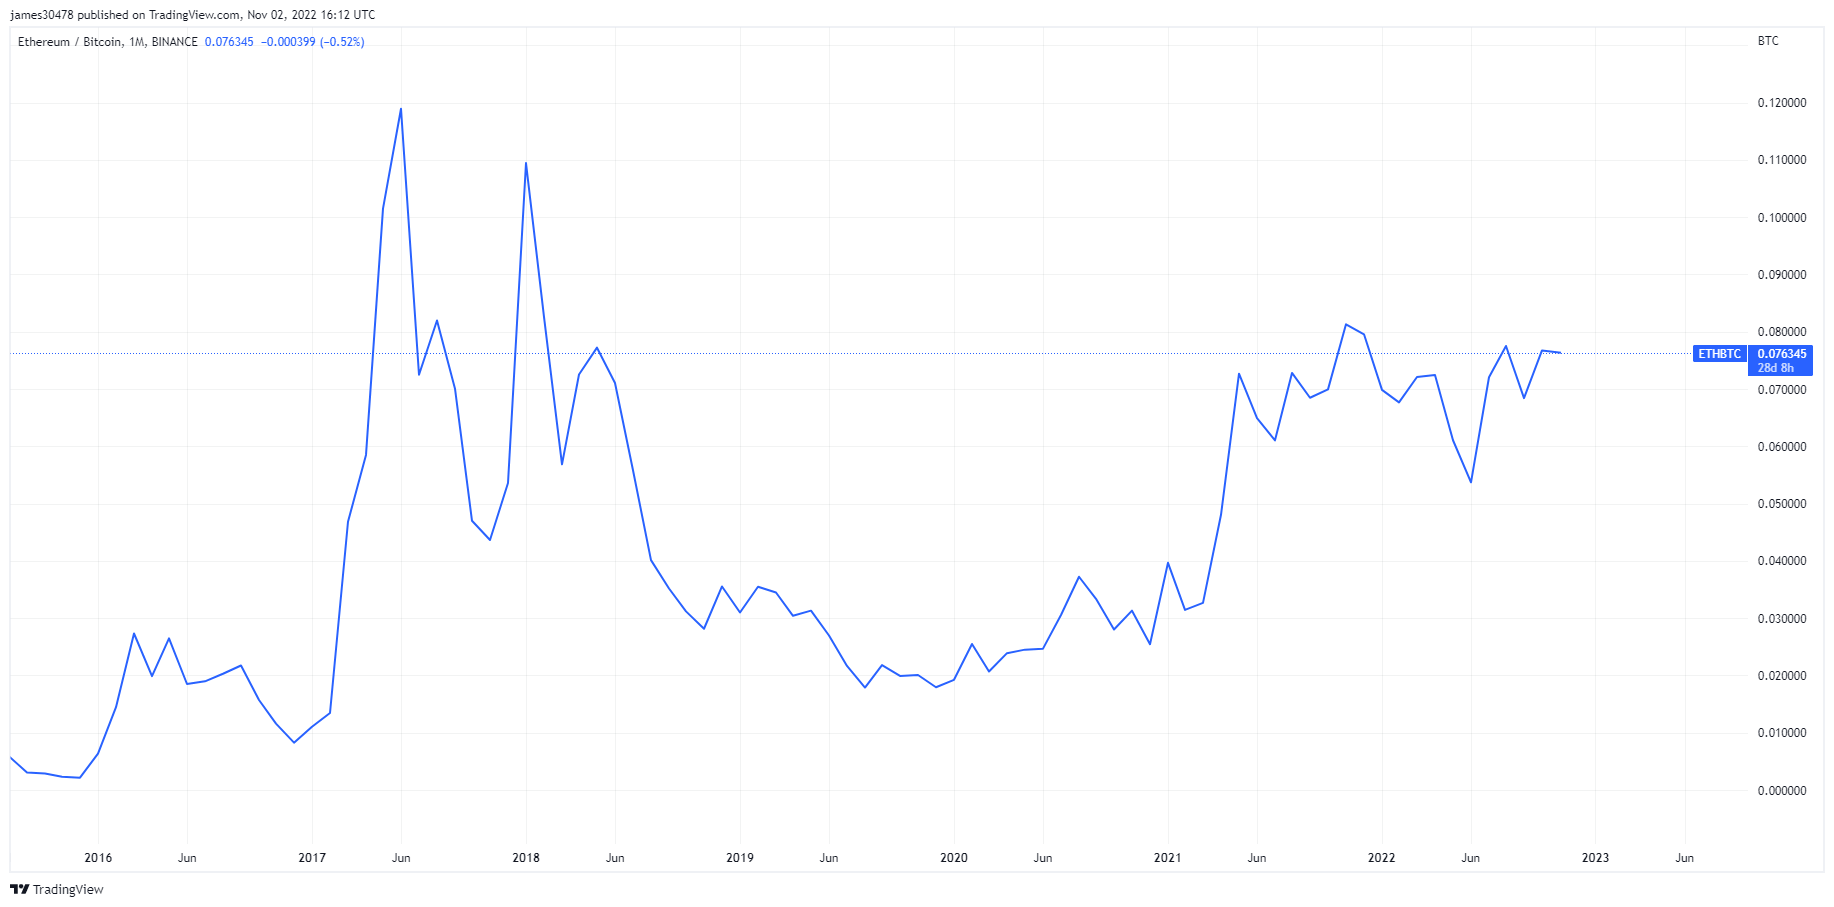
While ETH/BTC is currently around 0.076, it is approaching the merged high of 0.081.
Equities & Volatility Gauge
The year of the sovereign debt bubble unwinds
The economy has been built on cheap debt with the promise of risk-free returns, specifically USTs. Since 2008, interest rates have been held to the lower bound of 0 while the quantitative easing program has been in full force contributing to ‘boom and bust cycles.
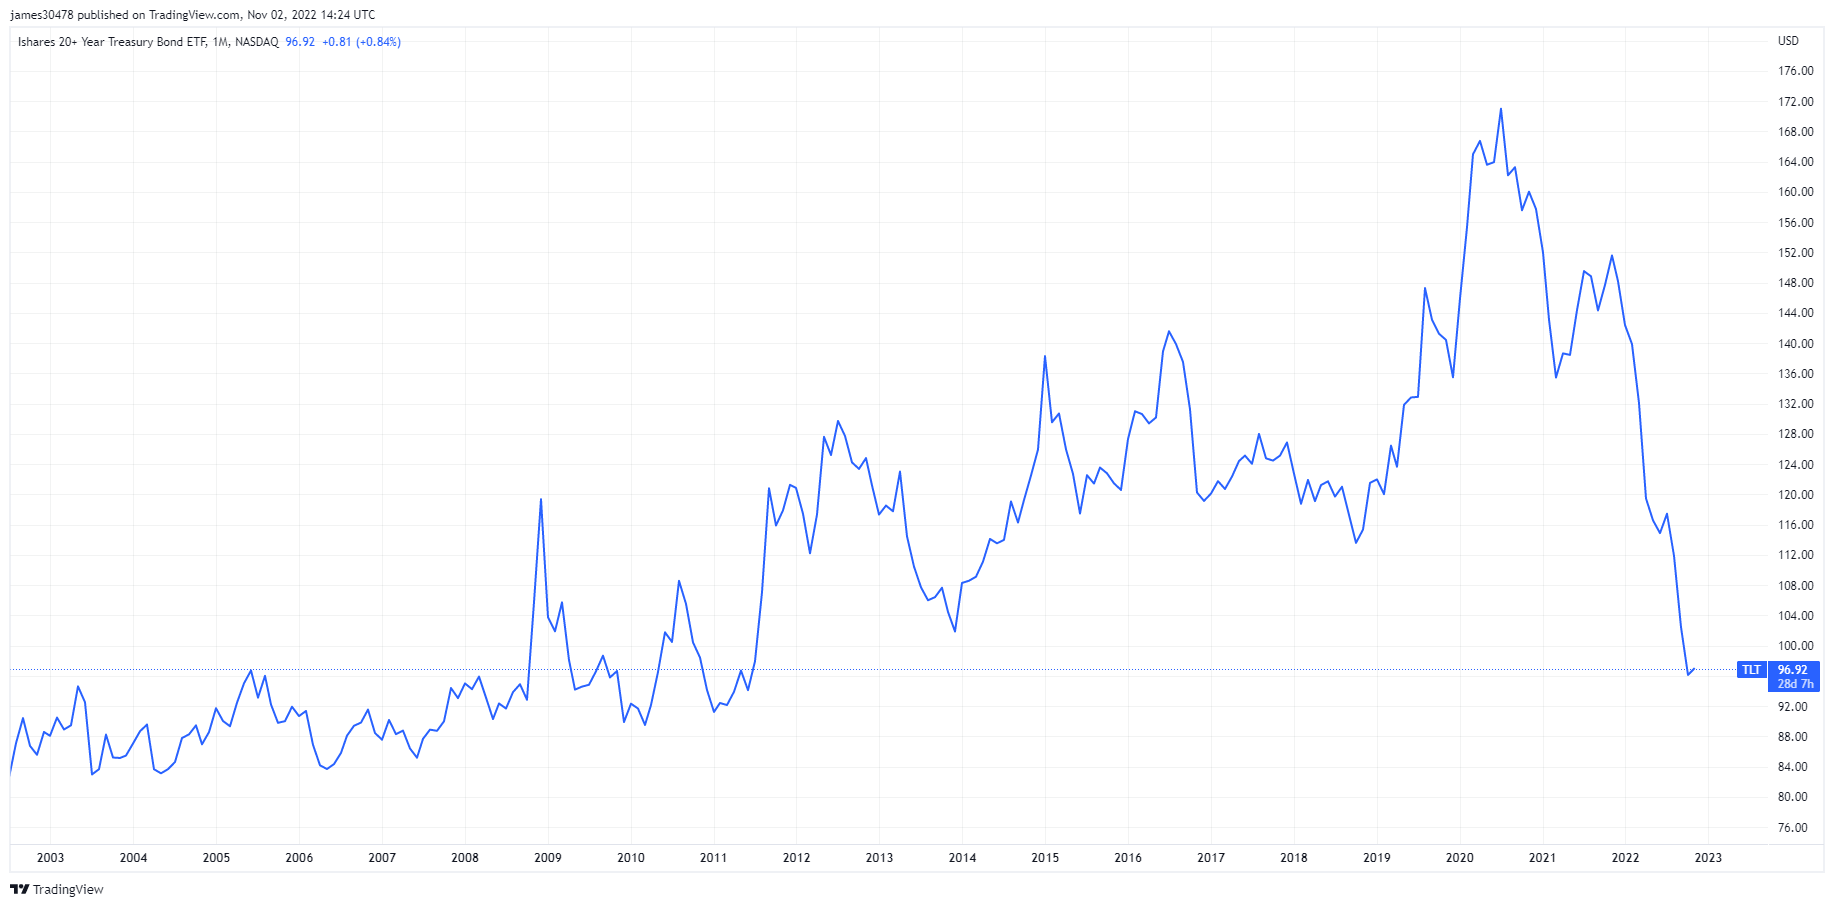
The U.S. 20+ Year Treasury Bond ETF – TLT. At its peak in 2020, it hit a high of 170; it is now at 97, a 55% drawdown, and back to the same levels of 2011 before adjusting for inflation. It was a relatively good investment during an era of low-interest rates; however, these bonds will continue to be slaughtered in a high inflationary and high-interest rate period. Not only is the 60/40 portfolio in flames, but the state of passive investing has ended.
“TLT is a high-quality ETF, thanks to a low expense ratio and liquidity” – Investopedia.
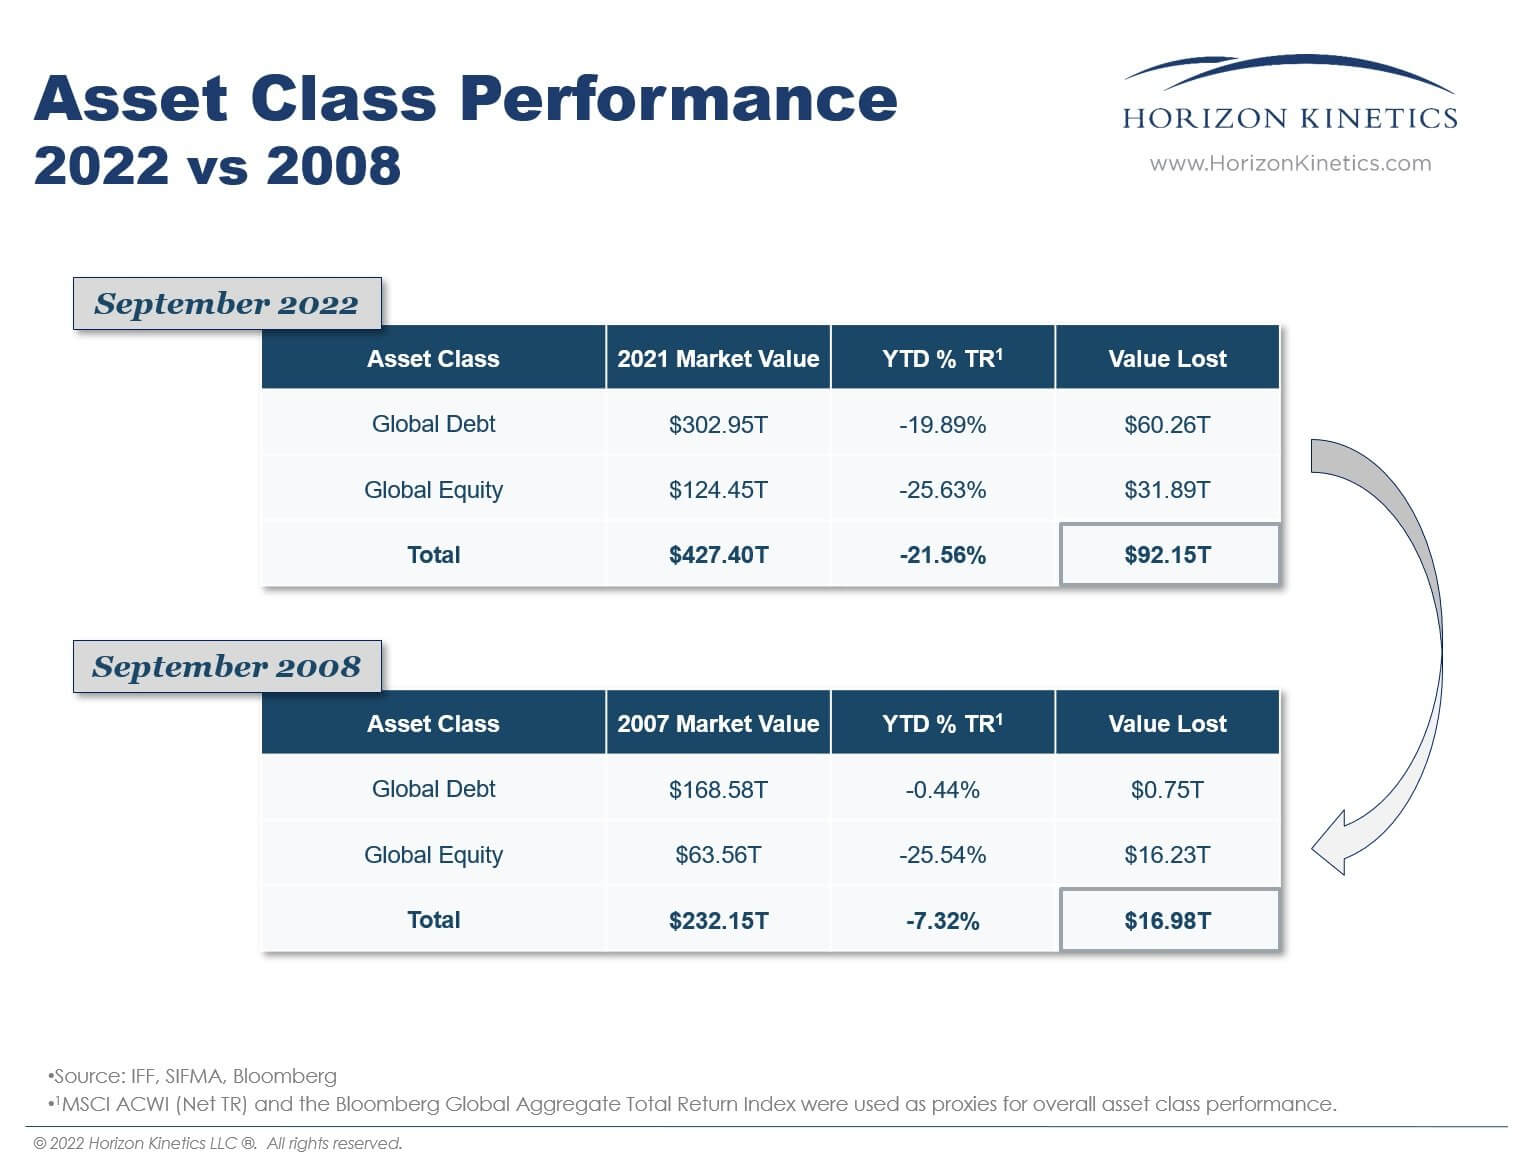
The year 2022 will be referred to as wealth destruction; $ 92.15tn has been wiped out across global stocks and bonds, which dwarfs 2008 by a factor of 6.
Commodities
The smart central banks are accumulating gold
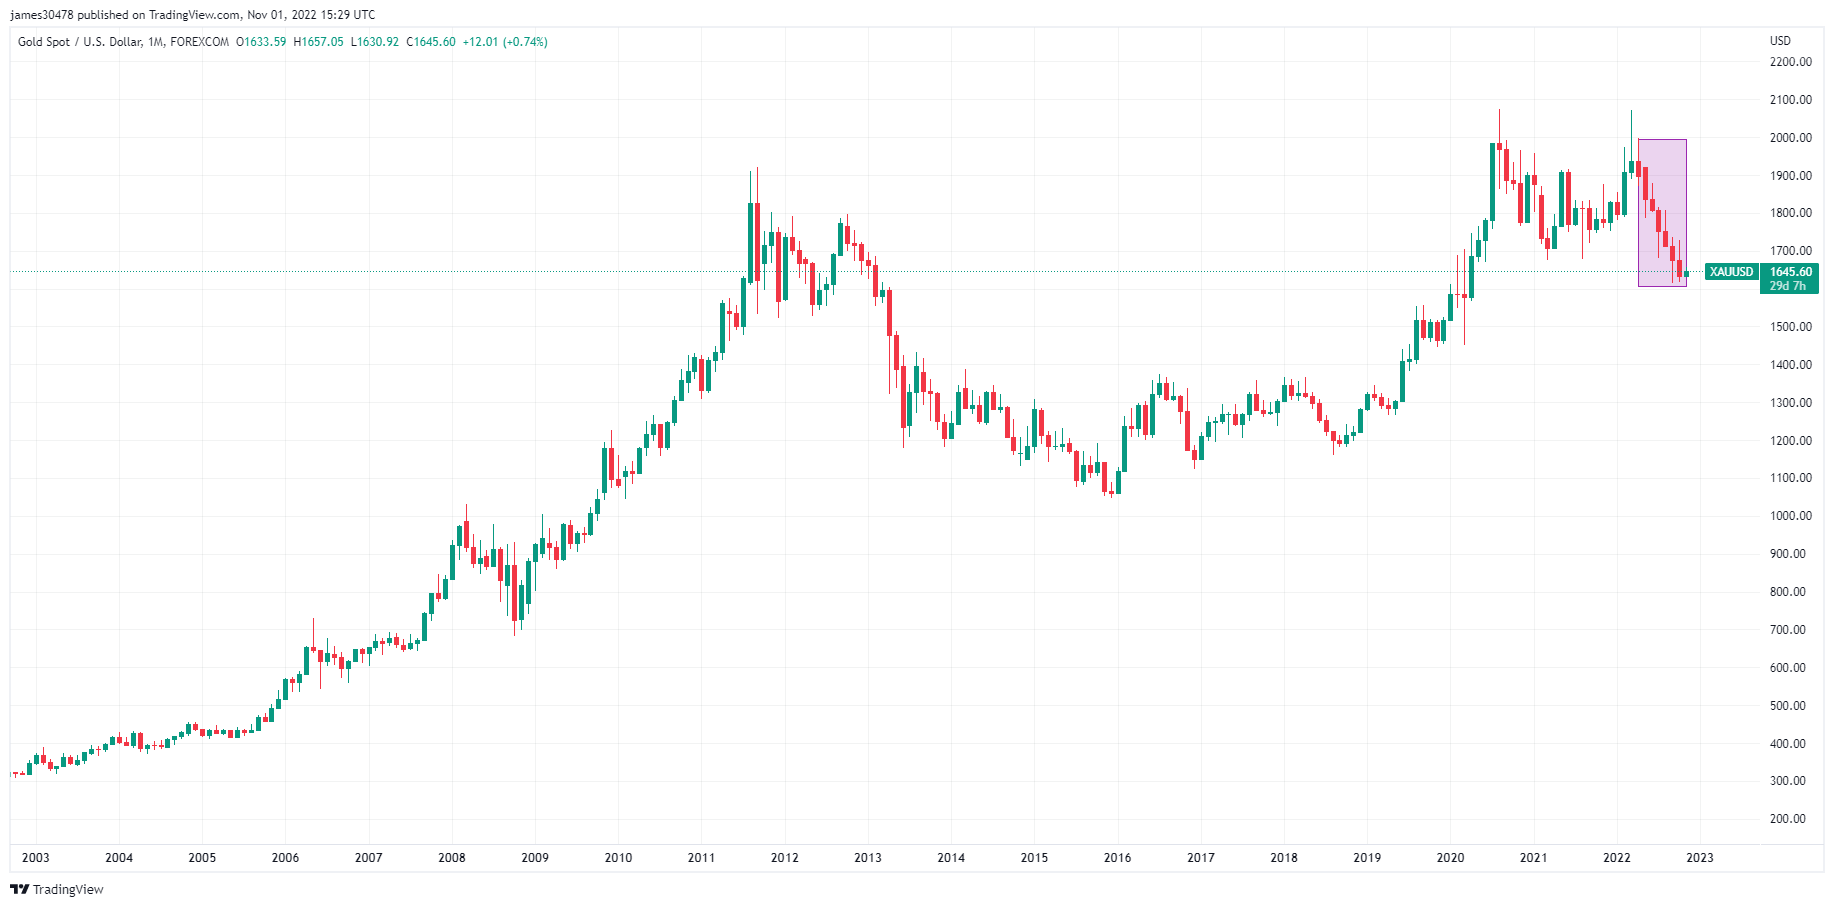
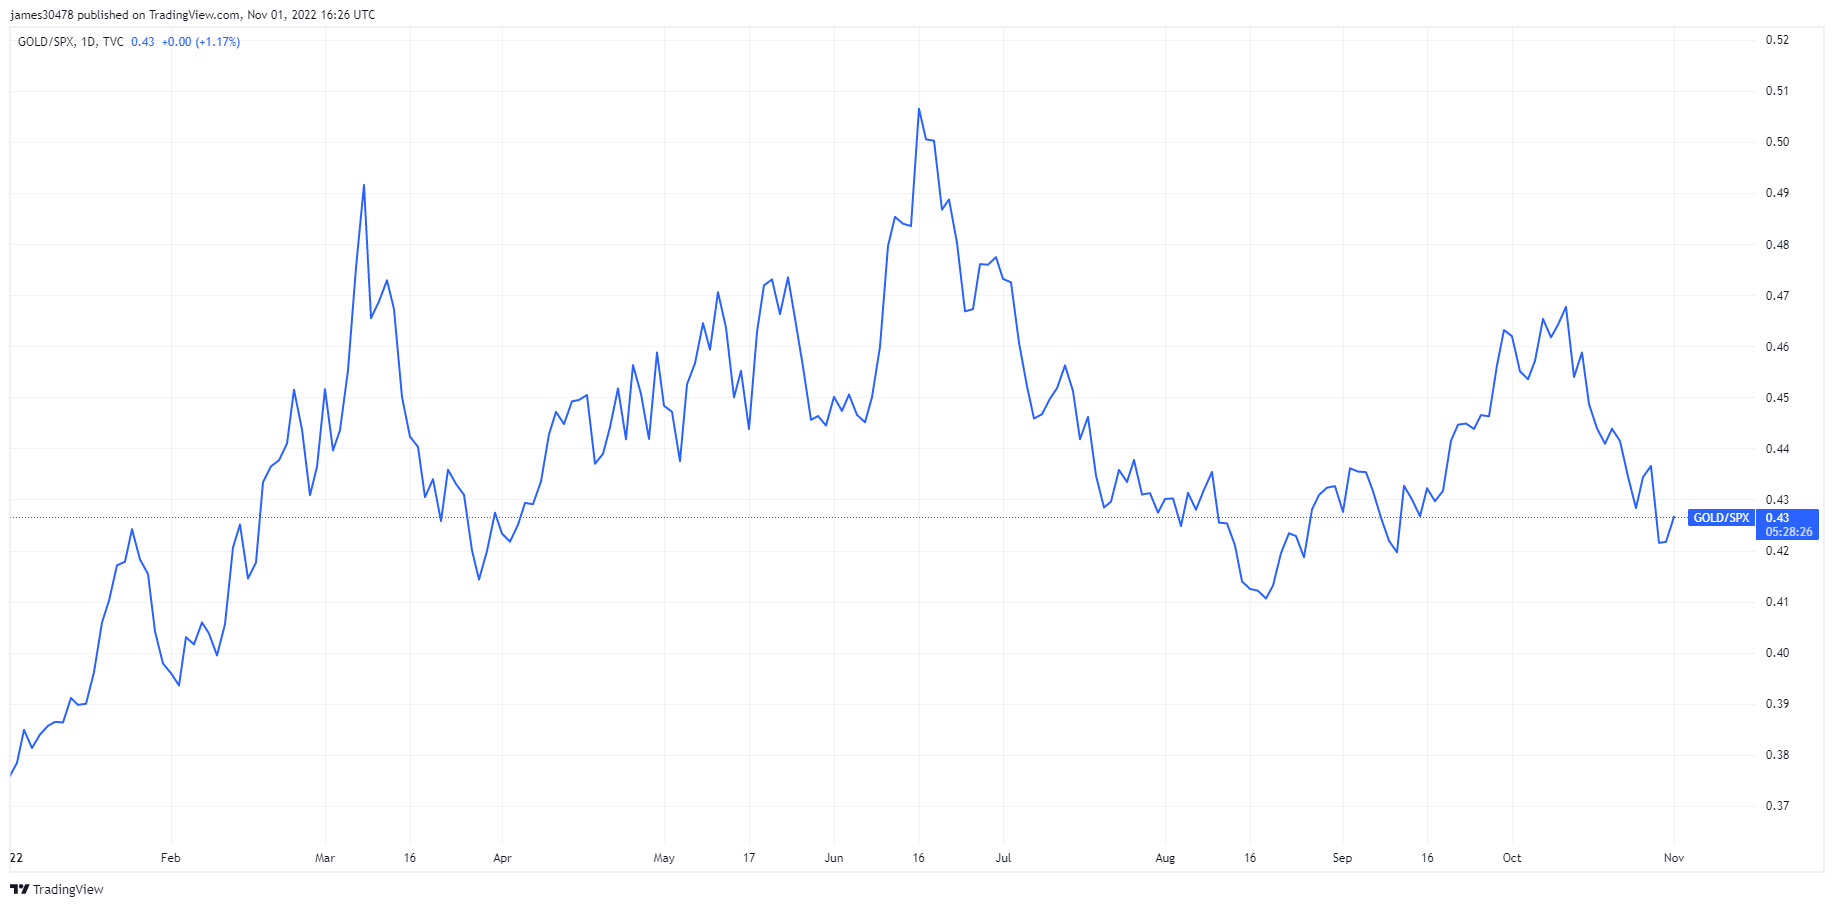
Gold is trading roughly for $1,645, which is in a similar price range to the highs in 2011 and 2012. Gold has been marveled as an asset to hold during uncertain times; however, it has not performed in 2022 but is that about to change?
Gold is currently 9% down year-to-date against the dollar, and for the first time in its history, it has marked seven red monthly candles in a row. This has never occurred in gold’s history.
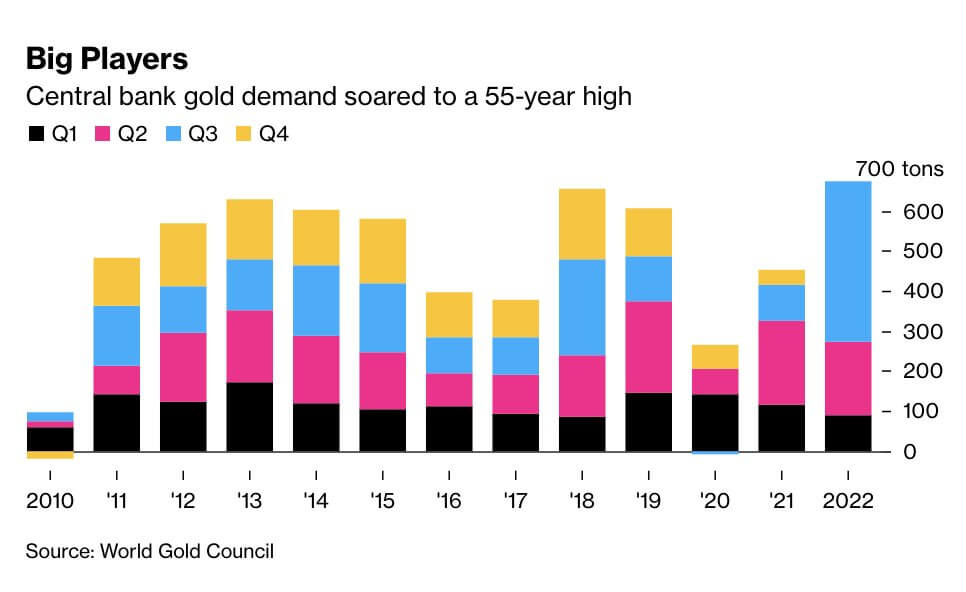
However, with the credit system tightening and inflation running riot. Central banks have accumulated a whopping amount of Gold in Q3 of 2022, 399 tonnes, around $20bn. Which saw gold demand soar to a 55-year high. Purchases are up 338% compared to Q3 of 2021. Meanwhile, sovereign debt has had its worst year in decades, putting further strains on the fiat monetary system.
“It did not give any details on which countries these could be, but banks that do not regularly publish information about their gold stockpiles include those of China and Russia…” – Reuters.
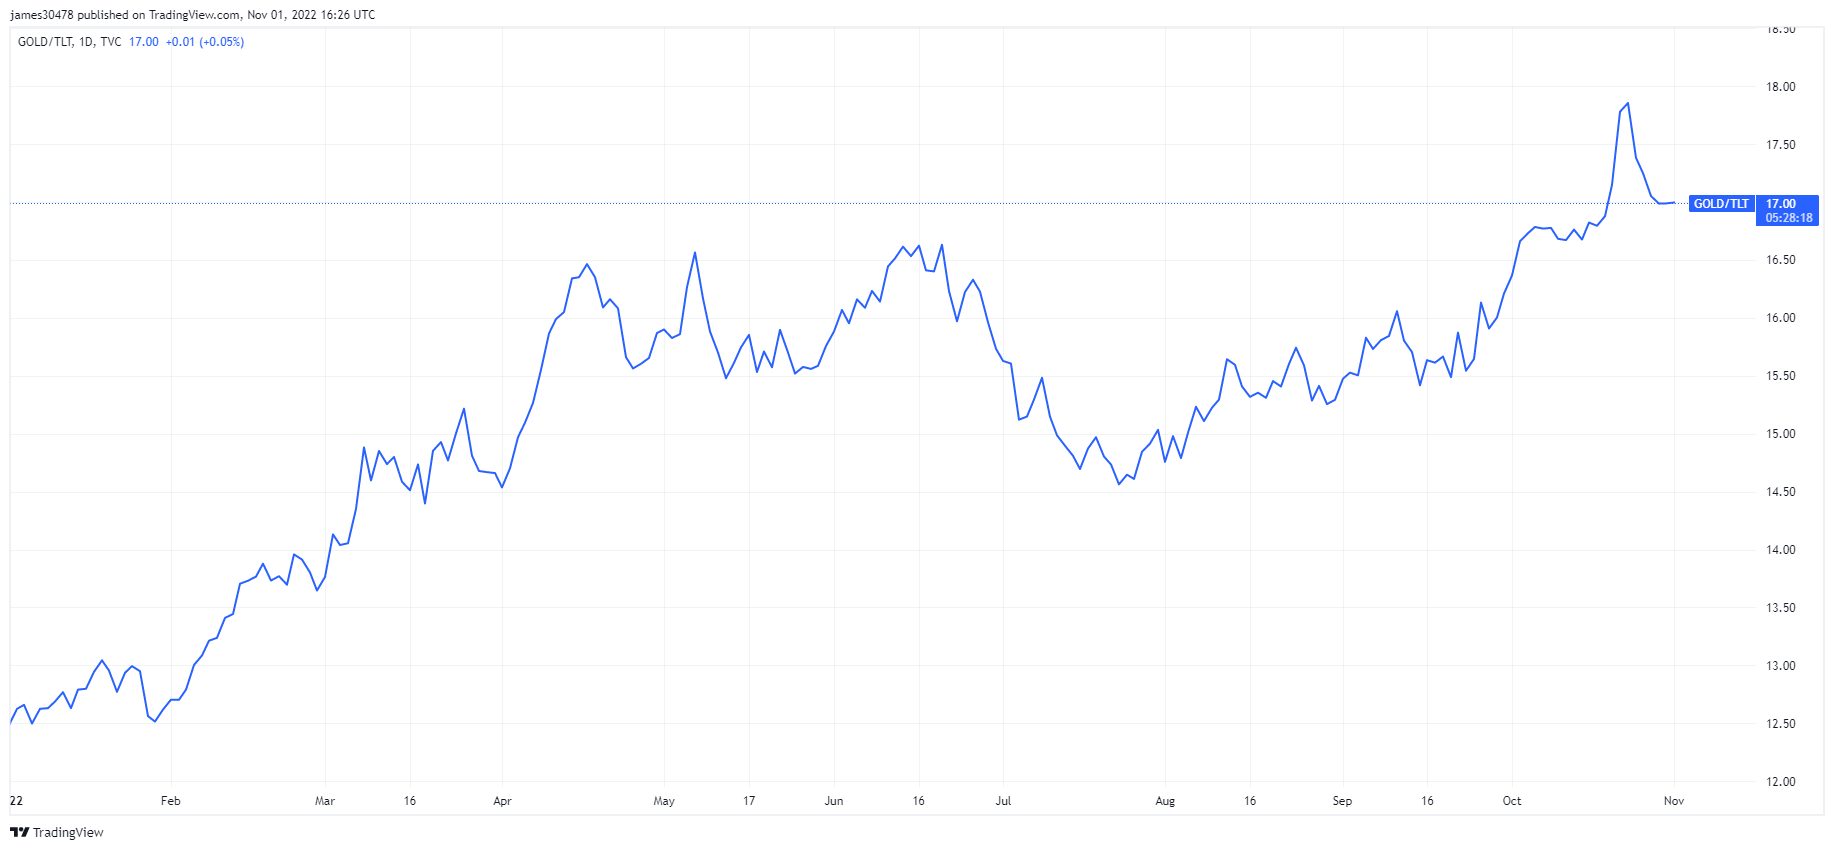
However, many similarities occur between gold and Bitcoin through manipulation of the paper and derivatives markets”, which is why Gold Bugs and Bitcoiners purchase physical gold and secure custody of their Bitcoin. However, despite a strong dollar crushing all assets this year, gold has still done better than equities and long bonds.
Rates & Currency
The 3-month T-Bill yield inverts with the 30-year-long bond
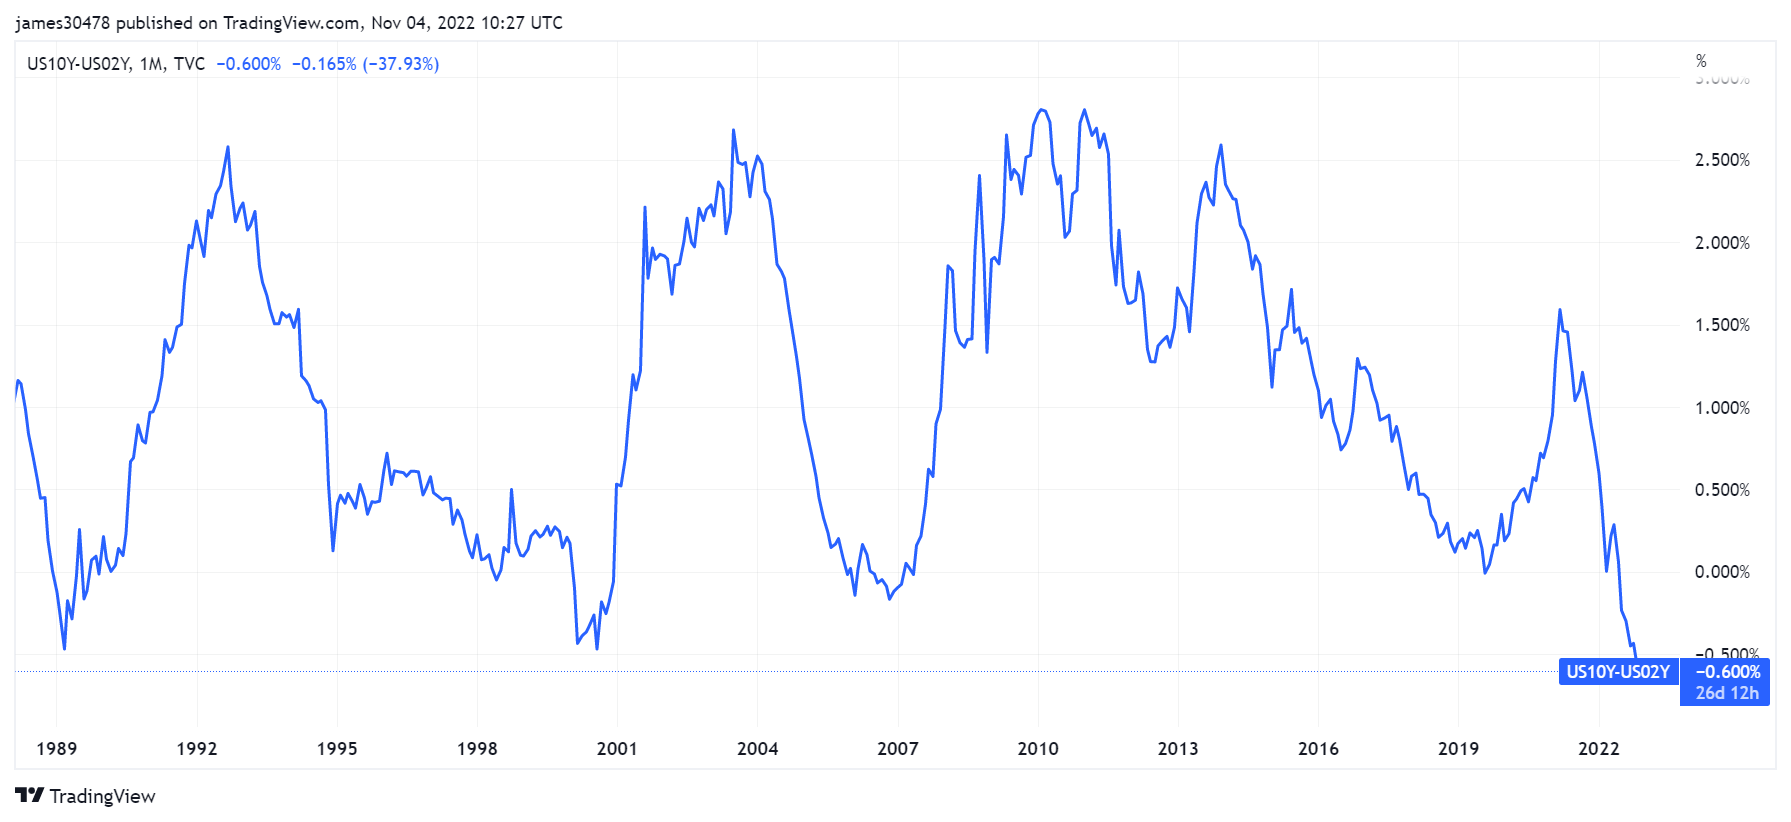
US recession forecasts have been ten a penny this year, with the slope of the treasury curve being cited as a forward-looking indicator of slower growth. Still, the spread between two and ten-year yields tracks the unemployment rate. Recessions typically start from the point when unemployment reaches its lows, but the treasury curve is more of a coincident indicator than a predictor.
The spread between the ten and two-year yields has been negative for most of 2022, currently at whooping -0.6%, but the spread between the 10yr and 3m rates (the preferred measure by the fed) turned negative for the first time this cycle, Oct. 26.
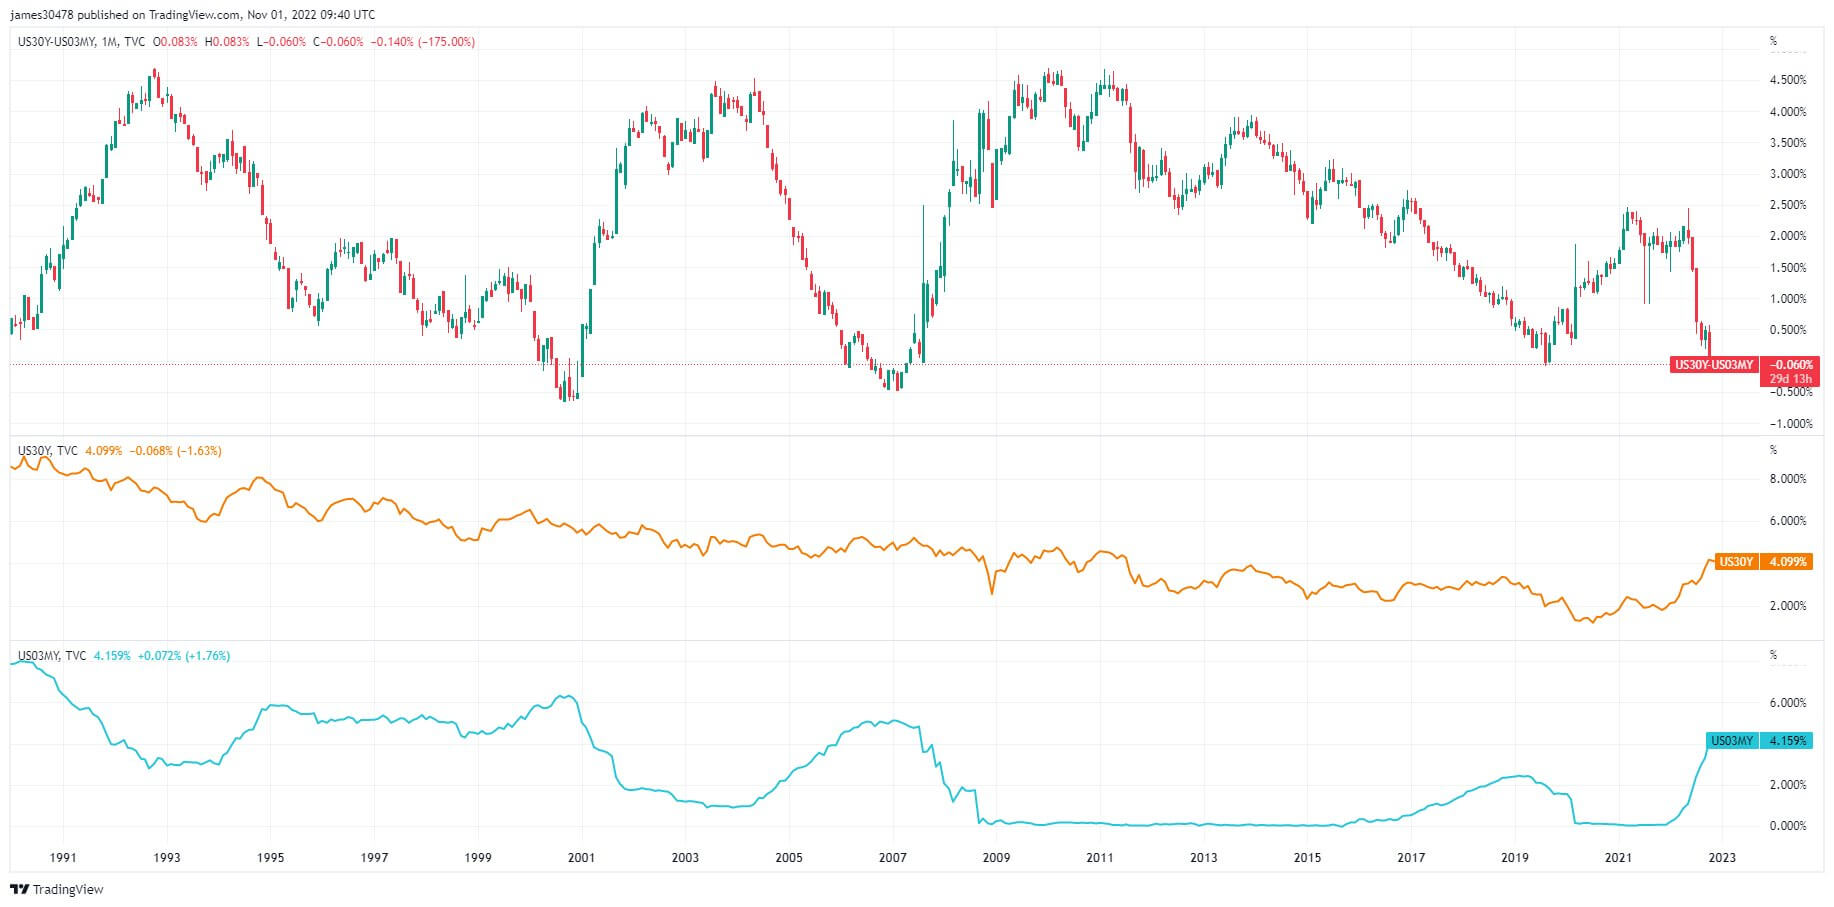
As of Nov. 1, the 3-month T-Bill Yield inverts with the 30-year-long bond; as an investor, you would get a higher return on a three-month treasury than the 30-year-long bond. This has only occurred four times in history; 2000, 2007, 2020, and 2022. A recession is imminent, but the severity or magnitude of this recession is unknown.
Bitcoin Overview
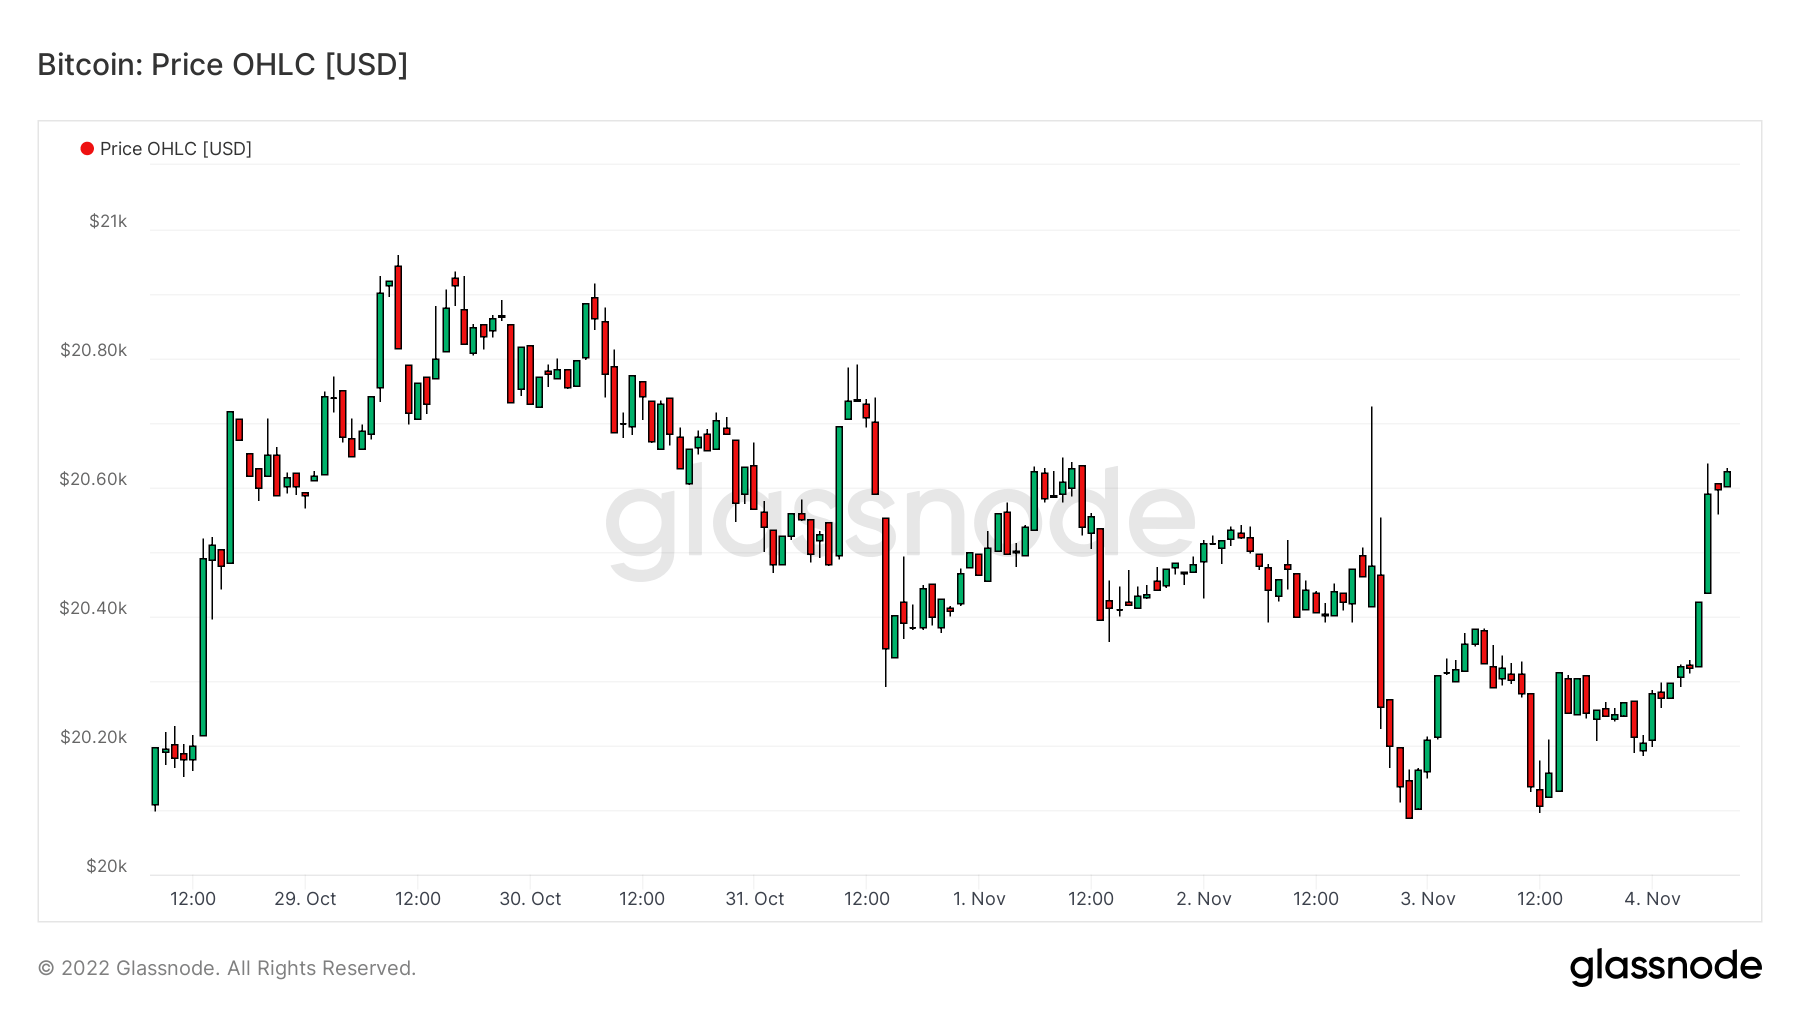
- Bitcoin remains flat for the week trading around $20k
- Bitcoin hash rate continues to explode higher approaching 300 EH/s
- Mining difficulty projected to increase for the third consecutive positive adjustment
- Miners continue to feel the stress as Argo joins the list of troubled miners
Addresses
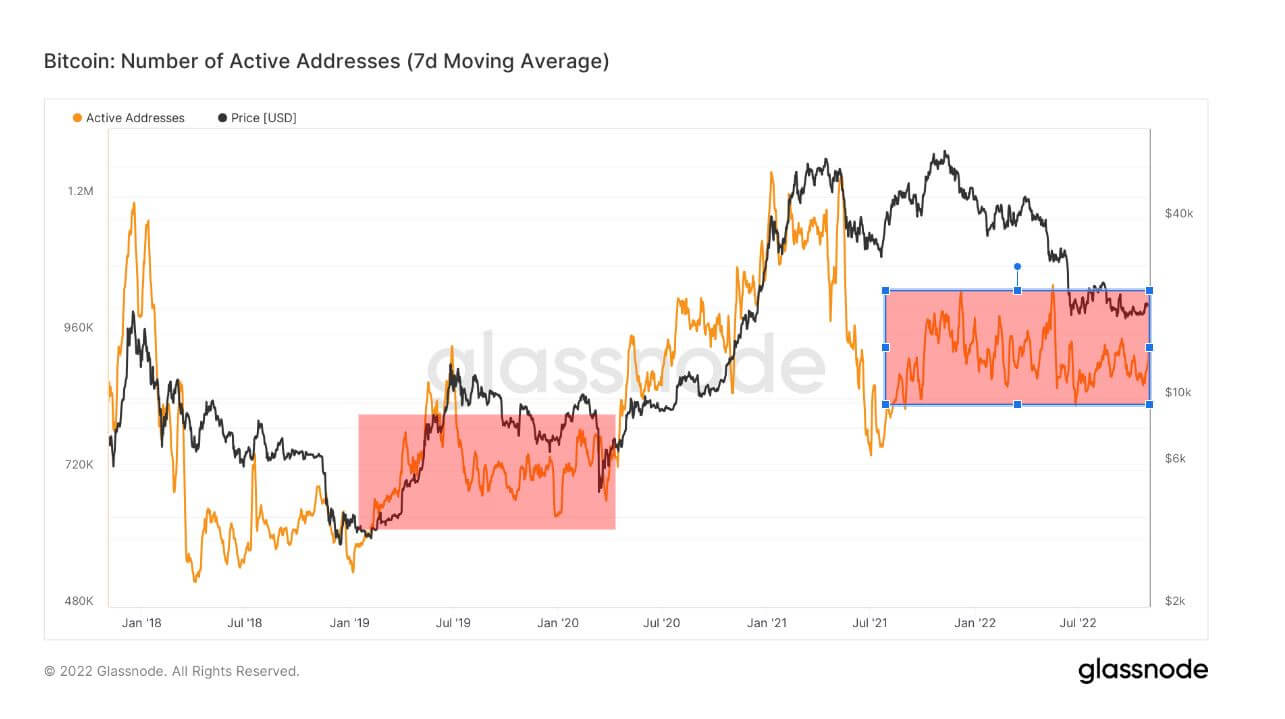
Collection of core address metrics for the network.Active addresses remain flat amid the bear market
The number of unique addresses active in the network either as a sender or receiver. Only addresses that were active in successful transactions are counted.
Active addresses have remained relatively stagnant since May 2021, suggesting the bear market started around then. Currently, the Bitcoin network has just under a million active addresses, which is considerably higher than the previous bear market in 2018, which had roughly 500k-600k active addresses. It is encouraging to see a higher high in each bear market cycle as new participants enter the ecosystem.
However, this past week we have seen a notable increase in active and new addresses, which suggests new participants are entering the ecosystem.
Retail accumulation has gone quiet
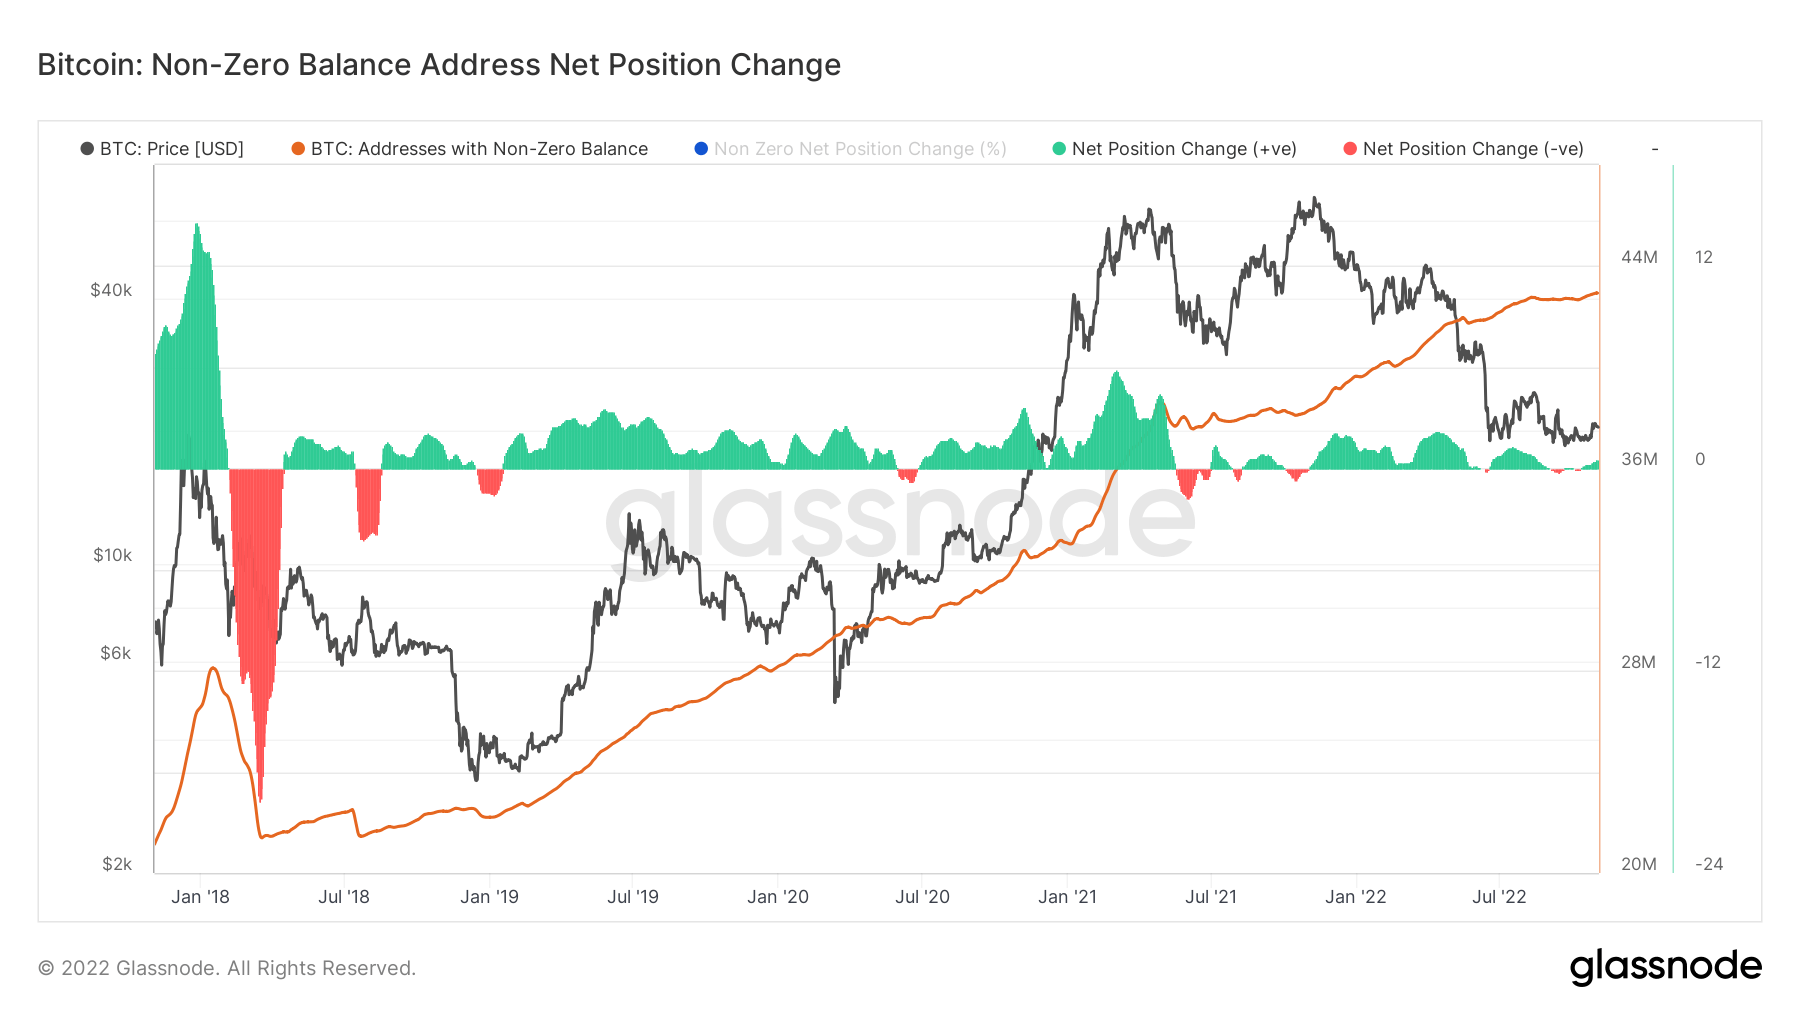
A balance of non-zero addresses implies a minimal amount of BTC in their wallets and suggests retail are the holders who have just started their journey in the Bitcoin adventure.
The growth rate for non-zero balance has stalled since August, which is similar to the previous bear market cycle in 2018. This assumes the appetite for this cohort is not to accumulate. However, it is encouraging to see them not selling either and perhaps wait for the macro uncertainty to become clearer.
Entities
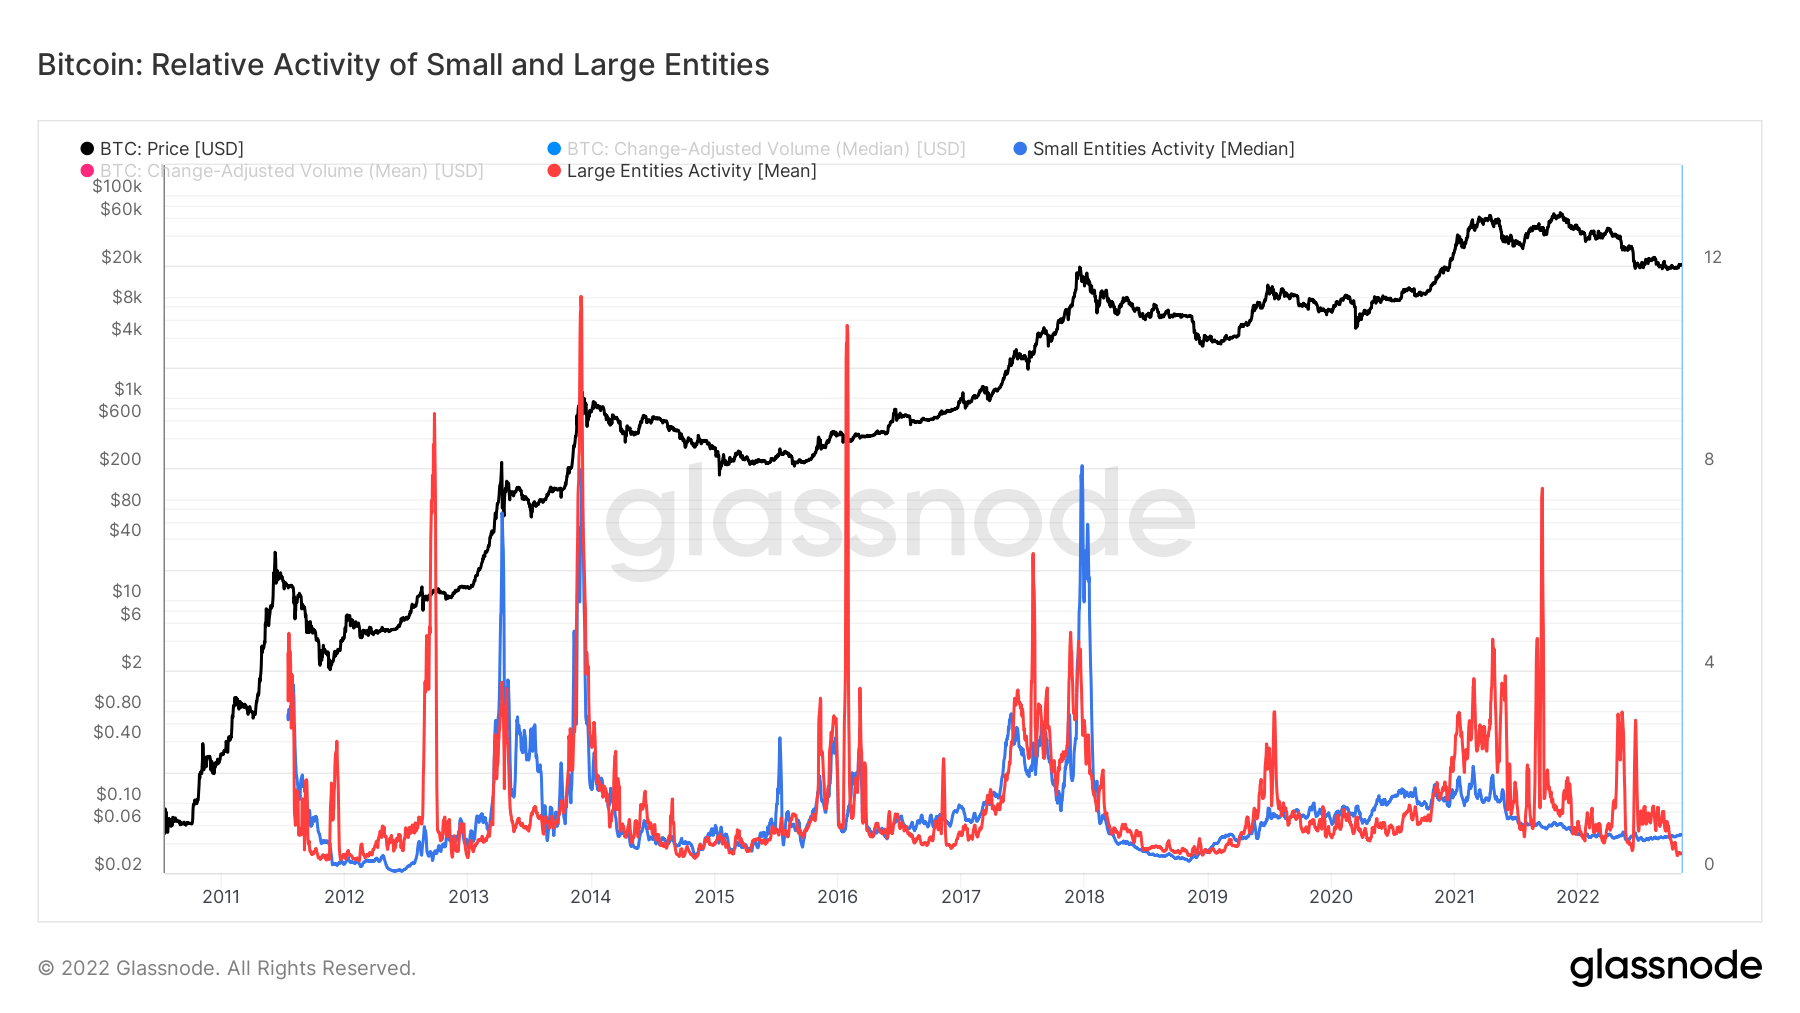
Entity-adjusted metrics use proprietary clustering algorithms to provide a more precise estimate of the actual number of users in the network and measure their activity.Muted bear market
- When small entities 🔵 exceed large entities 🔴, it typically suggests an influx of small size transactions and is often associated with the excitement of bull markets and greater speculation.
- When the indicators are increasing, it can be considered to be a signal of higher demand from the relevant entities.
- When the indicators are decreasing, it can be considered to be a signal of lower demand from the relevant entities.
Looking at the trend of both small and large entities, they are at the lower level with a decreasing trend, which is similar to previous bear market cycles. Large entities have dropped considerably, which assumes interest is not prevalent. In contrast, smaller entities have stayed stagnant, which is in line with active addresses, non-zero balance, and price staying flat.
Miners
Overview of essential miner metrics related to hashing power, revenue, and block production.Miners continue to sell
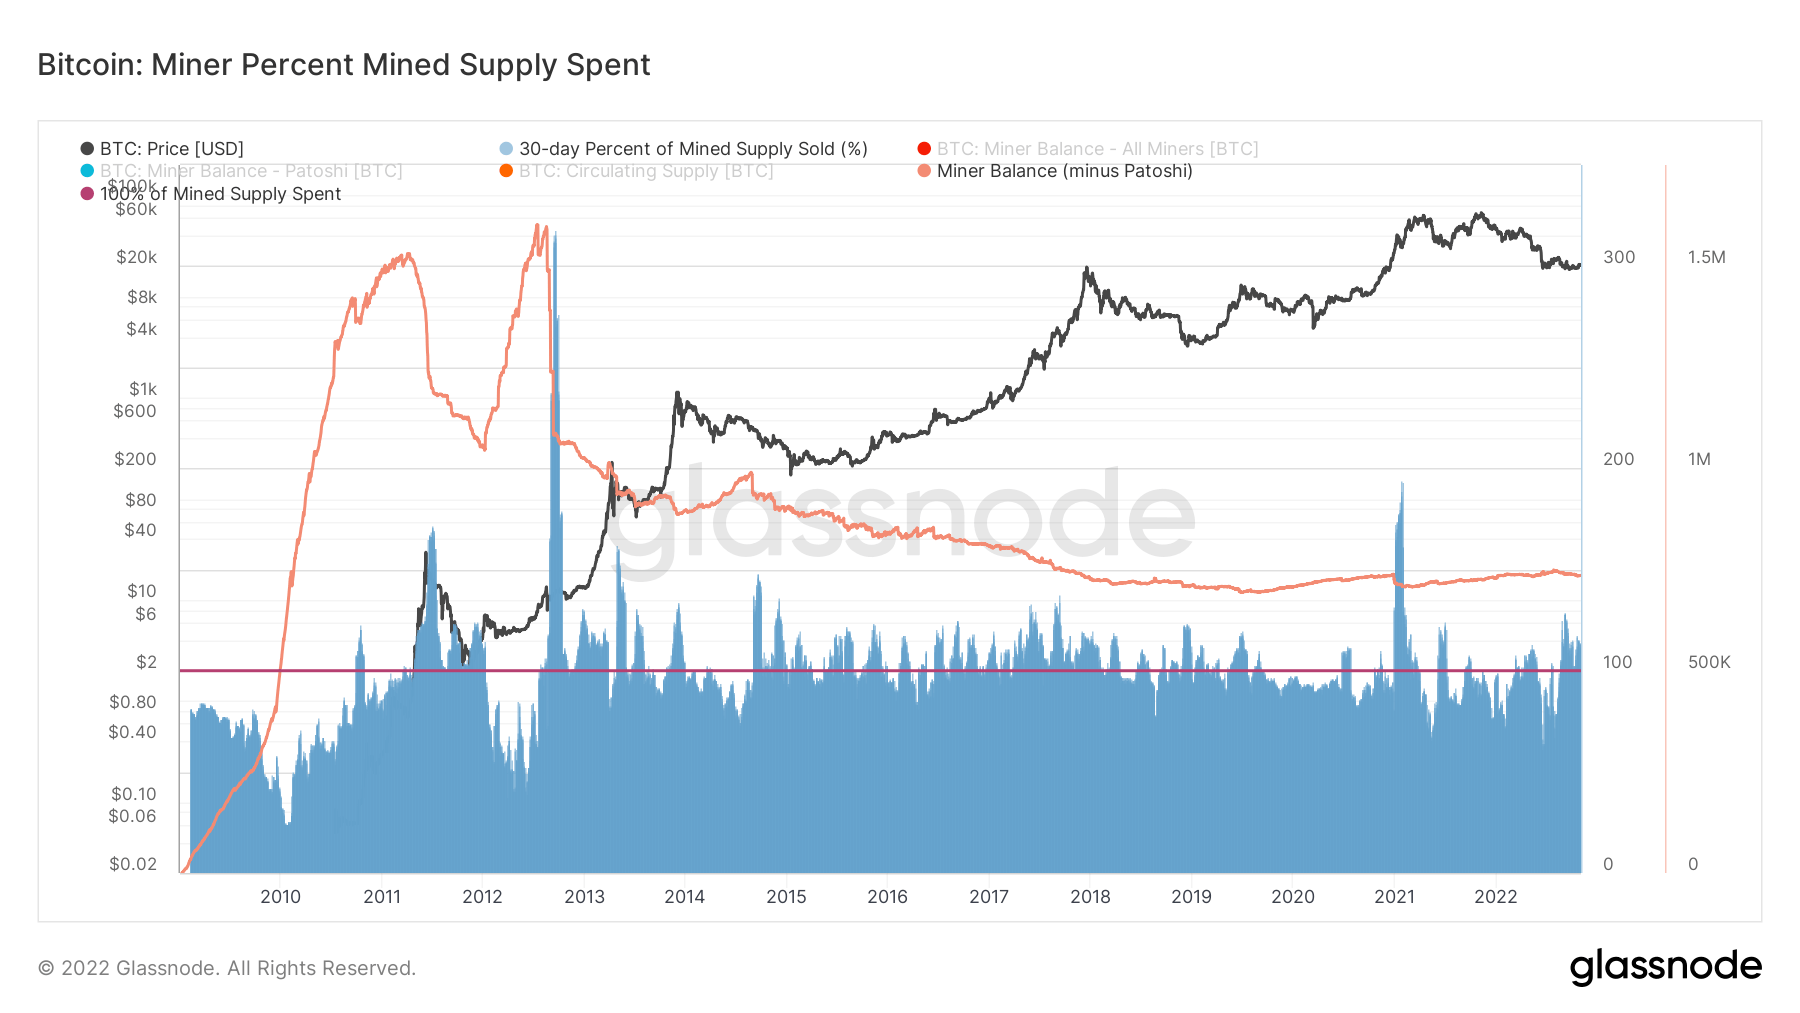
This metric provides an estimate of the percent of mined supply which is spent by the mining cohort over a 30-day window. Due to the competitive, and capital intensive nature of the mining industry, miners have historically needed to distribute a majority of the coins mined to cover input costs.
The model compares the 30-day change in miner balance, to the 30-day total issuance in order to assess the proportion of mined coins that are spent in aggregate.
- Values = 100% indicate that in aggregate, a volume of coins equal to the total mined supply was spent.
- Values < 100% indicate that miners are retaining a portion of mined supply in treasury reserves.
- Values > 100% indicate that miners are distributing coins in excess of the mined supply, and are thus depleting treasury reserves.
In previous macroslate reports, miners have been a hot topic of discussion due to hash rate and mining difficulty squeezing miner profits. October public updates have shown that miners such as Core Scientific and Argo have shown they are in a period of distress and miners to keep their heads afloat are selling and distributing coins in excess of mined supply and going into their treasury reserves.
On-Chain Activity
Collection of on–chain metrics related to centralized exchange activity.Transfer volume at year lows
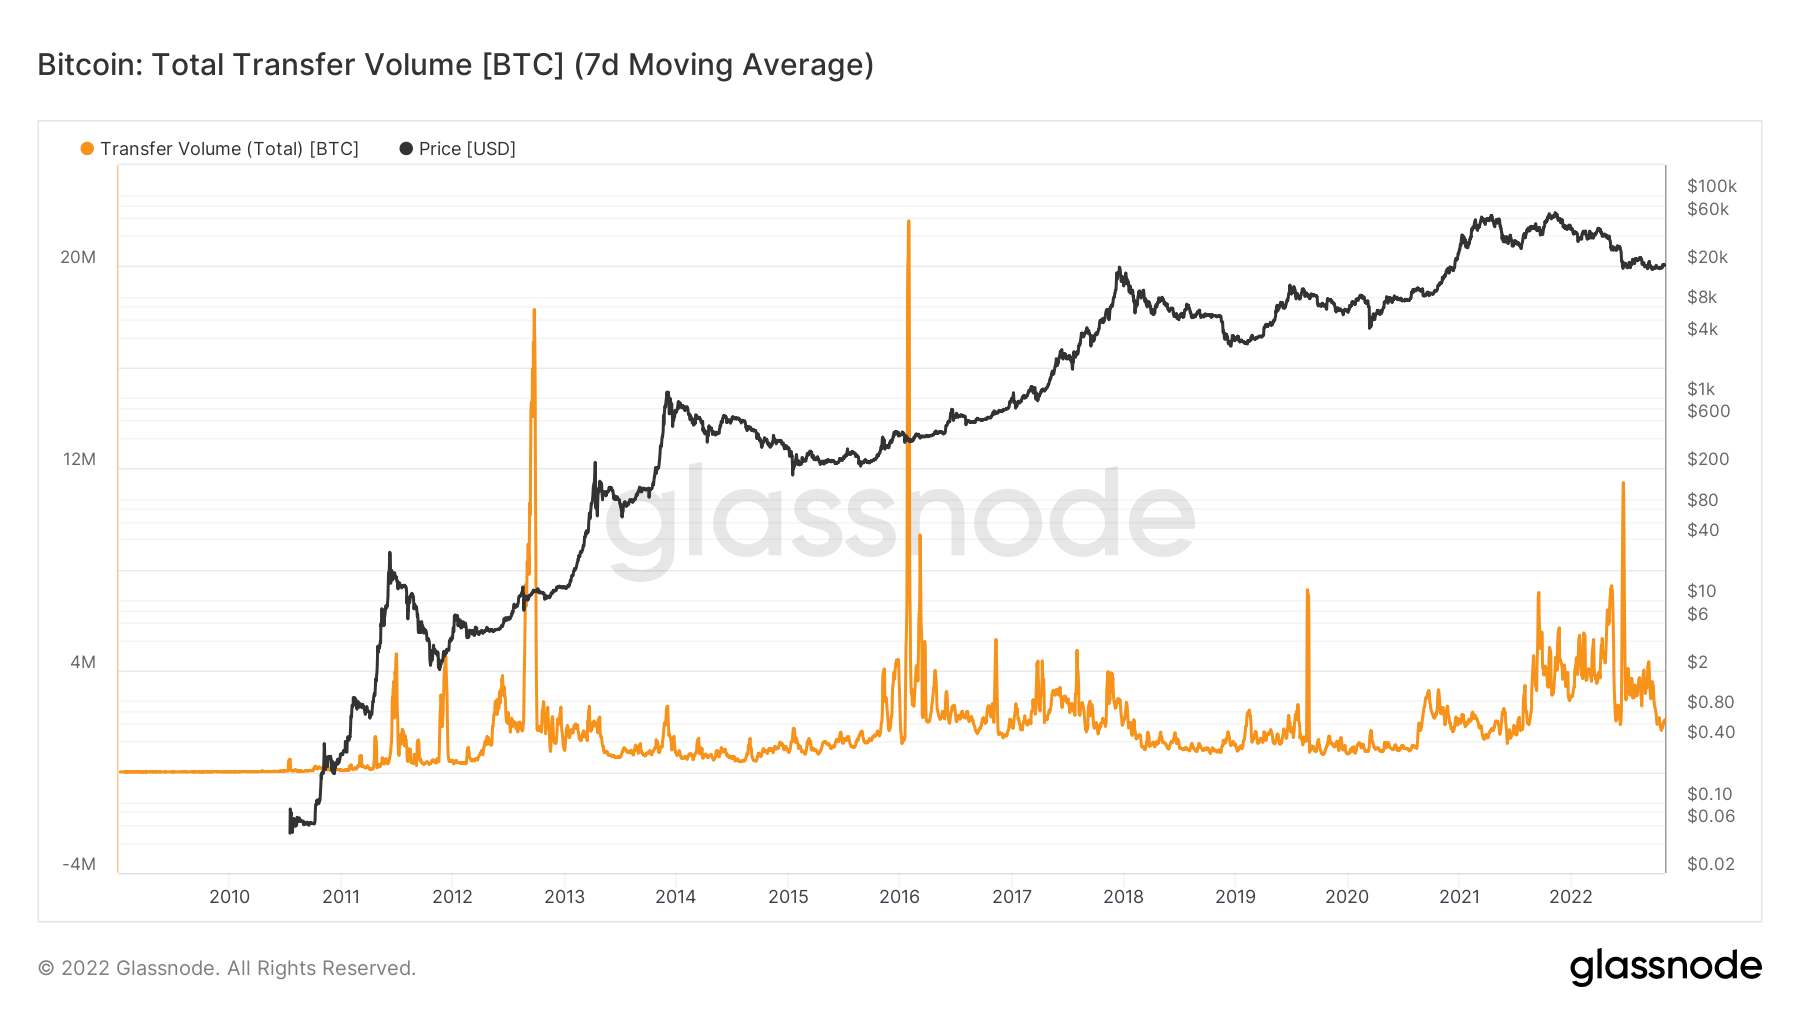
Transfer volume is the total amount of coins transferred on-chain. Only successful transfers are counted.
This metric had put in a new cycle low which sees just under 2 million coins for transfers, showing little interaction with the network and back to similar levels in May-June 2021 when the China ban occurred. Total transfer volume has seen almost a 50% drop; it was over 4 million BTC in early September.
Mempool resurgence
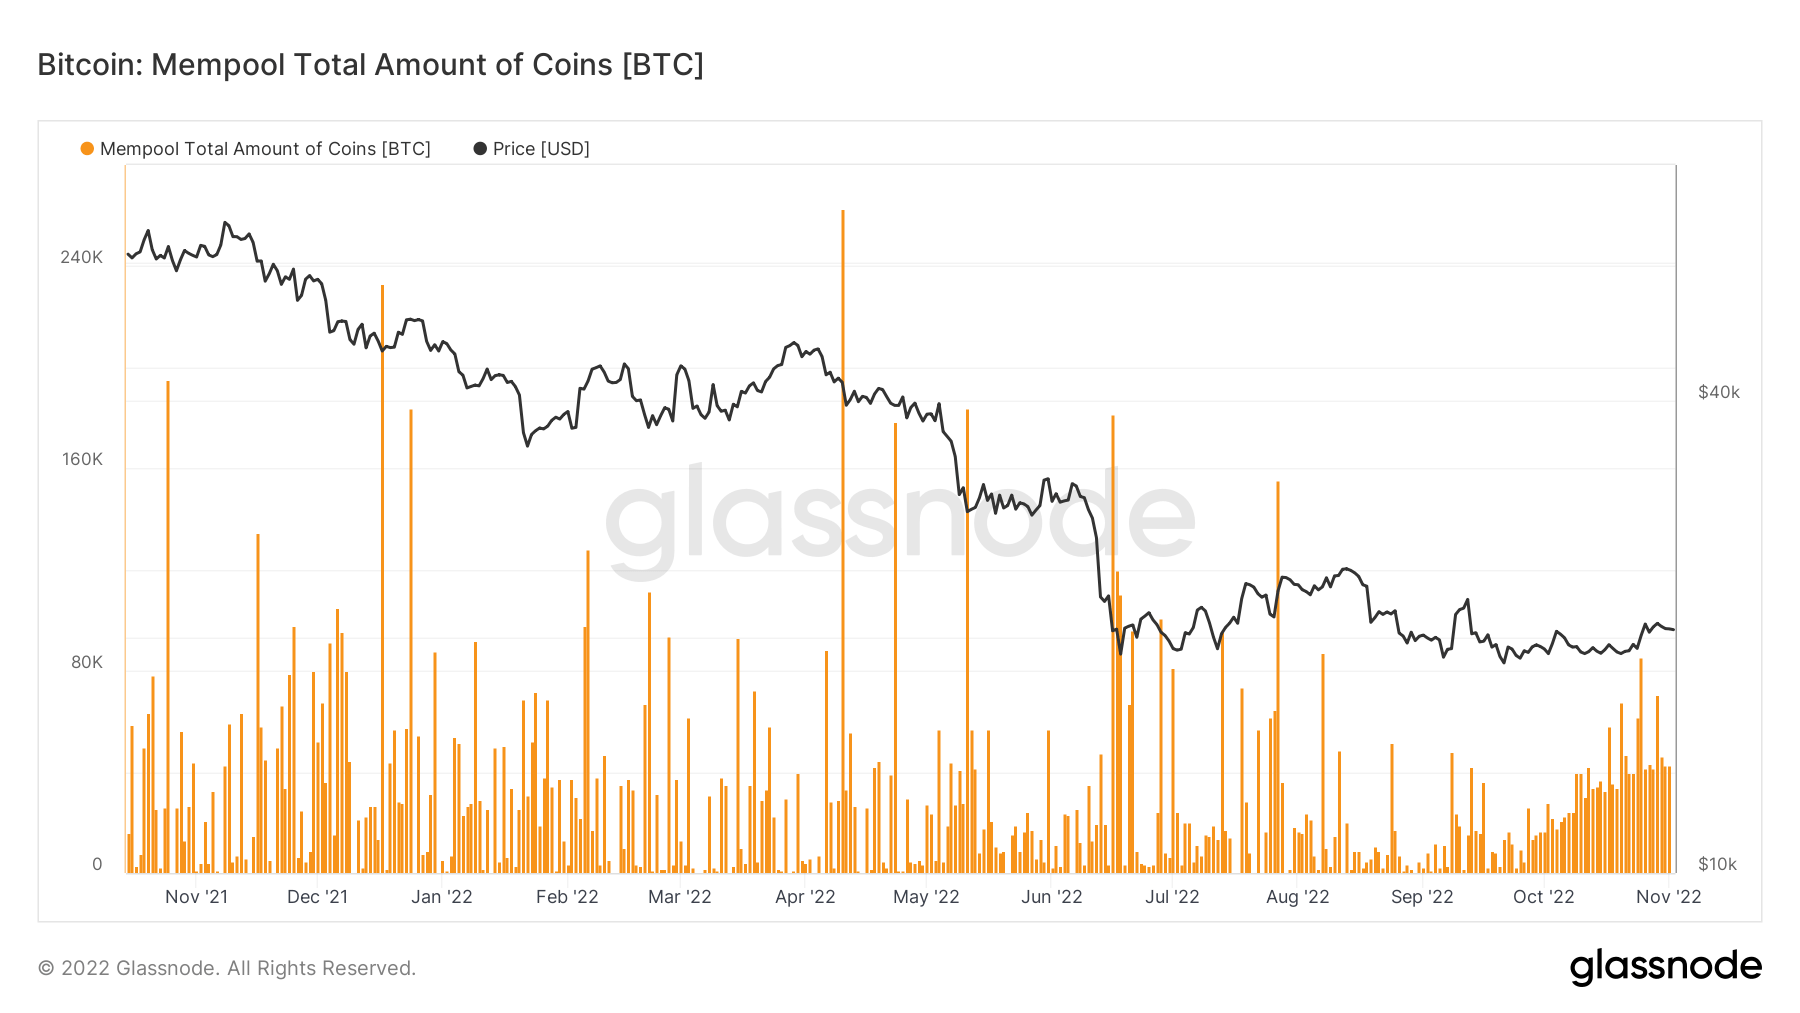
However, a slight resurgence in the mempool. The total amount of coins in transactions waiting in the mempool. Over 40k BTC is waiting in the mempool, which has stayed consistent for the entirety of October, which is encouraging to see.
Supply
The total amount of circulating supply held by different cohorts.Supply in loss
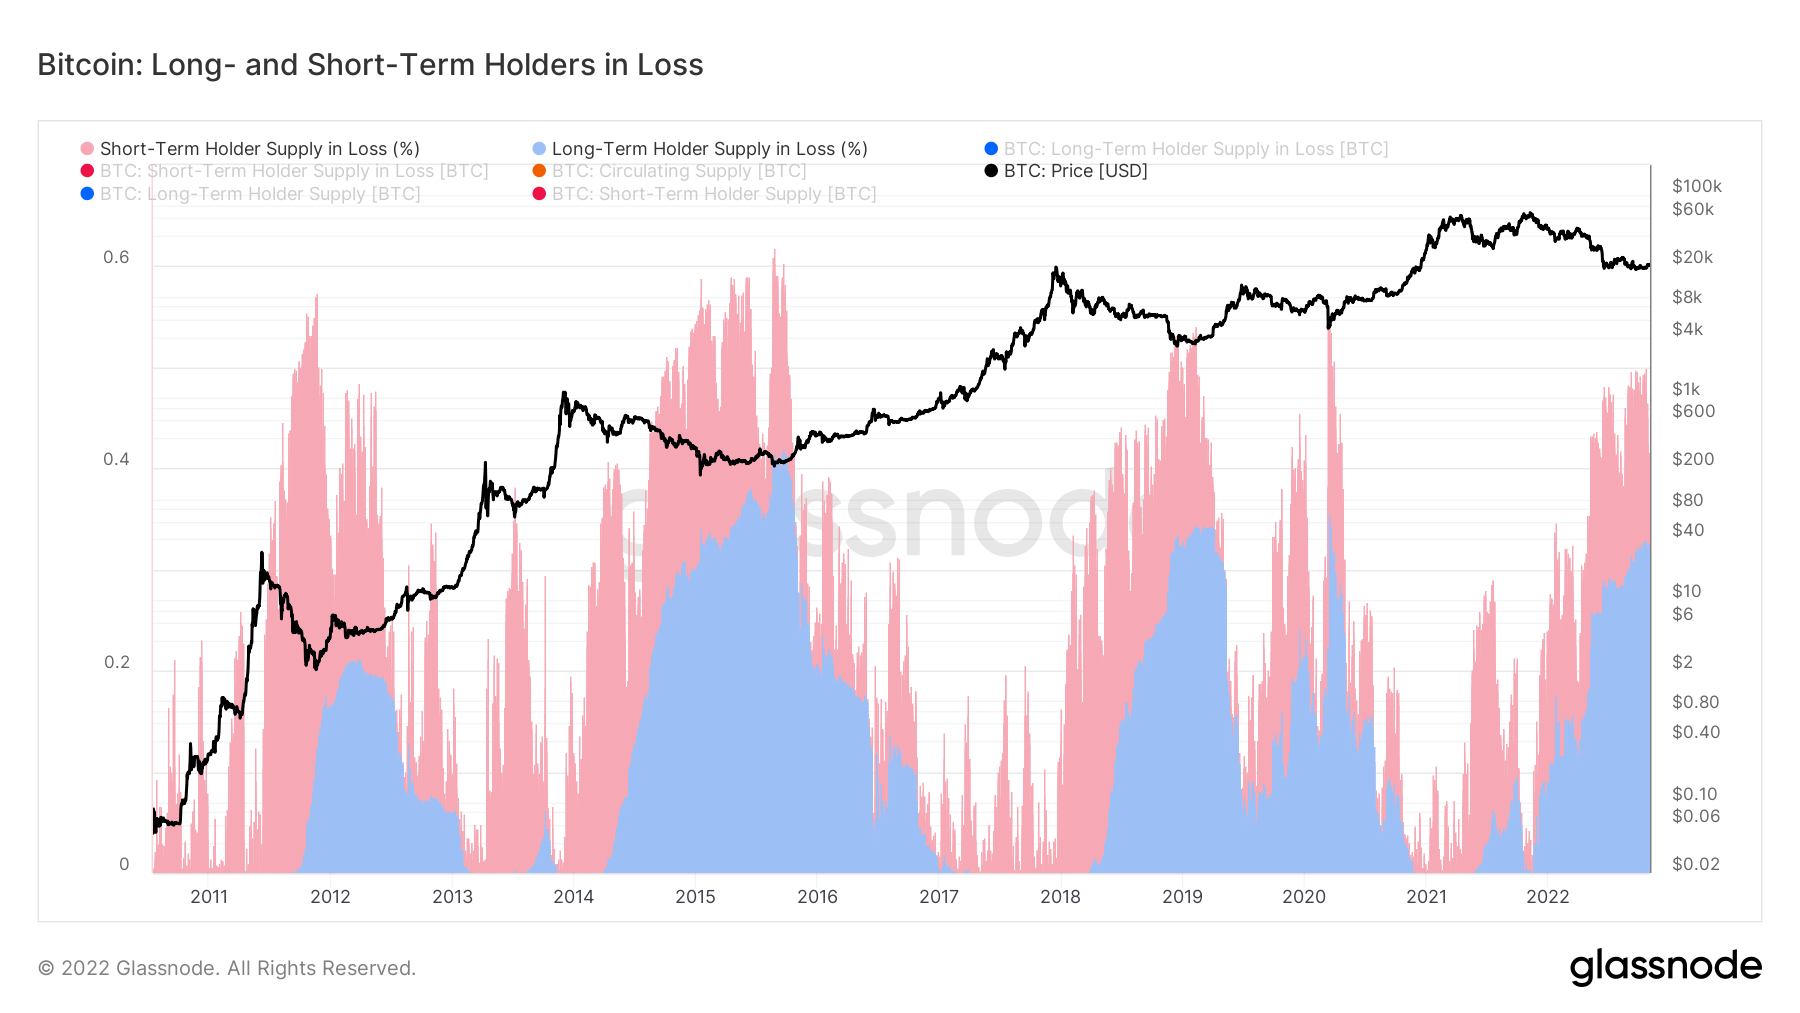
This metric provides a breakdown of the percent of supply that is in loss and held by Long-Term Holders (blue) and Short-Term Holders (red). Supply is defined as Long-Term Holder Supply plus Short-Term Holder Supply (both of which exclude Supply held on Exchanges).
Each prior bear market cycle has seen STHs at a loss of 50% or more; as of Oct. 20, this occurred, which is in line with 2012, 2015, 2018, and 2020. LTH loss is currently at 34%, similar to the 2018 cycle but not the same magnitude as 2015.
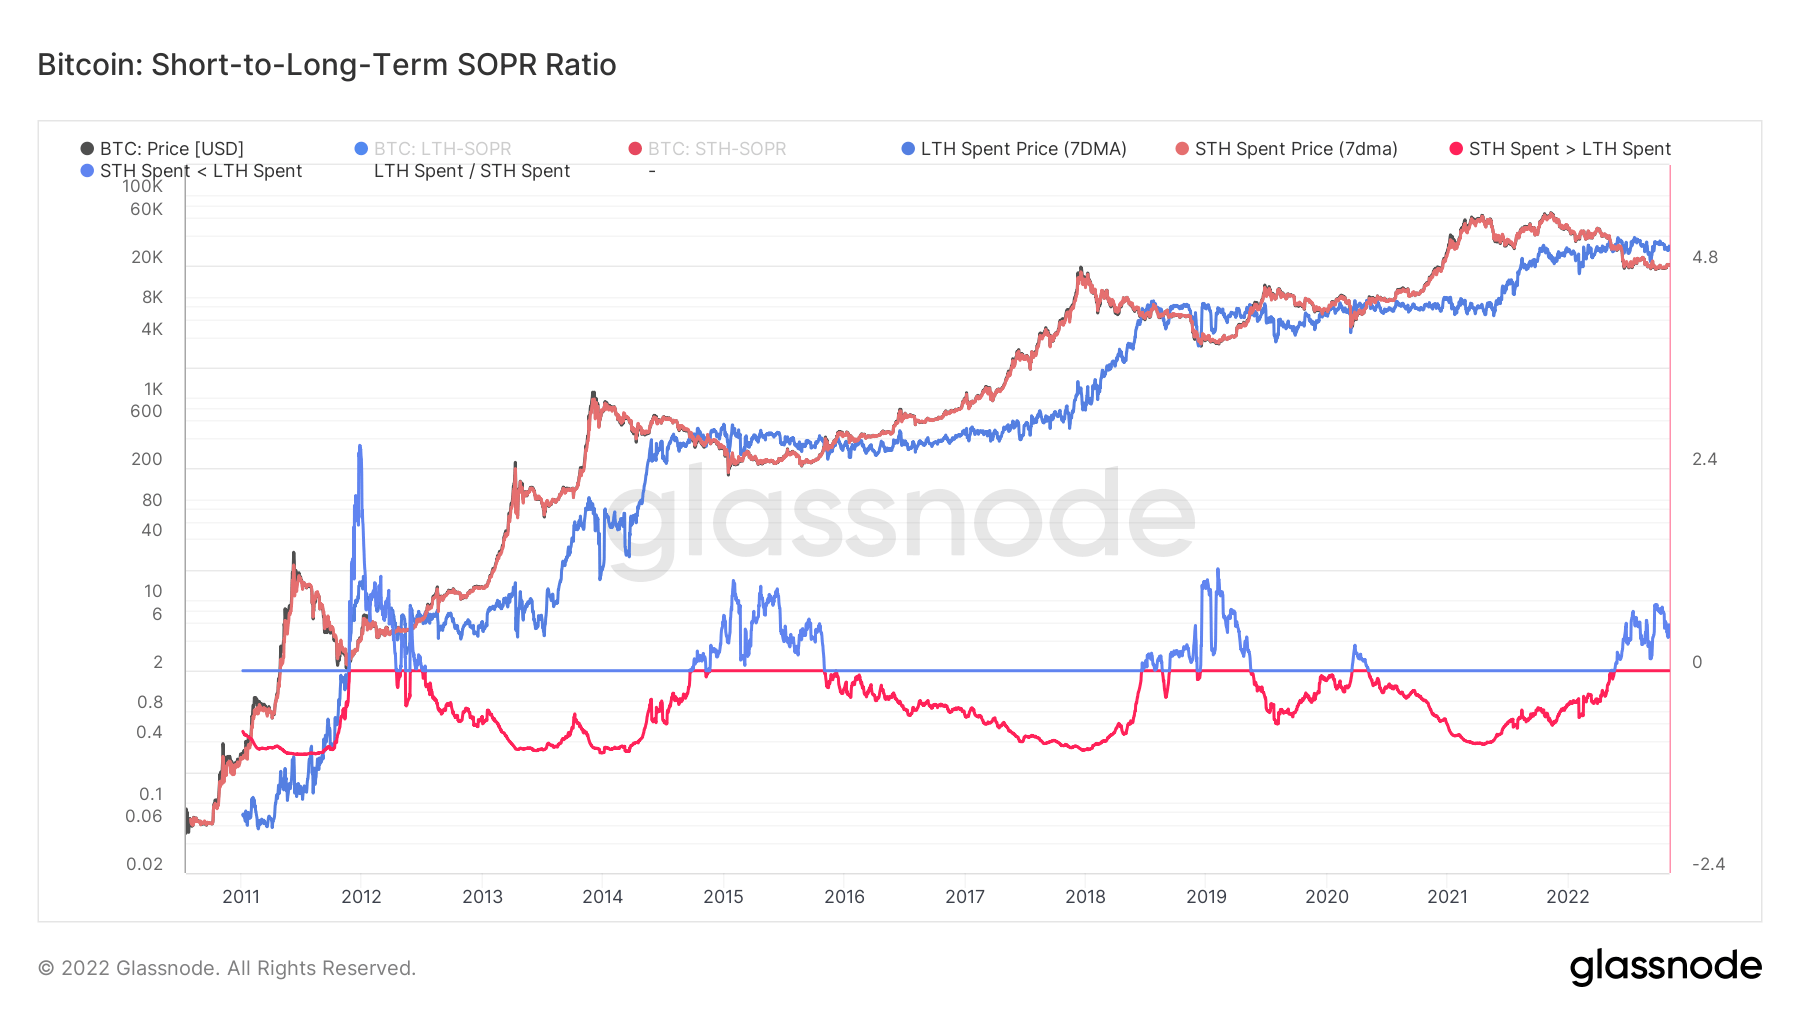
Late-stage bear market
The Short-to-Long Term Holder SOPR Ratio is a model that compares the average profit multiple and, thus, the cost basis of coins spent each day.
- Negative Values in red indicate that the average realized profit multiple for the STH cohort is lower than that of the LTH cohort. This is typical in bull markets where longer-term investors enjoy high-profit multiples.
- Positive Values in blue indicate that the average realized profit multiple for the STH cohort is higher than that of the LTH cohort. This is typical in late-stage bear markets, where LTHs comprise cycle top buyers underwater on their holdings.
The ratio turned from red to blue during the luna collapse back in May 2022, in previous bear market cycles where the cycle has been blue have seen at least a year with STHs underwater and witnessing a transition of more coins to LTHs.
Cohorts
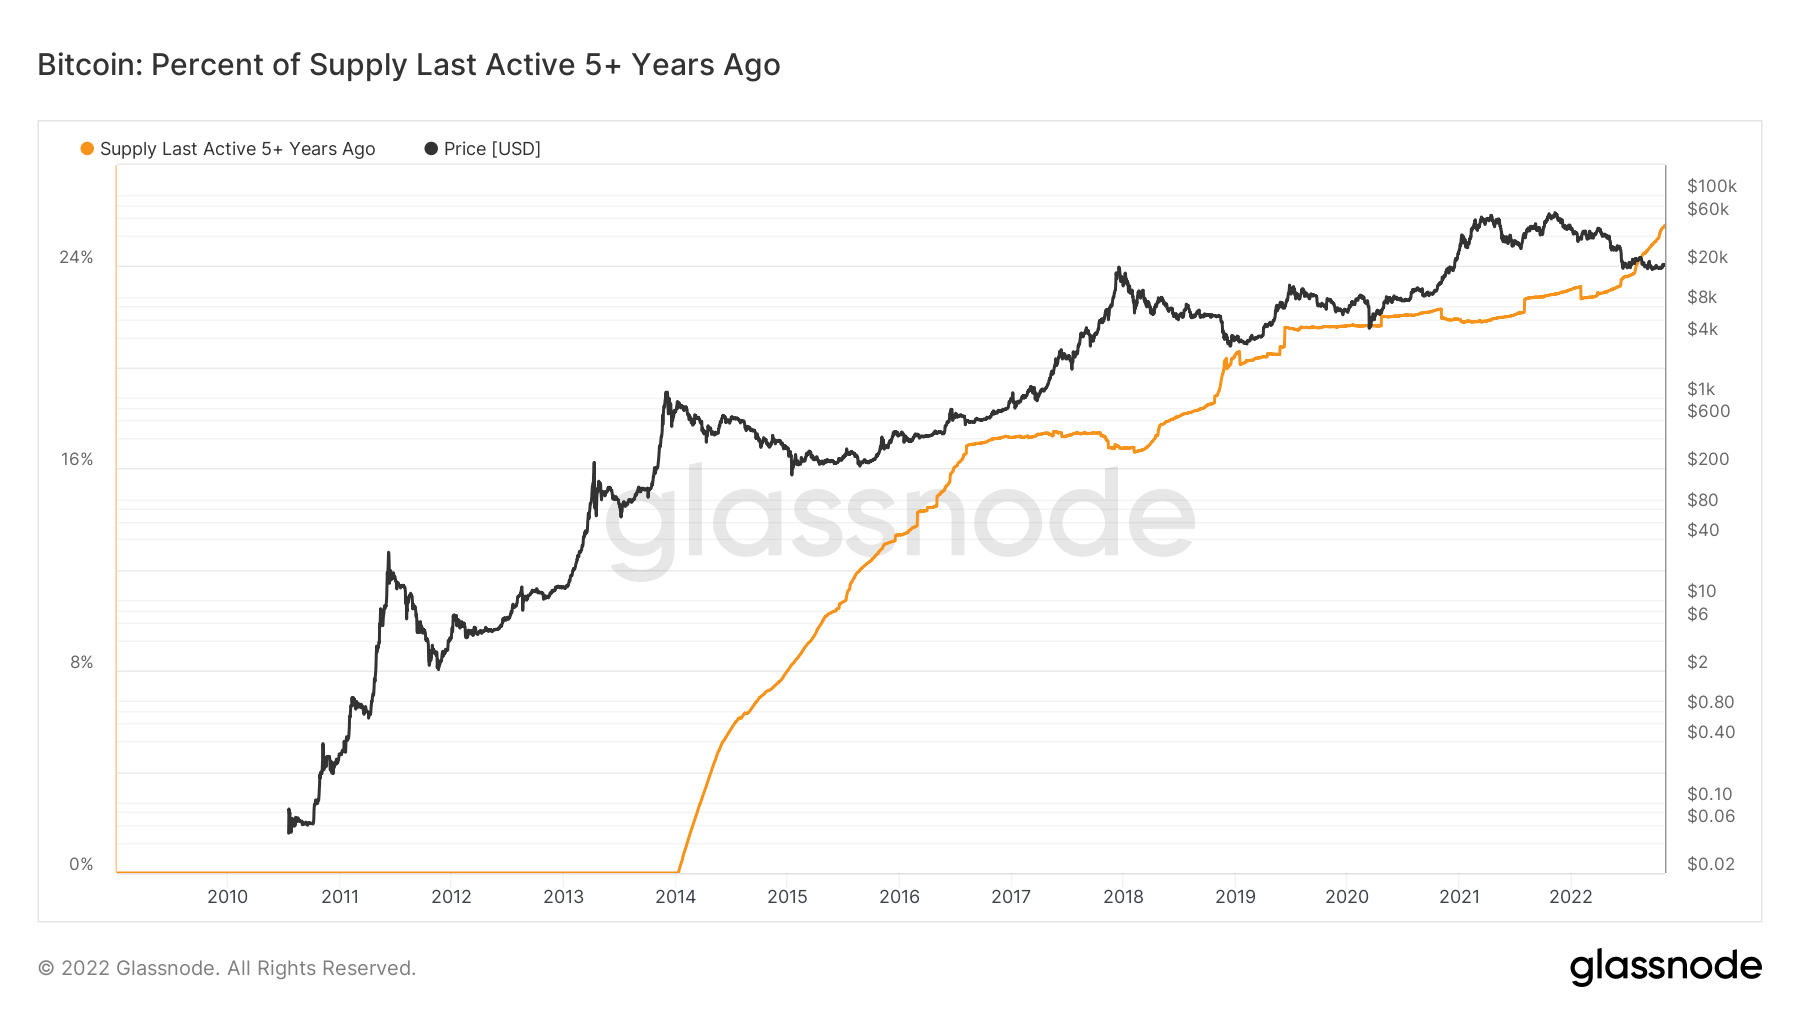
Breaks down relative behavior by various entities' wallet.Ancient Coins
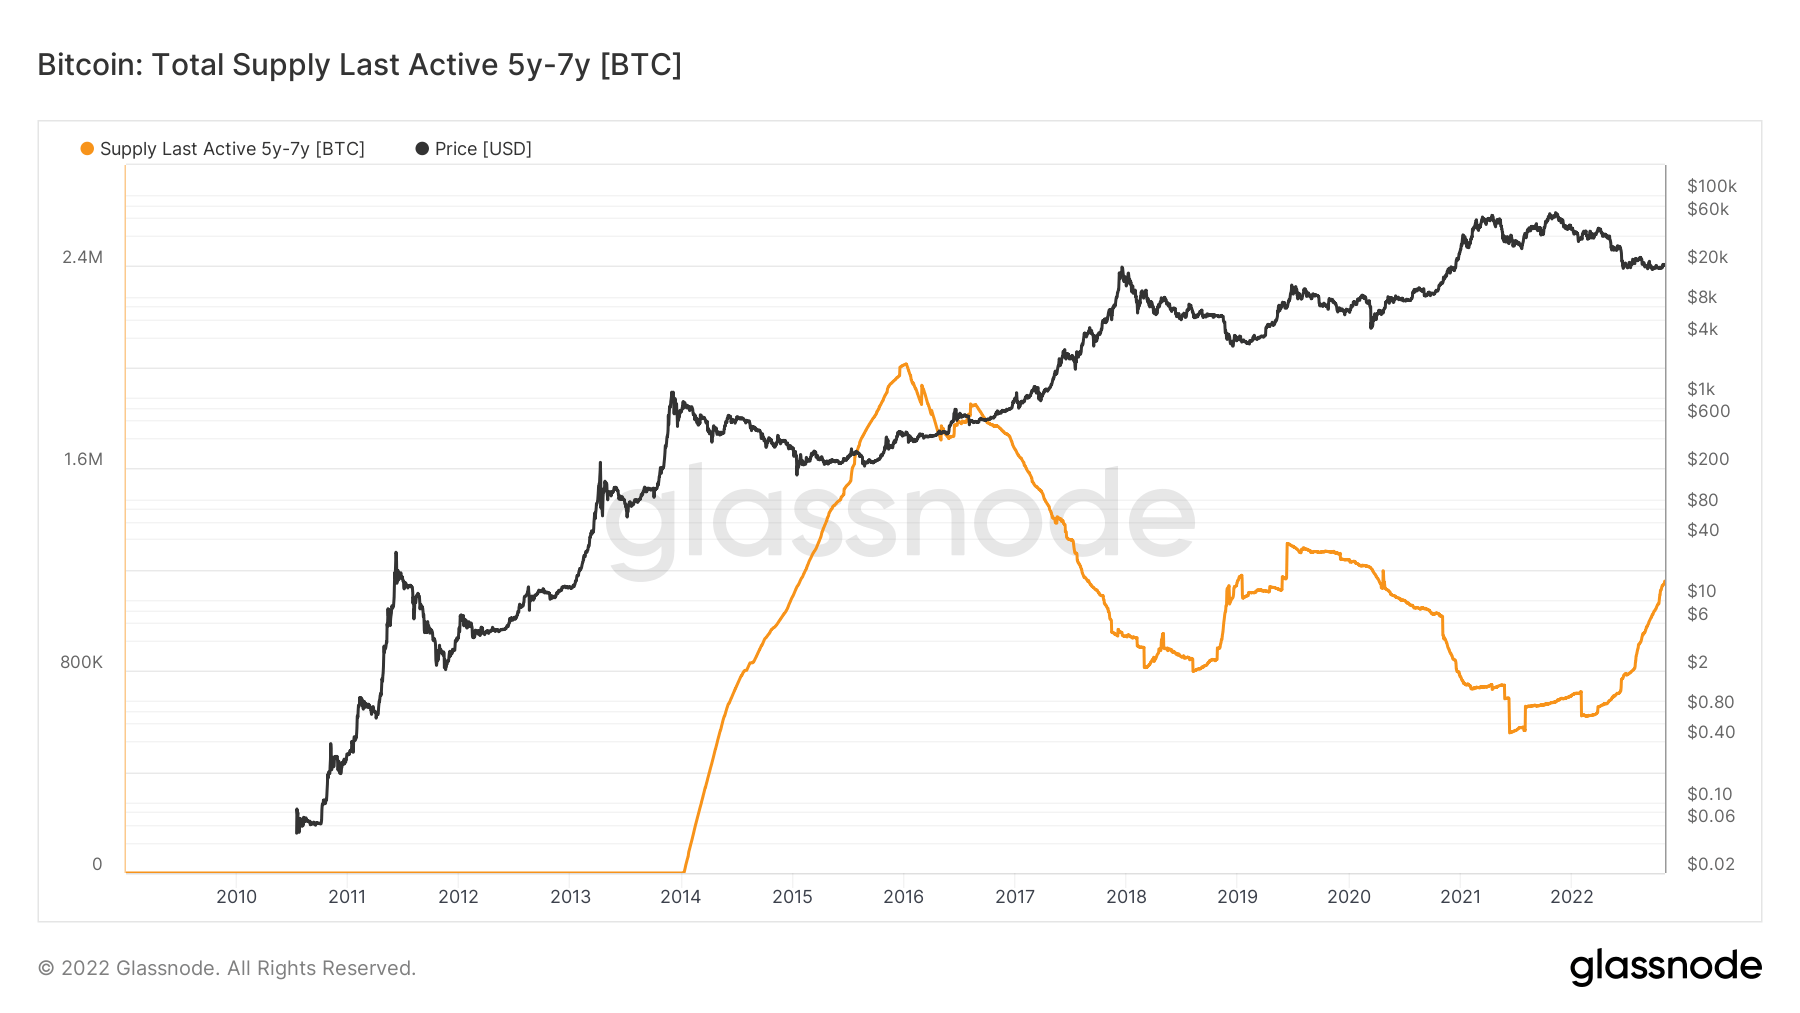
Each bear market cycle forms new diamond hands or ancient coins, referred to as five-year holders. The metric supply last active 5+ years ago shows the percent of circulating supply that has not moved in at least five years which is currently going vertical at 25%. This is due to the run-up in Q4 2017, when BTC was approaching $20k. While the amount of coins the 5-7 year cohort hold is just over 1 million coins
The amount of circulating supply last moved between 5 years and seven years ago. 25% and over 1 million coins, expect this number to continue to grow in the short term.
More Market Reports


