Tech titans and seasonal trends: A deeper look into S&P 500 performance
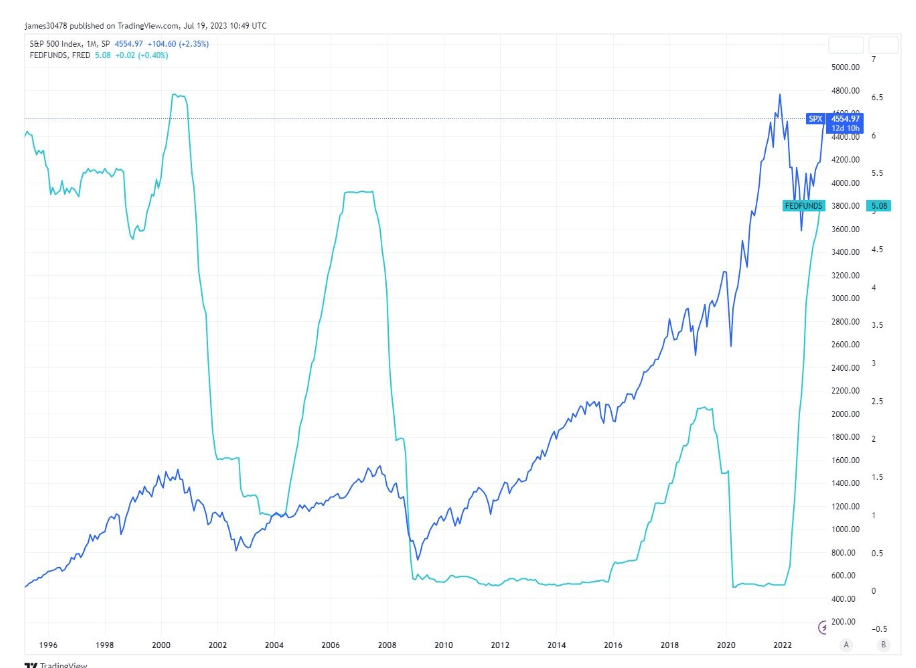
S&P 500's seasonal peaks: A recurring pattern around recessions?
Quick Take
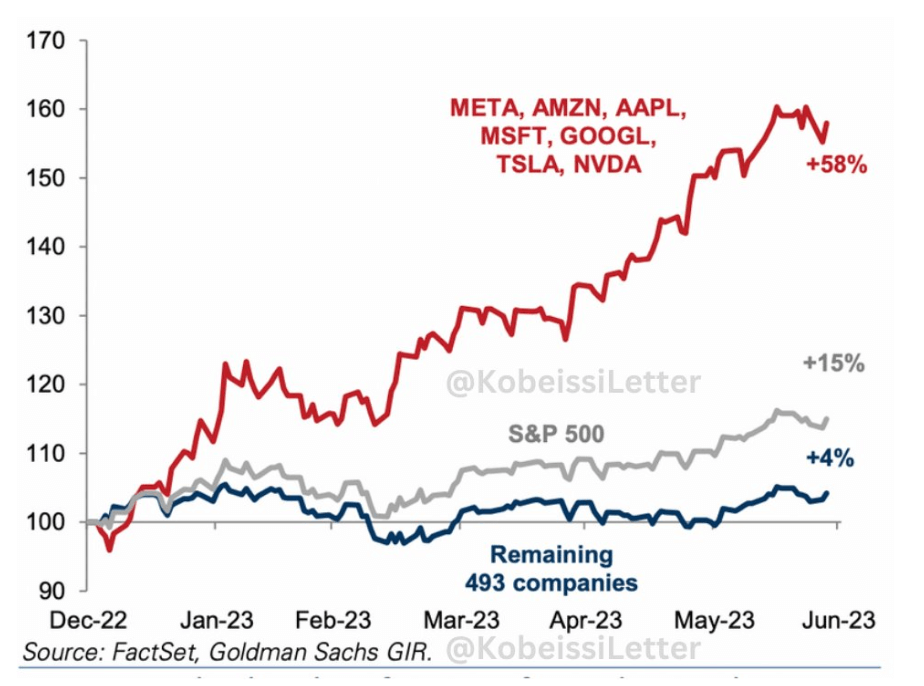
According to the global markets newsletter, the Kobessi Letter, the year-to-date performance of the S&P 500 shows a striking disparity of the underlying assets behind its impressive gain of 15%.
Seven tech giants – Meta (Facebook), Amazon, Apple, Microsoft, Google, Tesla, and Nvidia – are collectively up by a staggering 58%. In contrast, the remaining 493 companies listed on the index have seen only a modest increase of 4% in the same period.
Historical Market Trends: A Seasonal Pattern?
A notable pattern emerges when exploring the historical performance of the S&P 500 (SPX) around the last three recessions. Each time, the SPX peaked just after the summer months while the fed started to cut rates. Specifically:
- The 2000 peak occurred in August.
- The 2007 peak took place in October.
- The 2018 peak happened in September.
This trend prompts the question: Will this post-summer peak pattern persist in future recessions? As always, while historical patterns can provide insight, they should not be considered a guaranteed prediction of future performance.