Navigating the Bitcoin surge: A deep dive into Implied Volatility
Over the past few weeks, the Bitcoin ecosystem has demonstrated a positive sentiment, spurred by several spot Exchange-Traded Fund (ETF) filings.
Quick Take
Glassnode describes “Implied Volatility” as the market's forecast of price fluctuations. When we know the cost of an option, we can calculate the anticipated volatility of the asset it represents. To put it formally, implied volatility (IV) represents the expected range of an asset’s price movement over a year, within one standard deviation.
By tracking At-The-Money (ATM) Implied Volatility (IV) over a period of time, we can gain a standardized perspective on the expected volatility, which typically varies with actual volatility and the mood of the market. This measurement displays the ATM IV for options contracts due to expire one month from the current date.
In recent weeks, there has been a wave of positivity within the Bitcoin community, largely driven by the introduction of spot Exchange-Traded Funds (ETFs). Importantly, the second quarter closing price of Bitcoin saw a 7% increase, finishing over the $30,000 mark.
According to data analysis by Deribit, the volatility experienced in June unveiled important details about the individual volatilities of Bitcoin and Ethereum. Ever since Glassnode started monitoring derivatives data, Ethereum has persistently displayed a higher beta value than Bitcoin, suggesting it has a higher level of volatility.
Yet, a fascinating shift occurred over the past fortnight. Bitcoin's implied volatility unexpectedly overtook Ethereum's. This surprising turn of events can be traced back to the reasons previously discussed.
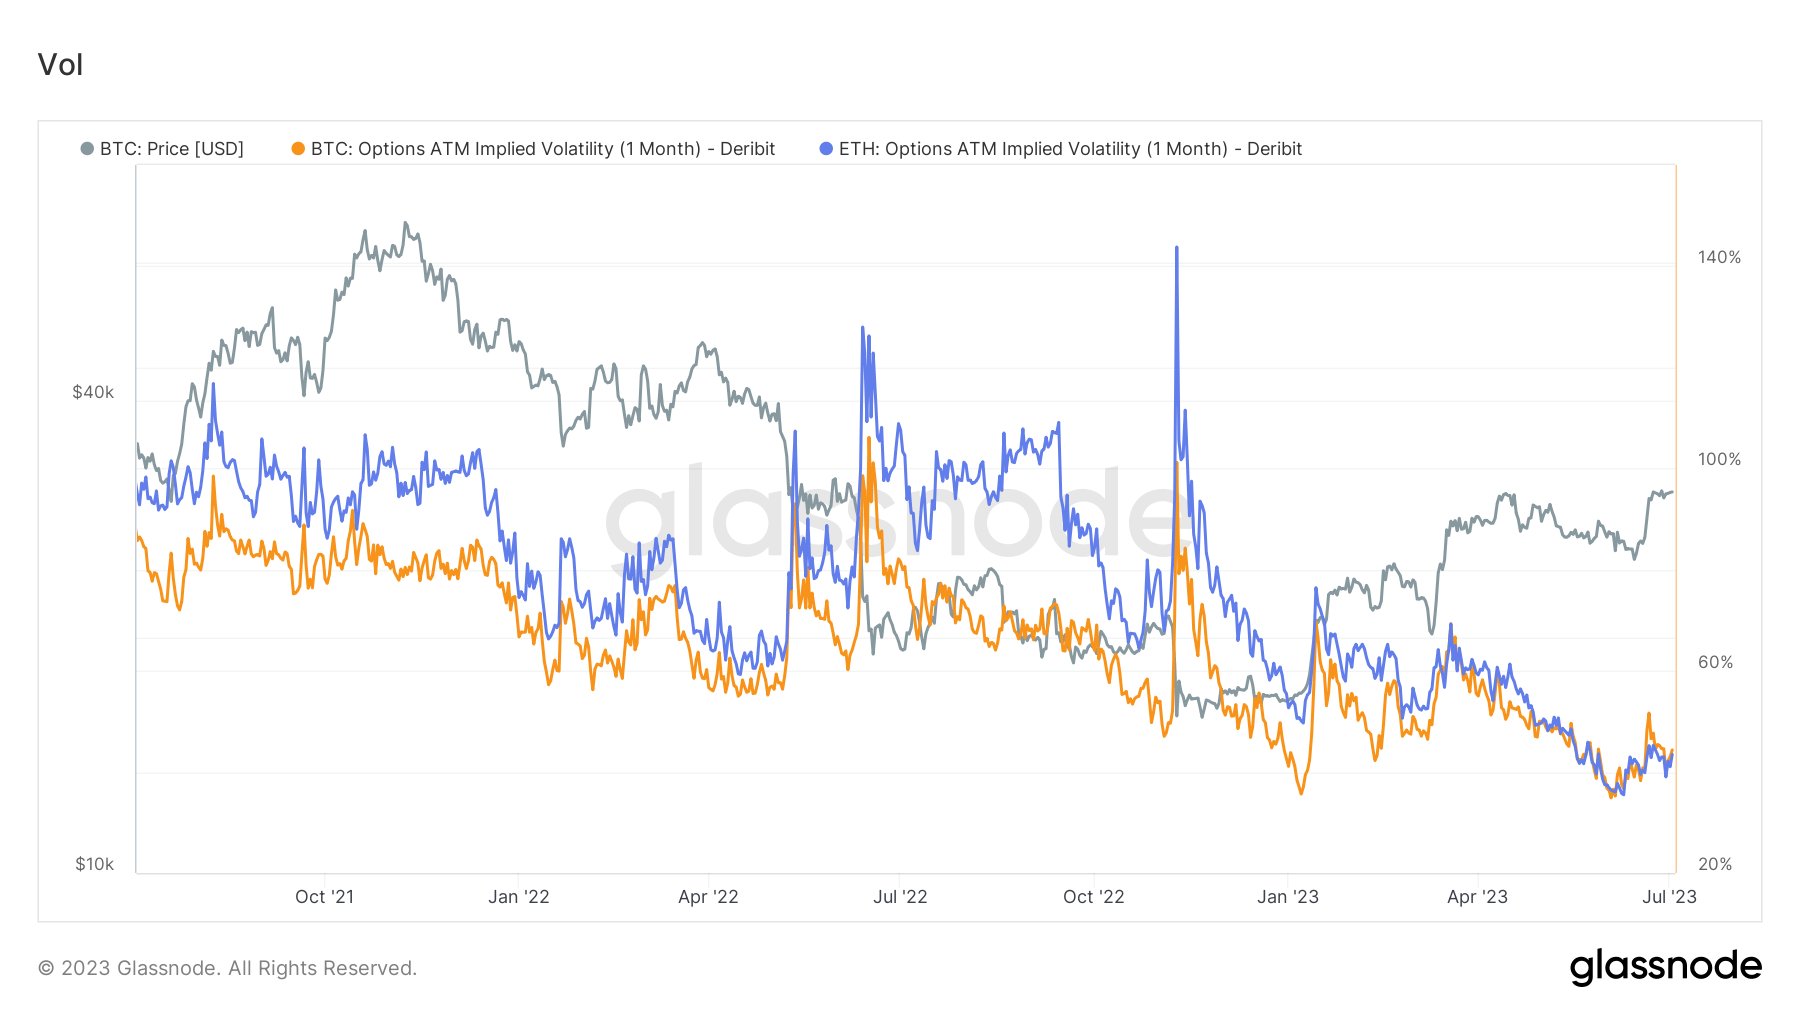
Although there was a modest rise in volatility, Deribit pointed out that this increase was counterbalanced by the trading volume. Additionally, it mostly stayed within the lower limit range, even during volatile market conditions. According to Deribit, this phase of heightened Bitcoin volatility is the longest ever observed, suggesting it could be an emerging trend.
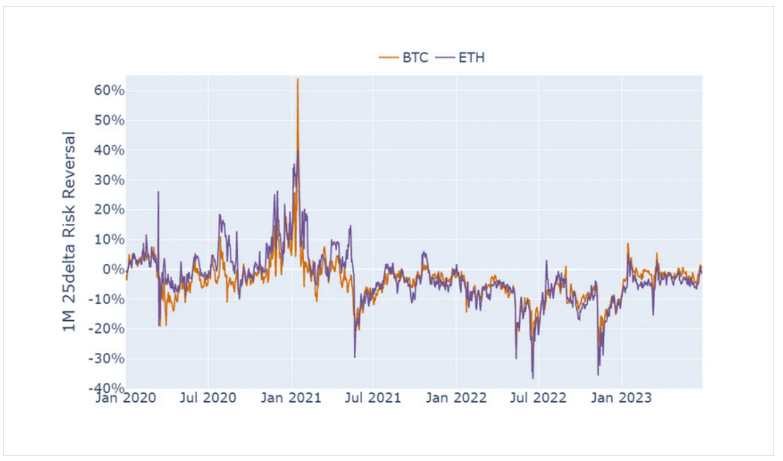
Since the start of the year, Bitcoin has seen an impressive increase of 82%, fueled by multiple encouraging factors. Deribit prepared a one-month 25 delta risk reversal chart, illustrating that despite the upward trend in price, the skew maintains a relatively steady state