 Bitcoin wrestles with key technical indicators as $28k proves a formidable resistance
 Quick Take
Bitcoin is currently grappling with a pivotal price point. With a value just shy of $28,000, it is up against several short-term technical indicators.
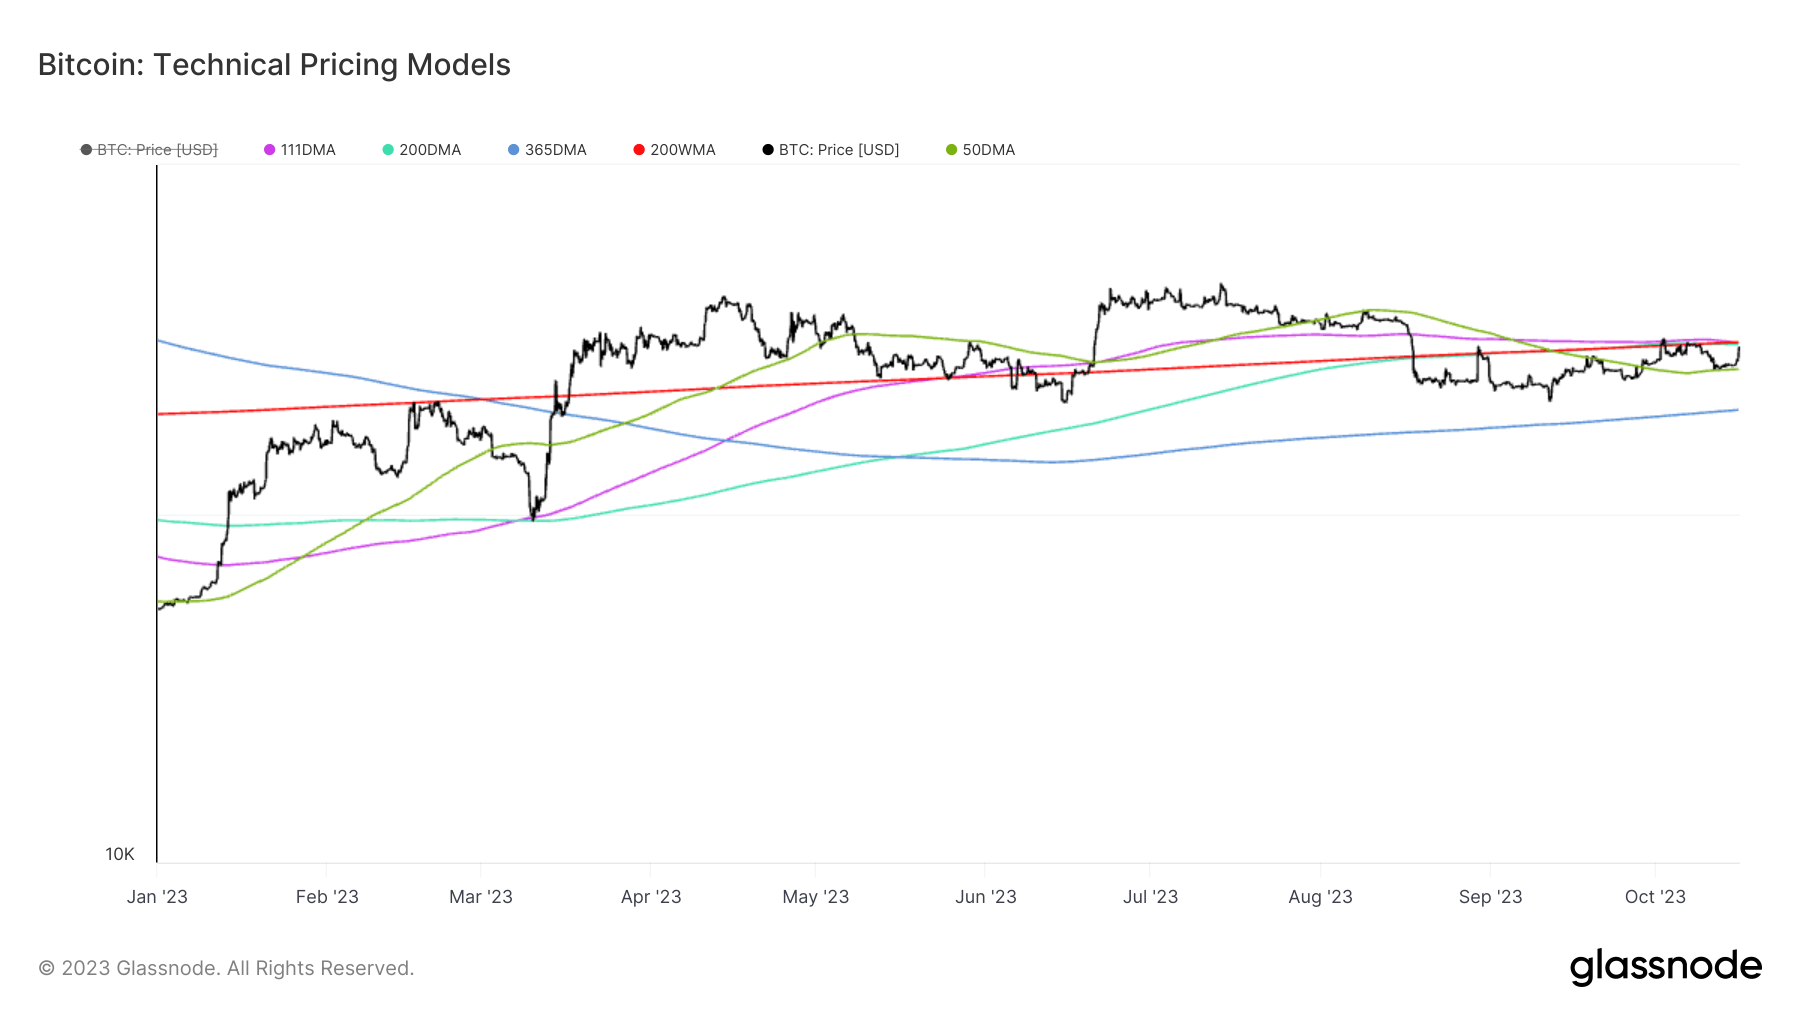
The 200-week moving average now stands at $28,130, while the 200-day moving average is slightly lower, at $28,008. The 111-day moving average is also positioned at $28,099, further complicating the short-term market outlook.
Over the last week, Bitcoin has followed the 50-day moving average, currently at $26,660.

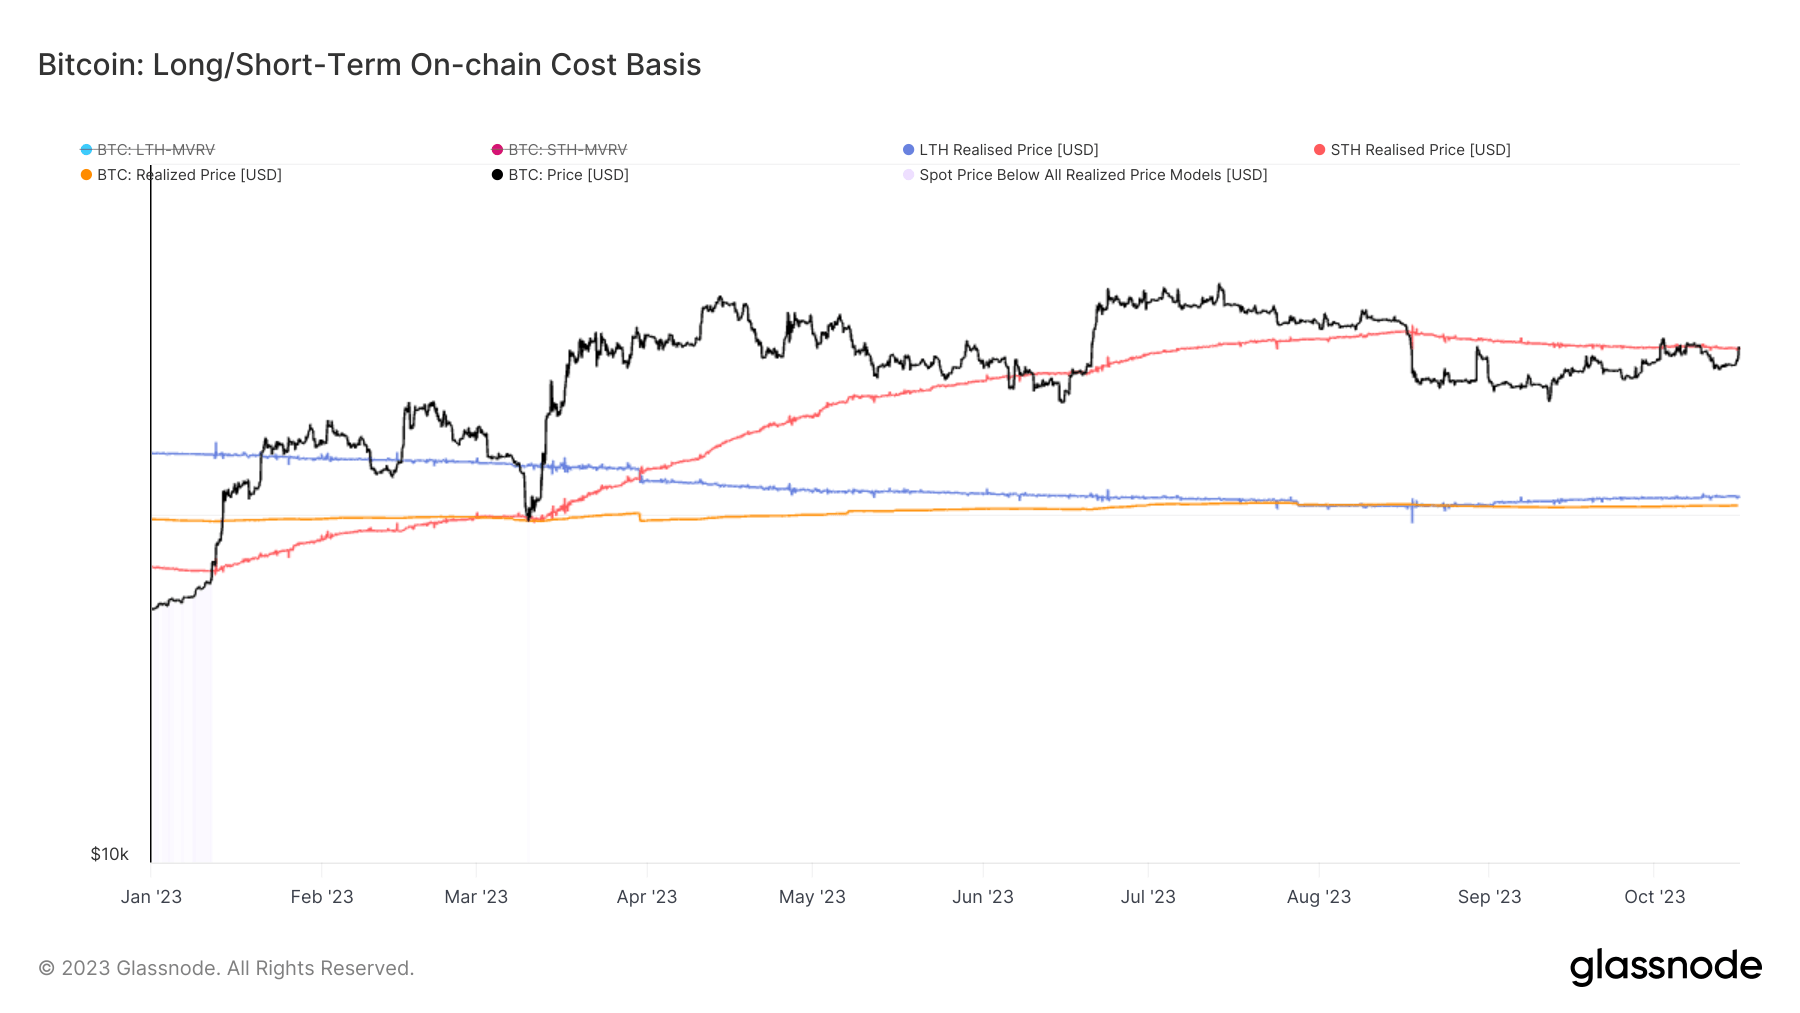
Another obstacle comes from the short-term holder’s realized price, which is presently valued at $27,830. This metric represents the average on-chain acquisition price for coins, excluding those in exchange reserves, moved within the last 155 days. Coins falling under this category are the most likely to be spent on any given day. Since falling under this threshold on Aug. 17, Bitcoin has encountered resistance numerous times.
Bitcoin has obeyed the short-term holder’s realized price several times this year, notably during the SVB collapse in March and again in June.

Indicators used in this article are for past trend analysis only and should not be considered financial advice.


