Bitcoin SLA hits all-time high in all categories, similar trend seen in the 2015 bear market
Bitcoin Supply Last Active (SLA) 1+ years ago indicates hits an all-time high of 66.90% as hodl'ing becomes the preferred choice of method.
This article was published 3 years ago. Some details may no longer reflect current market conditions or recent developments. If you spot anything that needs an update, contact us.
Definition
The percent of circulating supply that has not moved in at least one, two, three, or five years.
Quick Take
- As longer-term investors accumulate coins, these metrics will tend to rise. Conversely, as long-term investors spend and distribute their coins, this metric will decline — with older coins becoming young again as they change hands.
- This current trend is similar to the 2015 bear market bottom, where all supply last active categories were also at an all-time high. This indicates that hodl'ing is the preferred method of choice.
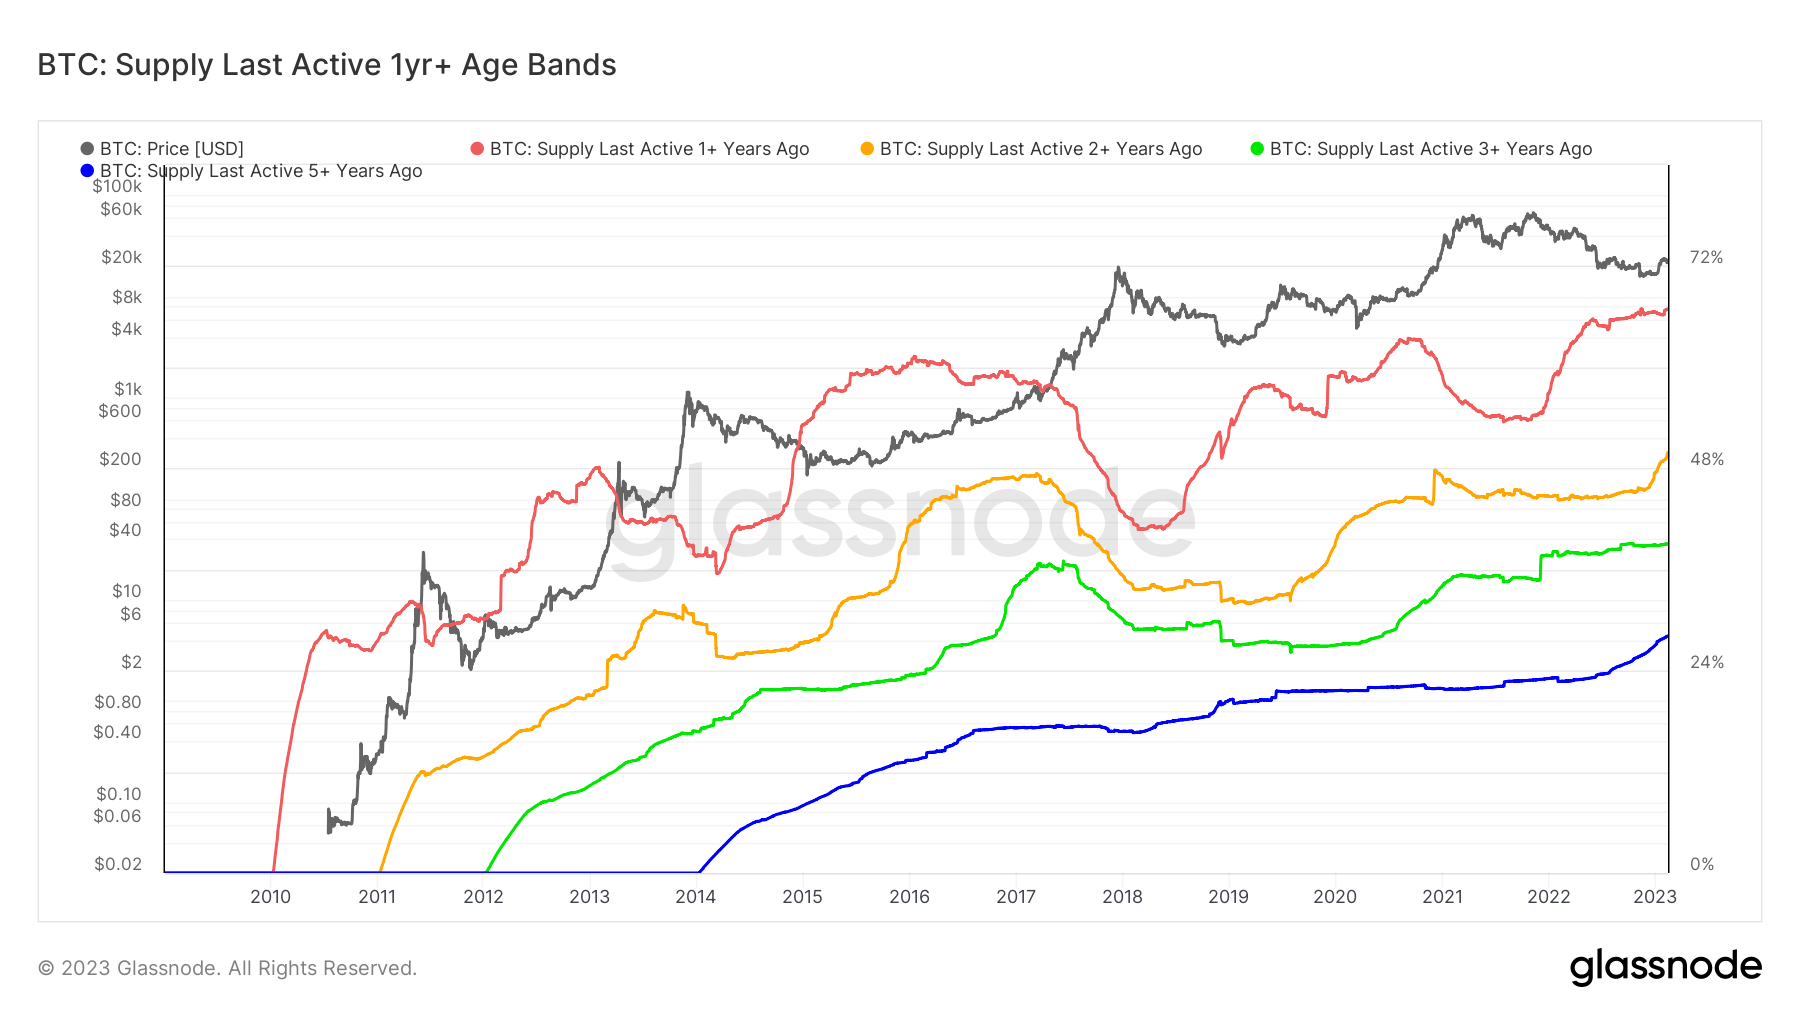
This chart displays an overlay of multiple Supply Last Active variants, each shown as a percentage of Circulating Supply.
- Supply Last Active 1+ Yrs Ago 🔴: 66.90%
- Supply Last Active 2+ Yrs Ago 🟠: 49.88%
- Supply Last Active 3+ Yrs Ago 🟢: 39.06%
- Supply Last Active 5+ Yrs Ago 🔵: 28.11%