 This analyst says there’s a “high chance” Bitcoin may never fall under $5k again
 This analyst says there’s a “high chance” Bitcoin may never fall under $5k again

Cover art/illustration via CryptoSlate. Image includes combined content which may include AI-generated content.
Once Bitcoin (BTC) started to incur strong losses in the second half of 2019, analysts were once again making extremely low price predictions.
Long-time Bitcoin skeptic Peter Schiff, who is CEO of Euro Pacific Capital, wrote in a late-2019 tweet that per his technical analysis of the charts, BTC’s breakdown below the $7,000 range could be a precursor to a potential capitulation event to $1,000.
Even recently, despite the price of digital assets rallying by dozens of percent since the December bottom, a number of traders have asserted that a $3,000 Bitcoin price is in the books.
But, per a number of analyses, there is about no way the cryptocurrency will ever see those prices again.
Will Bitcoin say goodbye to sub-$5,000 prices forever?
Bitcoin analyst Digitalik.net, who runs a cryptocurrency statistics website that has his online username as the URL, recently noted that BTC’s four-year simple moving average (SMA) just crossed over the $5,000 level for the first time ever.
This is important as a chart shared by a user of his site shows that Bitcoin always bounced off the four-year SMA, only breaking through it briefly before bouncing higher. Indeed, in the wake of the 2013 bubble, BTC found key support at that level for months; and in 2018, the moving average marked the bottom for the brutal price plunge.
With this technical level being of utmost importance, Digitalik.net said that “there is a high chance we will not see BTC below $5,000 ever again.”
There is high chance we will not see #btc below $5000 ever again.
LIVE: https://t.co/pVIh9gvJdY https://t.co/9CZyEy2ymC
— digitalik.net (@digitalikNet) January 24, 2020
Not only long-term positive sign
It isn’t only the four-year SMA that suggests BTC will never revisit triple digits ever again.
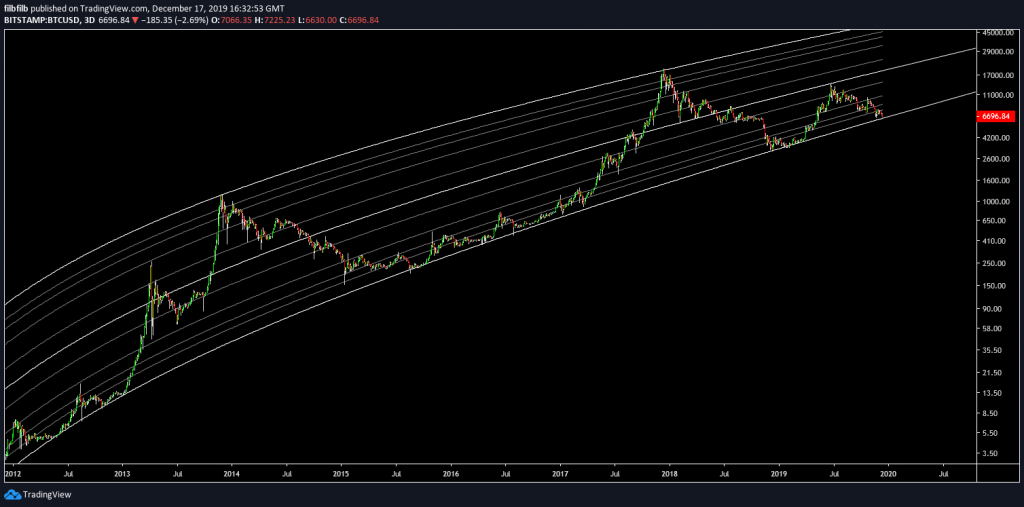
In a CryptoSlate report covering Bitcoin’s plunge to the $6,000s in December, we cited this chart below from legendary analyst Filb Filb. The chart depicts a logarithmic growth curve that BTC has traded in for around a decade’s time, with bull runs topping at the top of the curve and bear markets finding support at the bottom of the curve.
The curve is so accurate that there are at least seven distinct points where the price of BTC flirted with the bottom of the curve, to only move higher in the weeks that followed.

At the time of our report, there were fears that BTC was finally going to break the curve—something that cynics of cryptocurrency say the asset will not hold forever. But, at the eleventh hour, bulls stepped in, allowing Bitcoin to close above the lowest logarithmic growth band as the price bounced back. The clear support found at this level suggests Bitcoin will
Not to mention, Willy Woo — partner at Bitcoin fund Adaptive Capital — said in December that per his analysis of on-chain data, he believes the macro price bottom was established in the low-$6,000s. Woo did say, however, that there is an opportunity for a drop below that bottom, but noted that it would just be a blip in the grand scheme of things.
Bitcoin Market Data
At the time of press 3:36 pm UTC on Jan. 25, 2020, Bitcoin is ranked #1 by market cap and the price is down 1.7% over the past 24 hours. Bitcoin has a market capitalization of $151.55 billion with a 24-hour trading volume of $21.08 billion. Learn more about Bitcoin ›
Crypto Market Summary
At the time of press 3:36 pm UTC on Jan. 25, 2020, the total crypto market is valued at at $229.28 billion with a 24-hour volume of $78.9 billion. Bitcoin dominance is currently at 66.12%. Learn more about the crypto market ›


