Analyst: this dire technical formation may spell doom for Bitcoin’s near-term price action

Cover art/illustration via CryptoSlate. Image includes combined content which may include the use of AI tools.
The 2020 Bitcoin rally was fun while it lasted, but the cryptocurrency recently formed a much-dreaded technical formation that may signal that BTC will see further near-term downside.
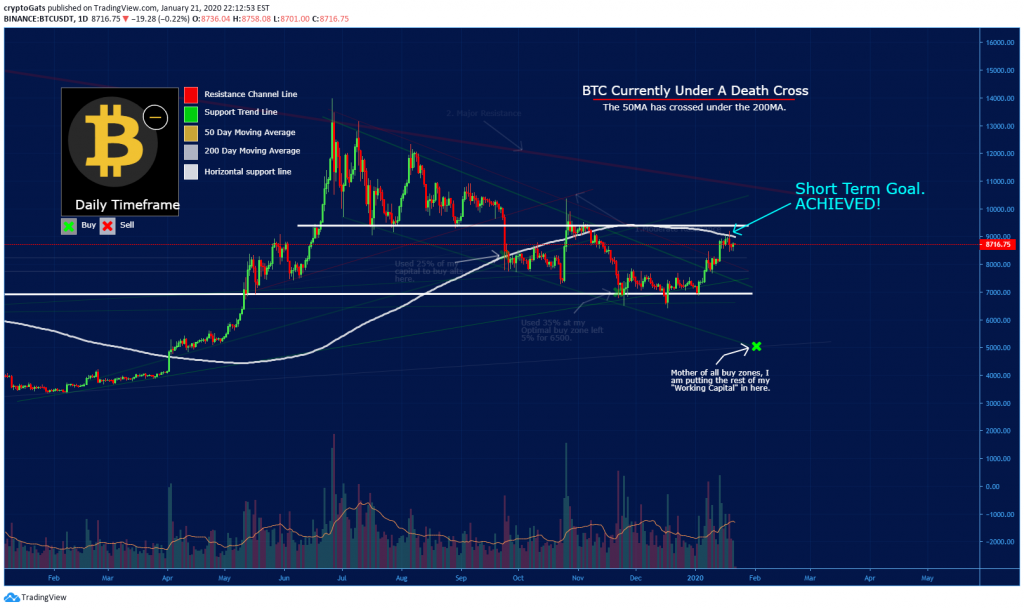
This technical formation – which is accurately described by analysts as a “death cross” – comes about after an asset’s 50-day moving average crosses beneath its 200-day moving average, and Bitcoin is currently caught beneath this formation.
This has led one respected analyst to explain that BTC’s recent price action could be shaping up to signal that its local highs at $9,200 will mark a mid-term top.
Bitcoin forms the dreaded death cross
At the time of writing, Bitcoin is trading down roughly 4 percent at its current price of $8,340, which marks a notable decline from its daily highs of over $8,700 that were set yesterday.
Today’s drop also marks a breakdown of the recent consolidation phase that BTC was caught within and has further confirmed the notion that $9,200 could be a mid-term top for the crypto.
CryptoGats, a well-respected analyst on TradingView, explained in a recent post that Bitcoin is currently caught beneath a death cross, which to him suggests that its recent uptrend could be on the cusp of reversing, and today’s price action further bolsters that notion. He explained while referencing the death cross seen on the below chart:
“When this happens you have no choice but to pull the plug… Just as I predicted, the small pivot BTC made meant that it was gonna try to reach out to the 200MA. I closed all of my positions… we hit resistance and now as you can see we were not able to go over the 200MA on the 1-day chart.”
Does today’s drop confirm a mid-term BTC top?
This aforementioned analysis, which was posted just prior to the overnight drop to $8,300 experienced by BTC, may confirm that the 2020 uptrend is kaput and that significantly further losses are imminent.
CryptoGats also noted in the above chart that the only way to bulls to invalidate Bitcoin’s bearishness was to push it above its 200MA, which is one of the levels at which it was firmly rejected at prior to this latest selloff.
With that being said, this ongoing drop could soon cut significantly deeper and even lead BTC all the way down to $5,000, which Gats believes is the “mother of all buy zones” that will mark a long-term bottom for the cryptocurrency.