Technical Analysis May 30: Bitcoin, Ethereum, Bitcoin Cash, Litecoin and Ripple
Photo by Lisa Zoe on Unsplash
Although a recovery may be in progress, it has been another rough week for cryptocurrency markets as the total market capitalization is down nearly $30 billion from one week ago. Using technical analysis, we will try to figure out if more downside is on the way, or if the pain is over.
Disclaimer: This article is not meant to constitute trading/investment advice. Please use extreme caution when trading any cryptocurrency.
For this article, we will be using a handful of terminology that non-technical traders may not be familiar with. These terms are at the end of this article under “Glossary.” If you would like to read those terms now, click here.
Bitcoin
Bitcoin started the week at $7950 and is currently sitting at $7520. Using basic support and resistance levels, we can see that Bitcoin turned away from the retest of its support. If it heads back to the level and fails to bounce off the support like it has twice in the past, things might get even uglier.
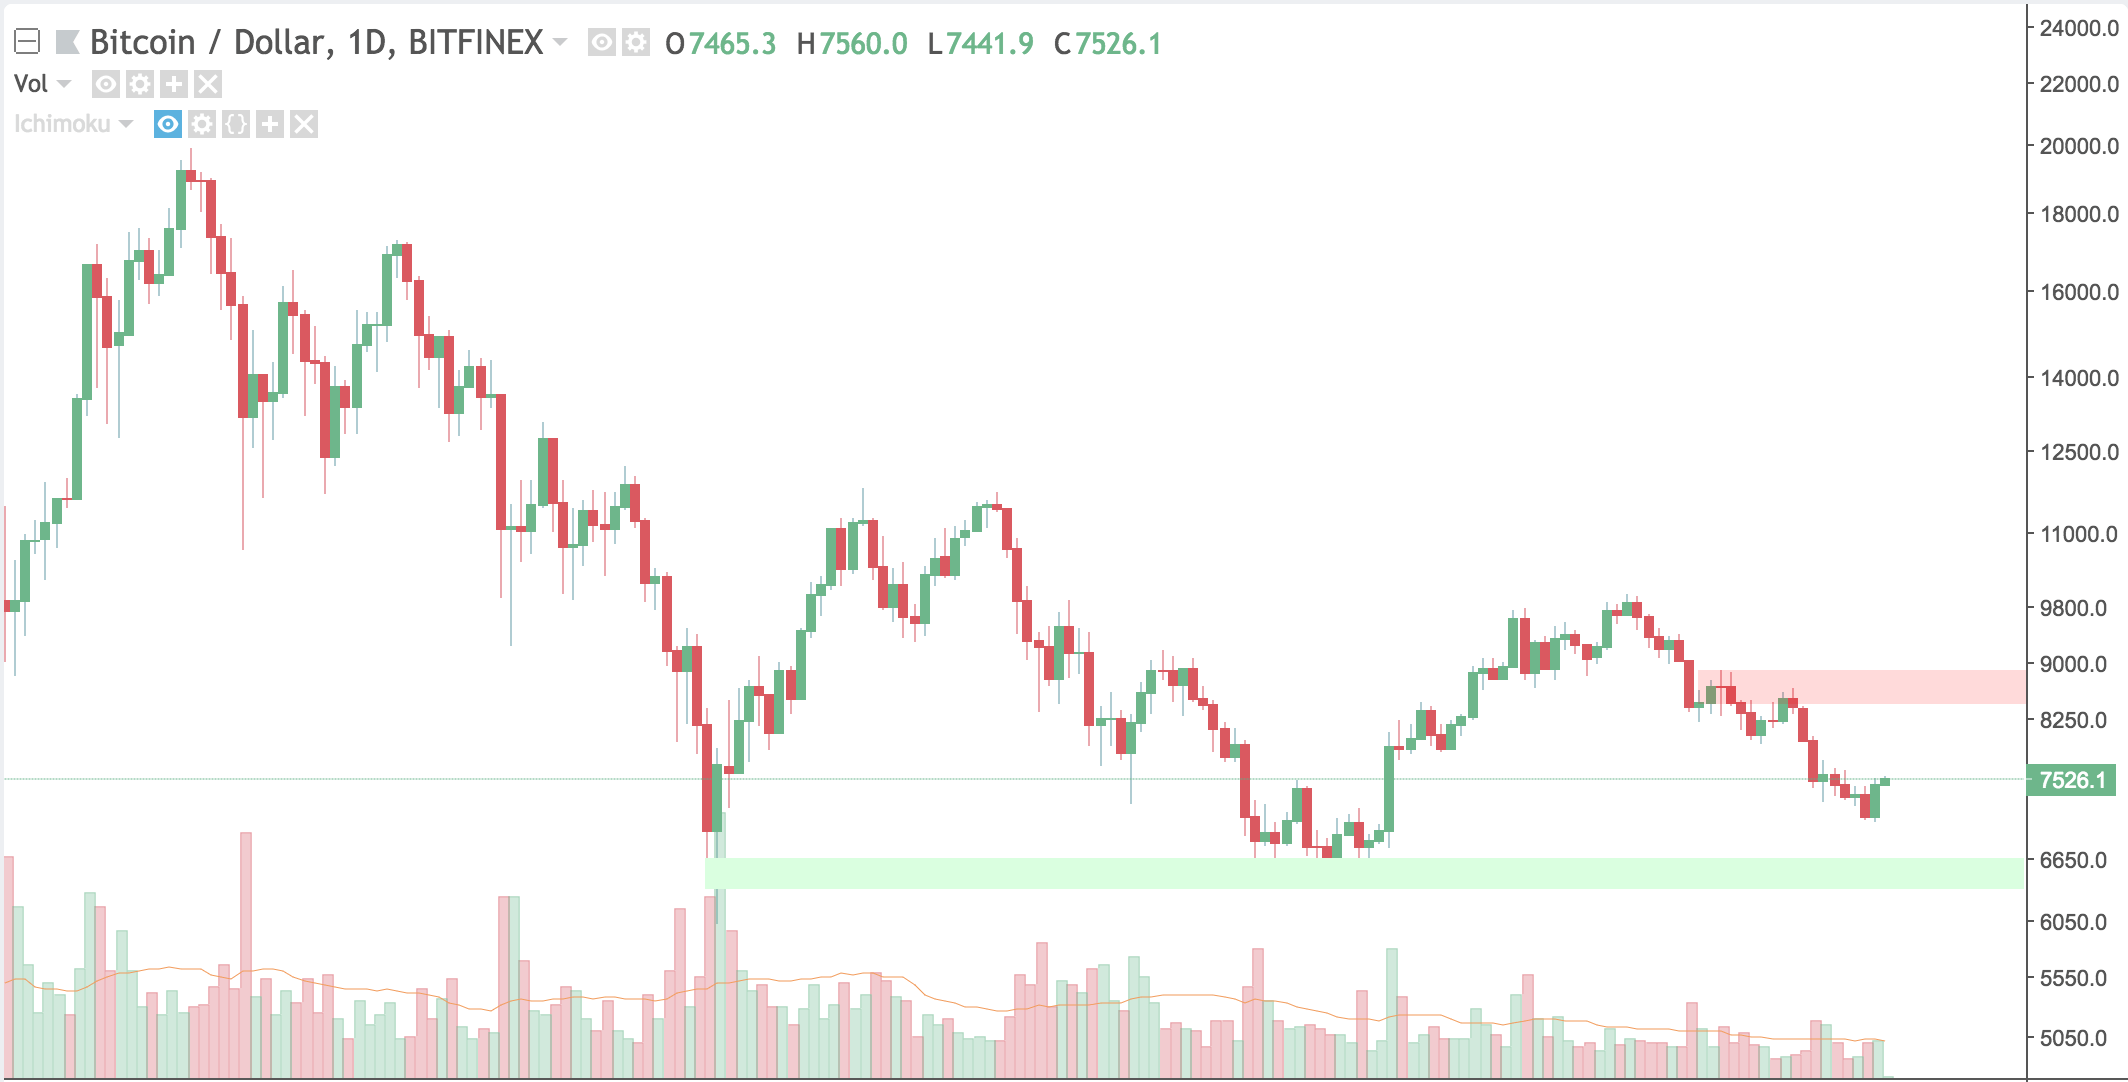
Using Ichimoku Clouds, we see the 4 hour Bitcoin chart is under the cloud and is headed to test the Tenkan-Sen. Depending on how it reacts to the level it will be more clear how to trade Bitcoin.
There is slight bullish divergence but in order to act on this trade, stronger divergence in addition to other indicators should be used to have a higher probability of success.
Ethereum
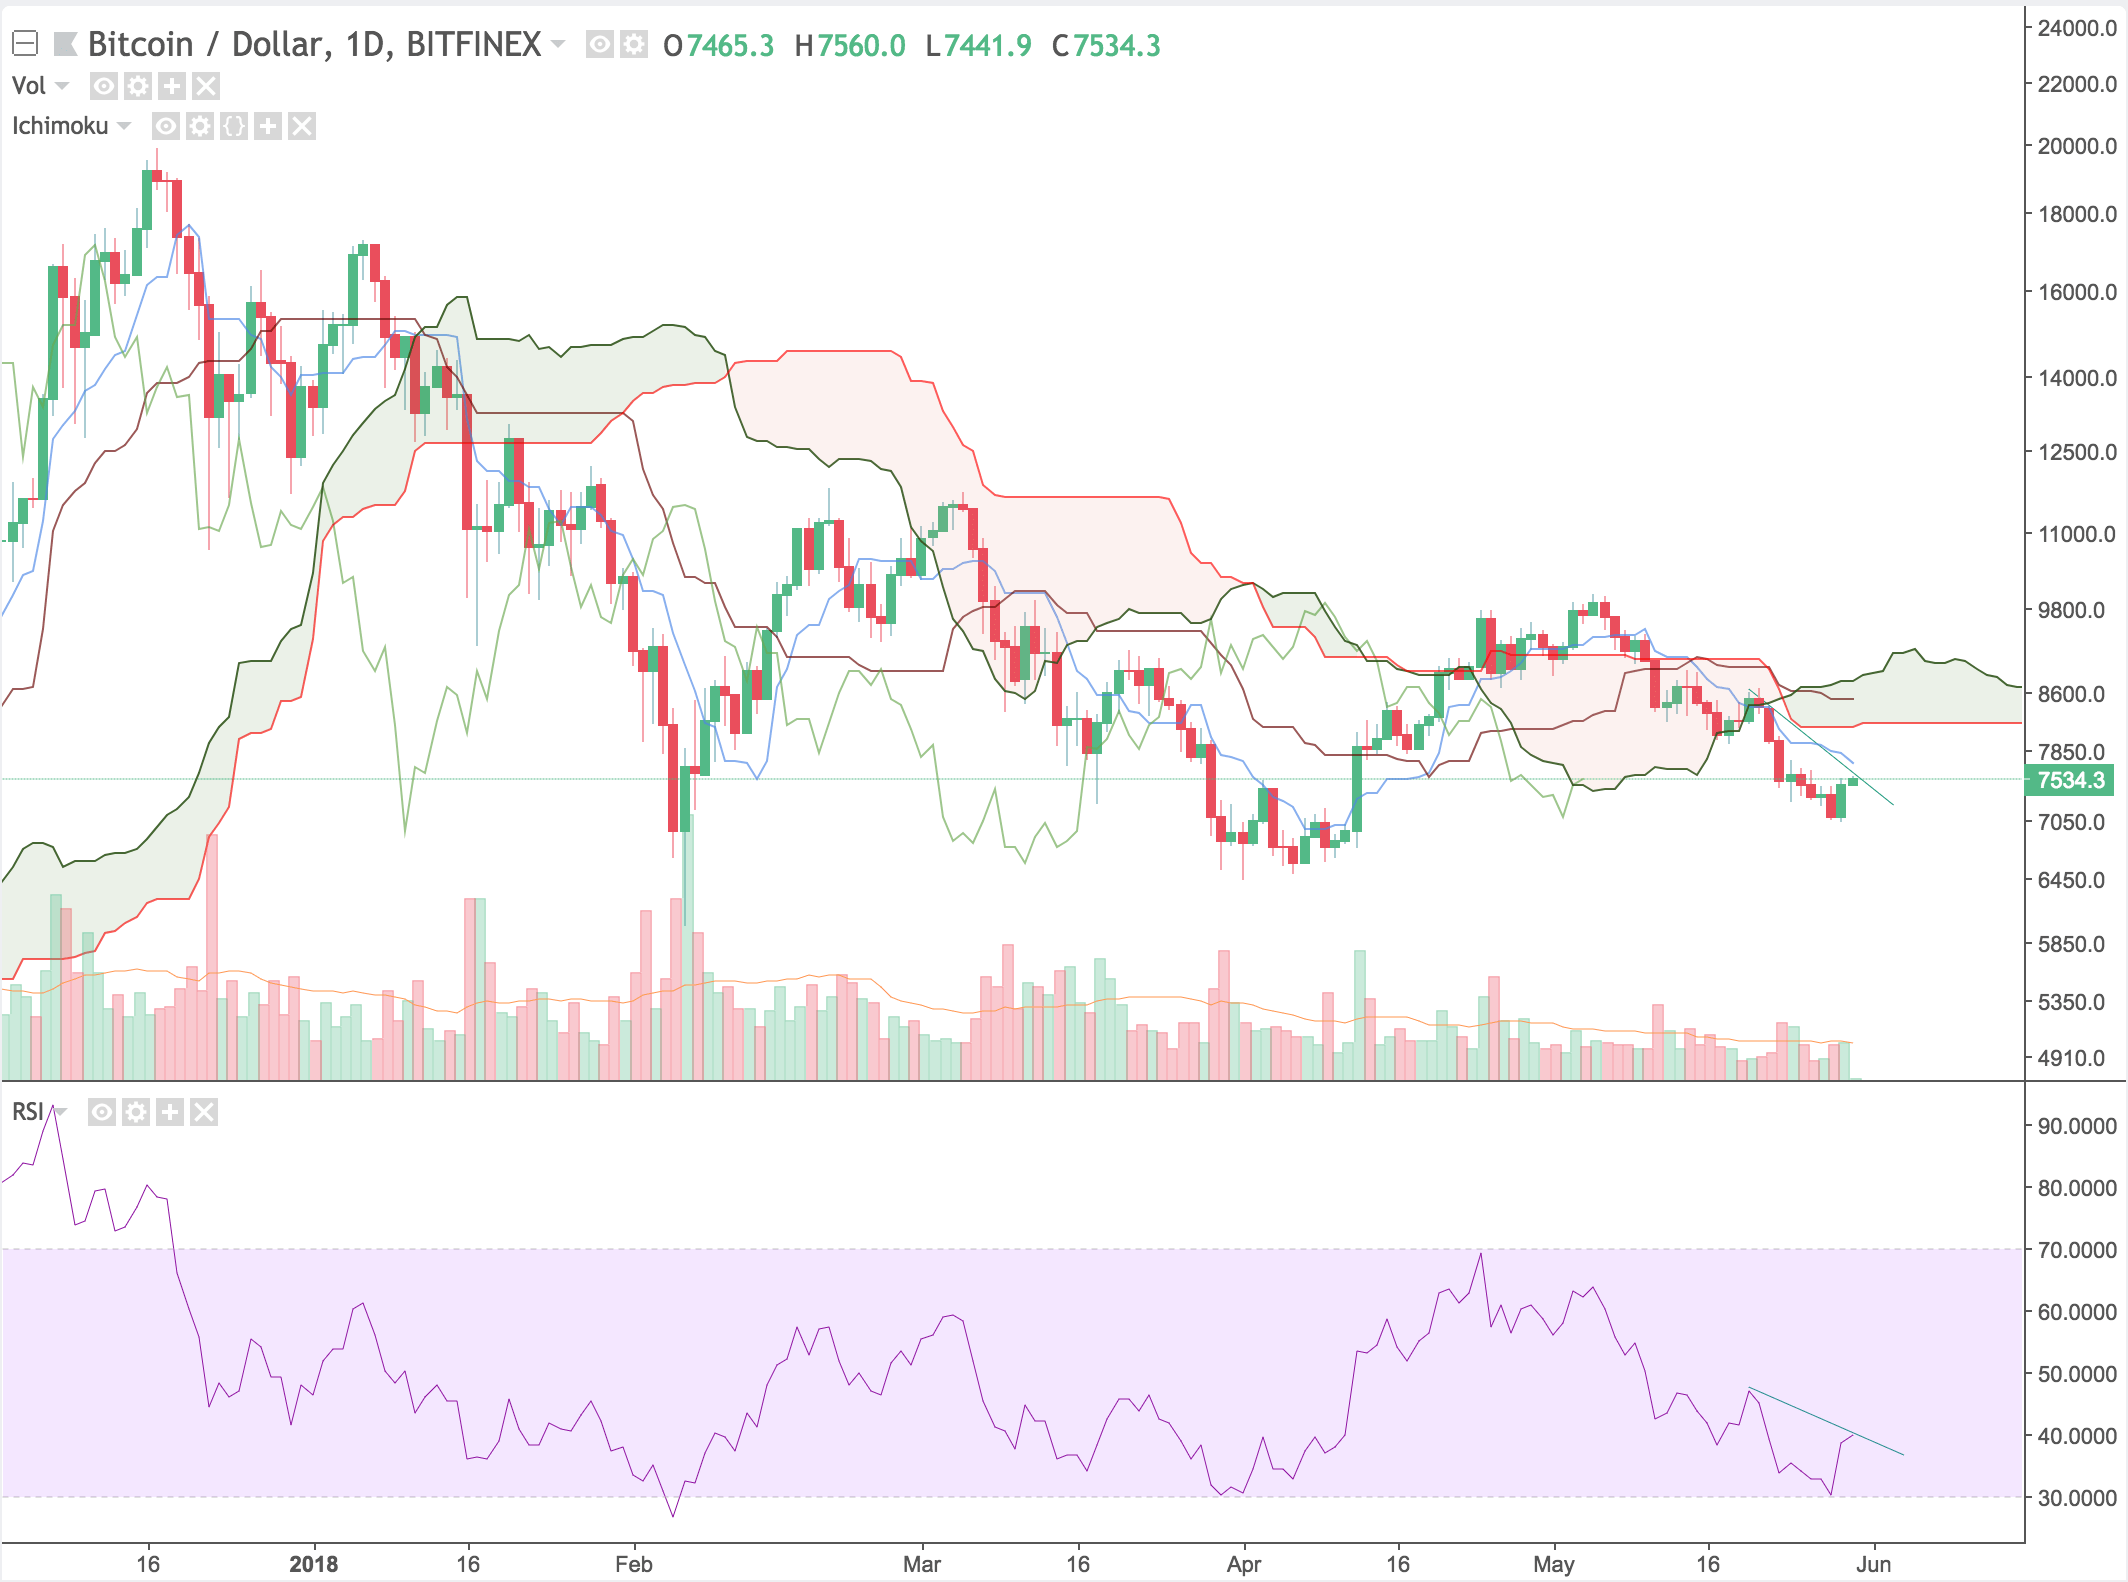
Ethereum started last week at $700 and is currently sitting at $575. It will most likely test the first highlighted resistance level. Similarly to Bitcoin's scenario, a breakthrough of its first support level could lead to some huge downside.
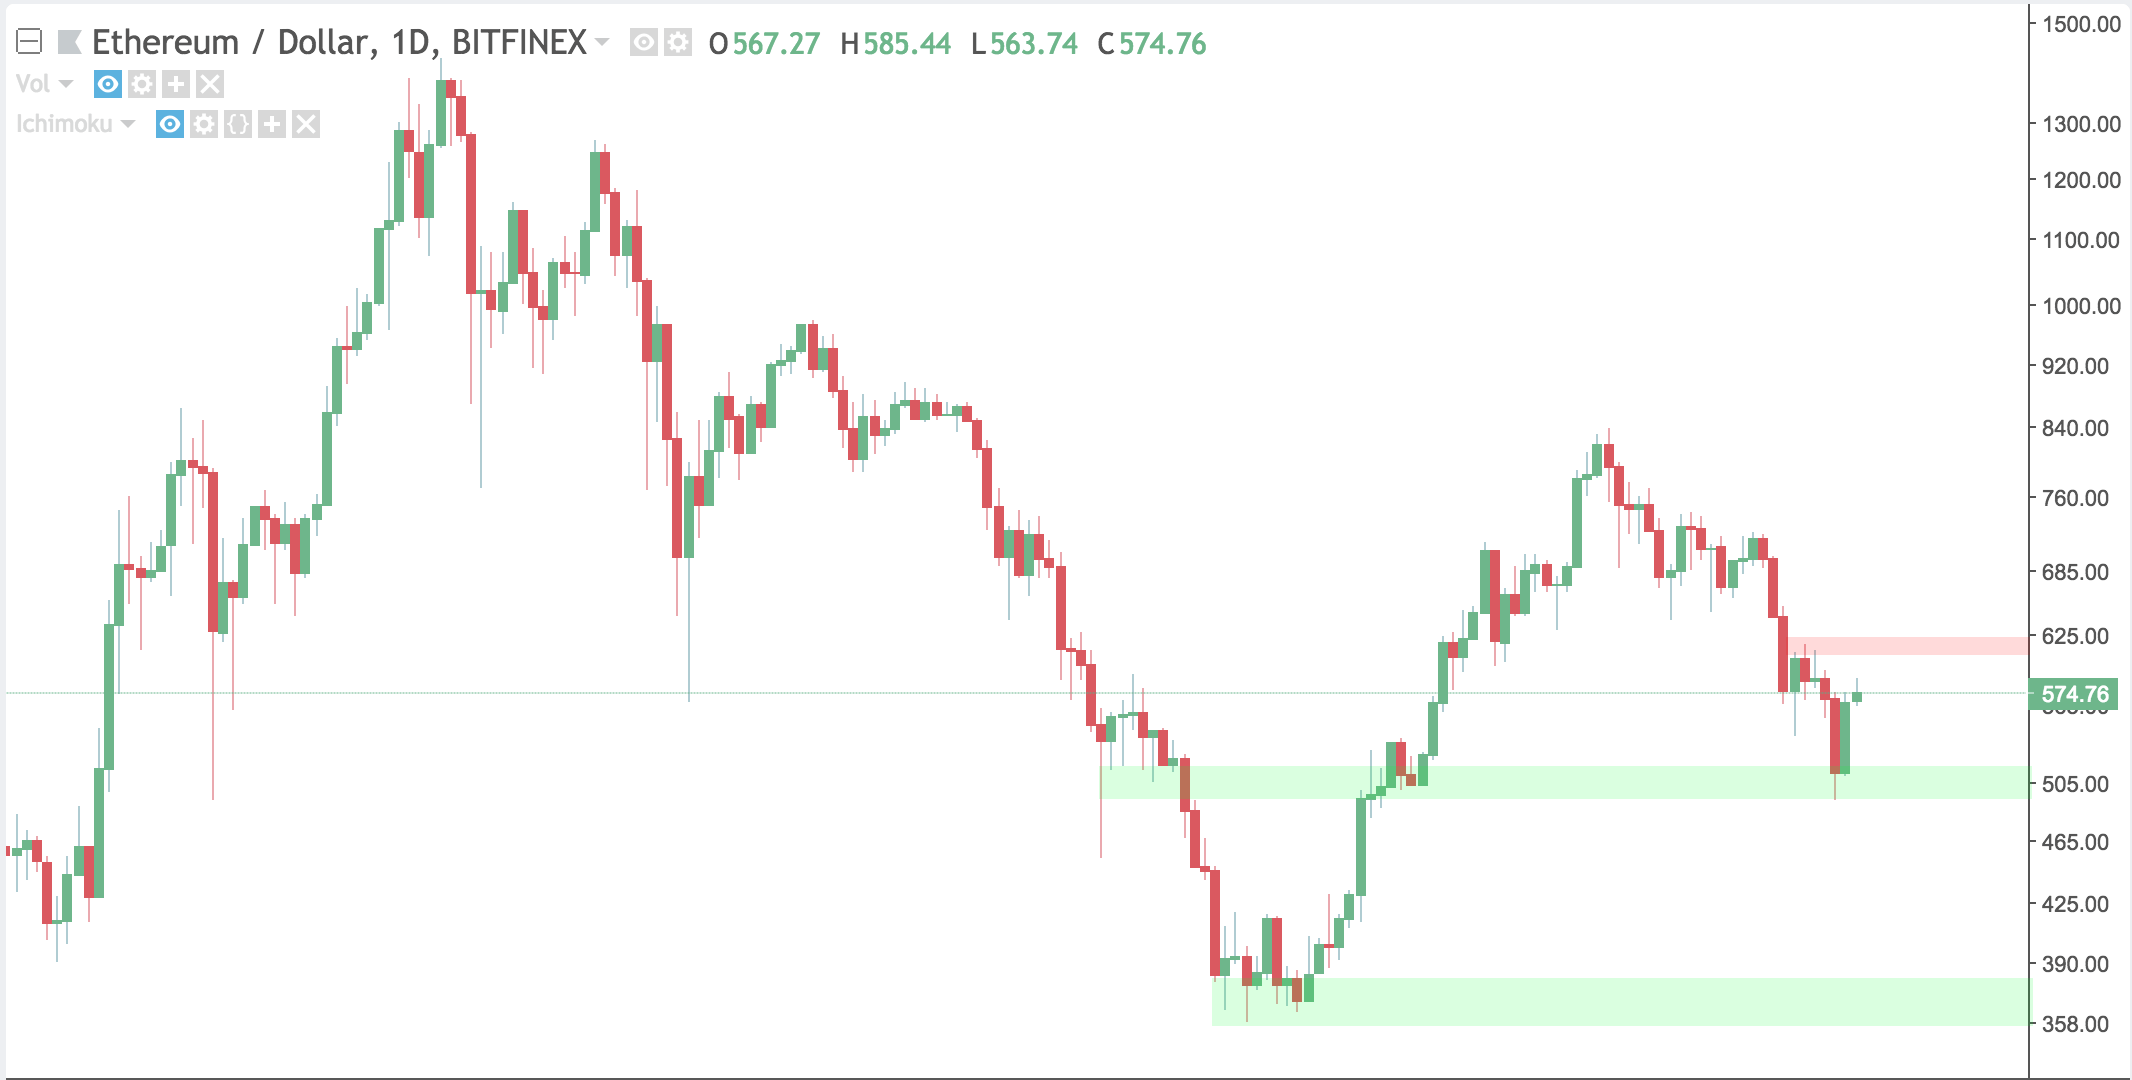
Adding Ichimoku Clouds to the picture, we see that Ethereum broke out the cloud. After breaking out a few days back, it is making an attempt at entry. Keep an eye out for a definitive cloud rejection, as they can be quick and easy trades to make.
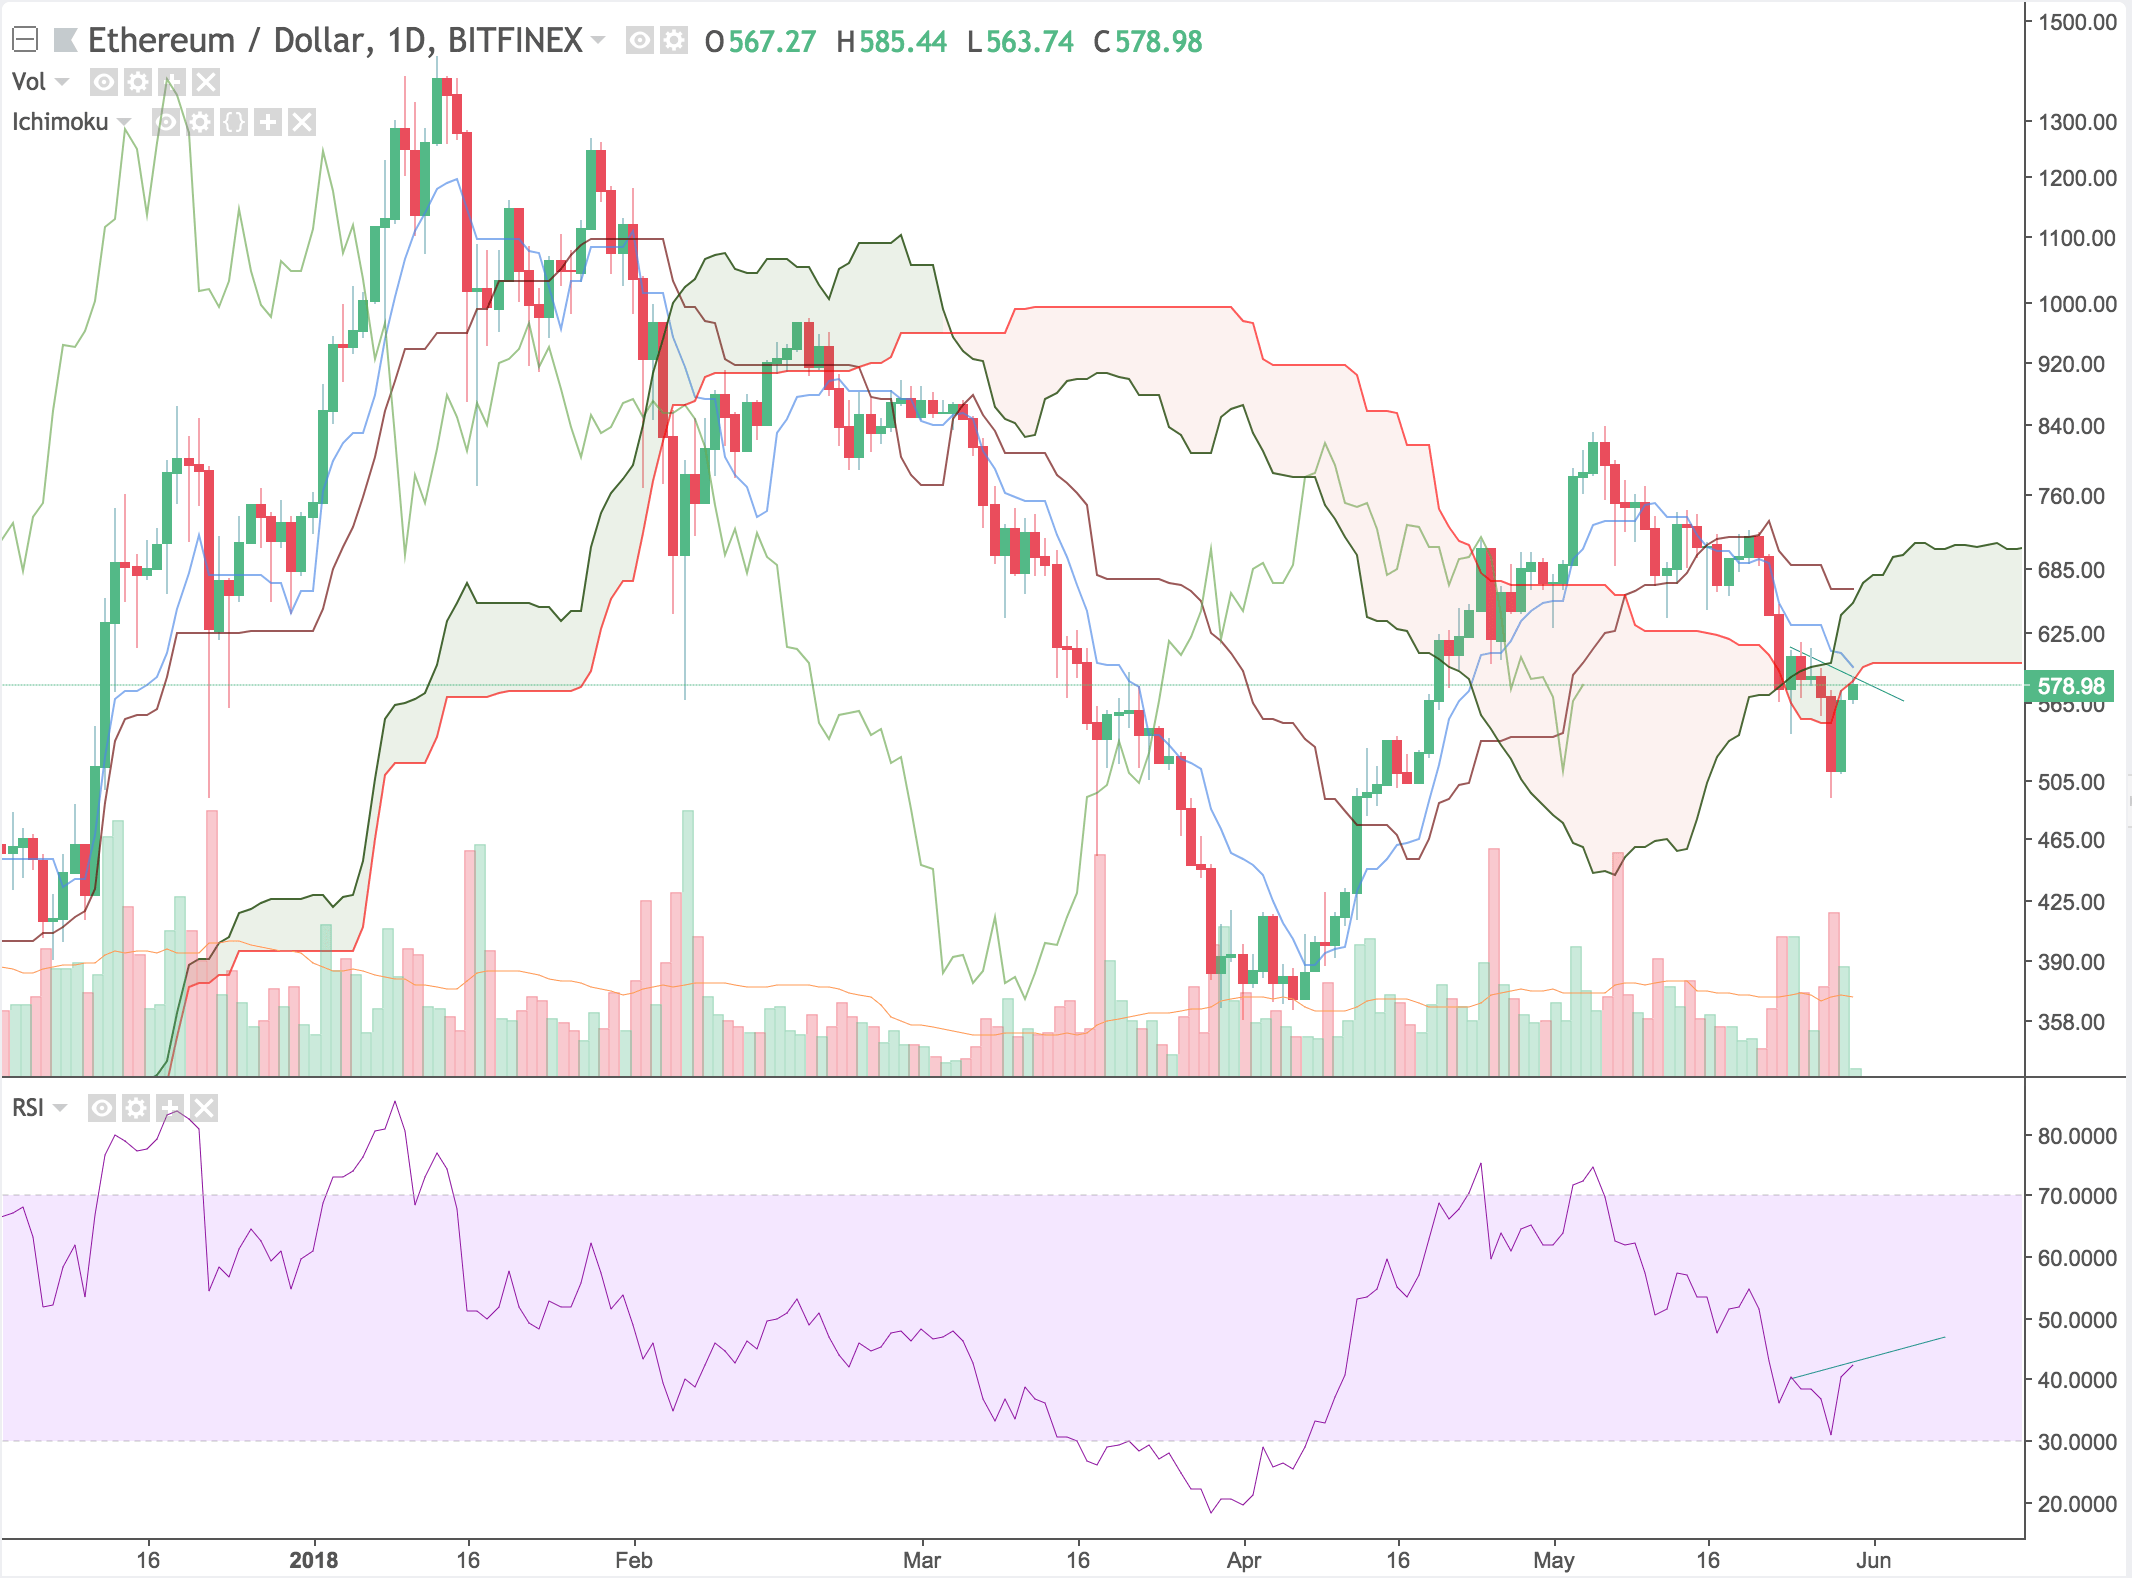
Looking at RSI, we see that there is bullish divergence. A bullish divergence occurs when the price is making lower lows, and the oscillator is making higher highs. This is further illustrated using the green trend lines.
Legendary trader, Peter Brandt, sees a head and shoulders forming on the ETH/BTC chart, which supports the theory of more downside.
There is a name for what might be happening to $ETHBTC pic.twitter.com/iIOseChG4T
— The Factor Report (@PeterLBrandt) May 27, 2018
Litecoin
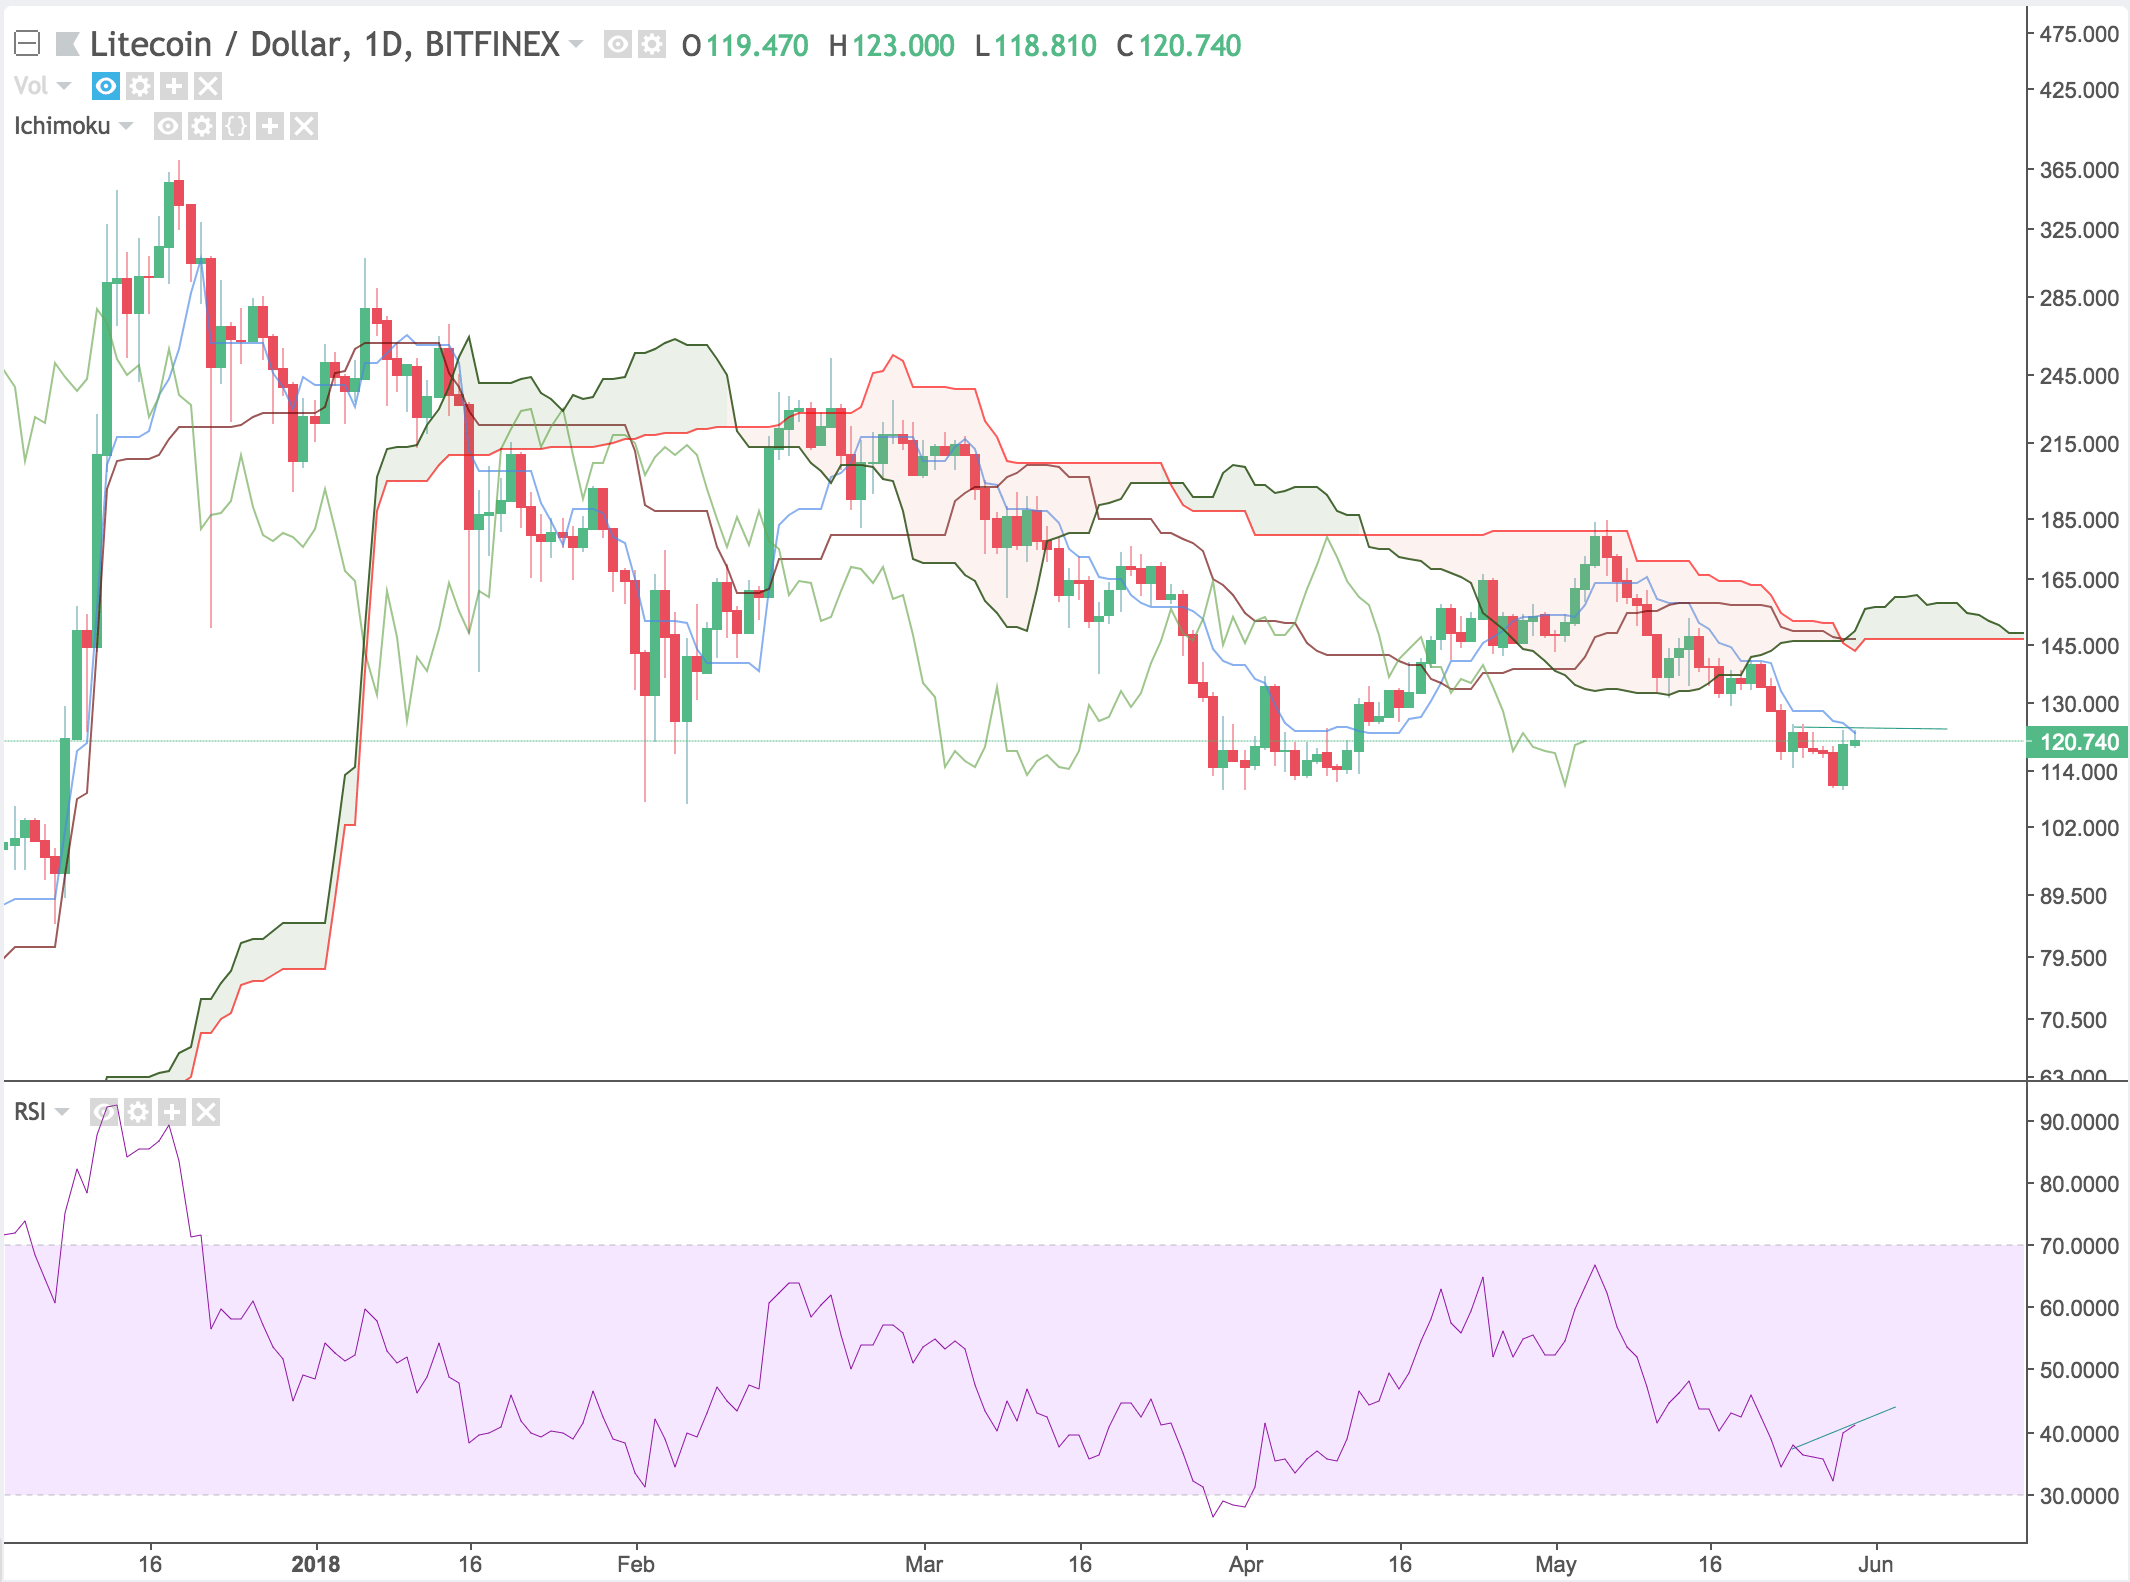
Litecoin is in a similar boat as Bitcoin and turned away from a retest of support. If it falls below the green support level, expect more downside. If it definitively bounces off the support level, look to take a trade on the upside to the $140 area.
Using Ichimoku Clouds, we see that Litecoin is also below the cloud and is forming a bearish cloud. A bearish TK-Cross is still a bit of a way off from forming, but if it does could spell even more downside for Litecoin. It is testing the Tenkan-Sen which is the faster moving average, so keep an eye out for how it reacts to the level.
Bitcoin Cash
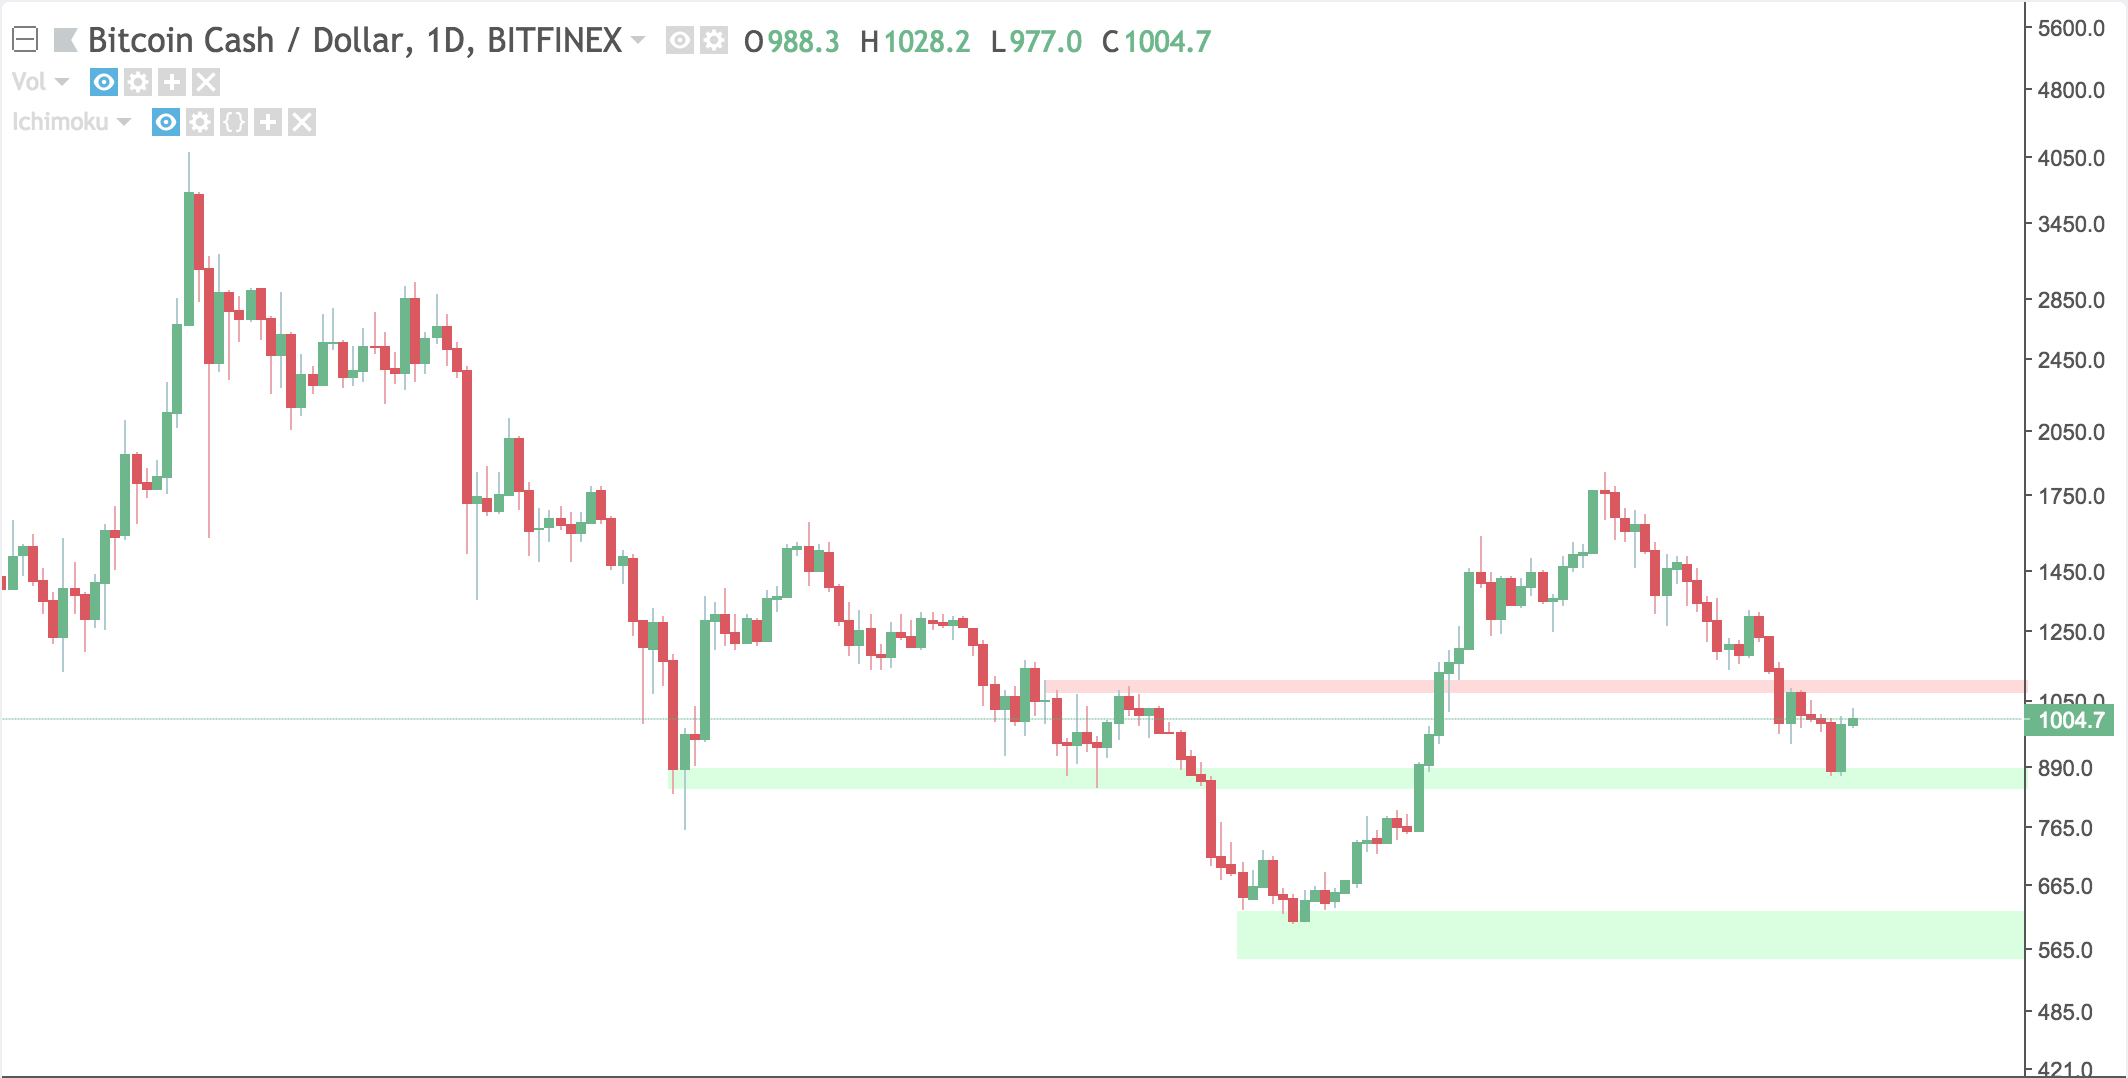
Bitcoin Cash continued to fall after its major drop last week. While most cryptocurrencies are falling, this could have to do with the controversial Bitcoin Cash hard fork. Bitcoin Cash started the week at $1300 and is at $1000 now.
Bitcoin Cash is also below the cloud and is moving towards the Tenkan-Sen. Look for a retest of the Tenkan-Sen and bottom of the cloud.
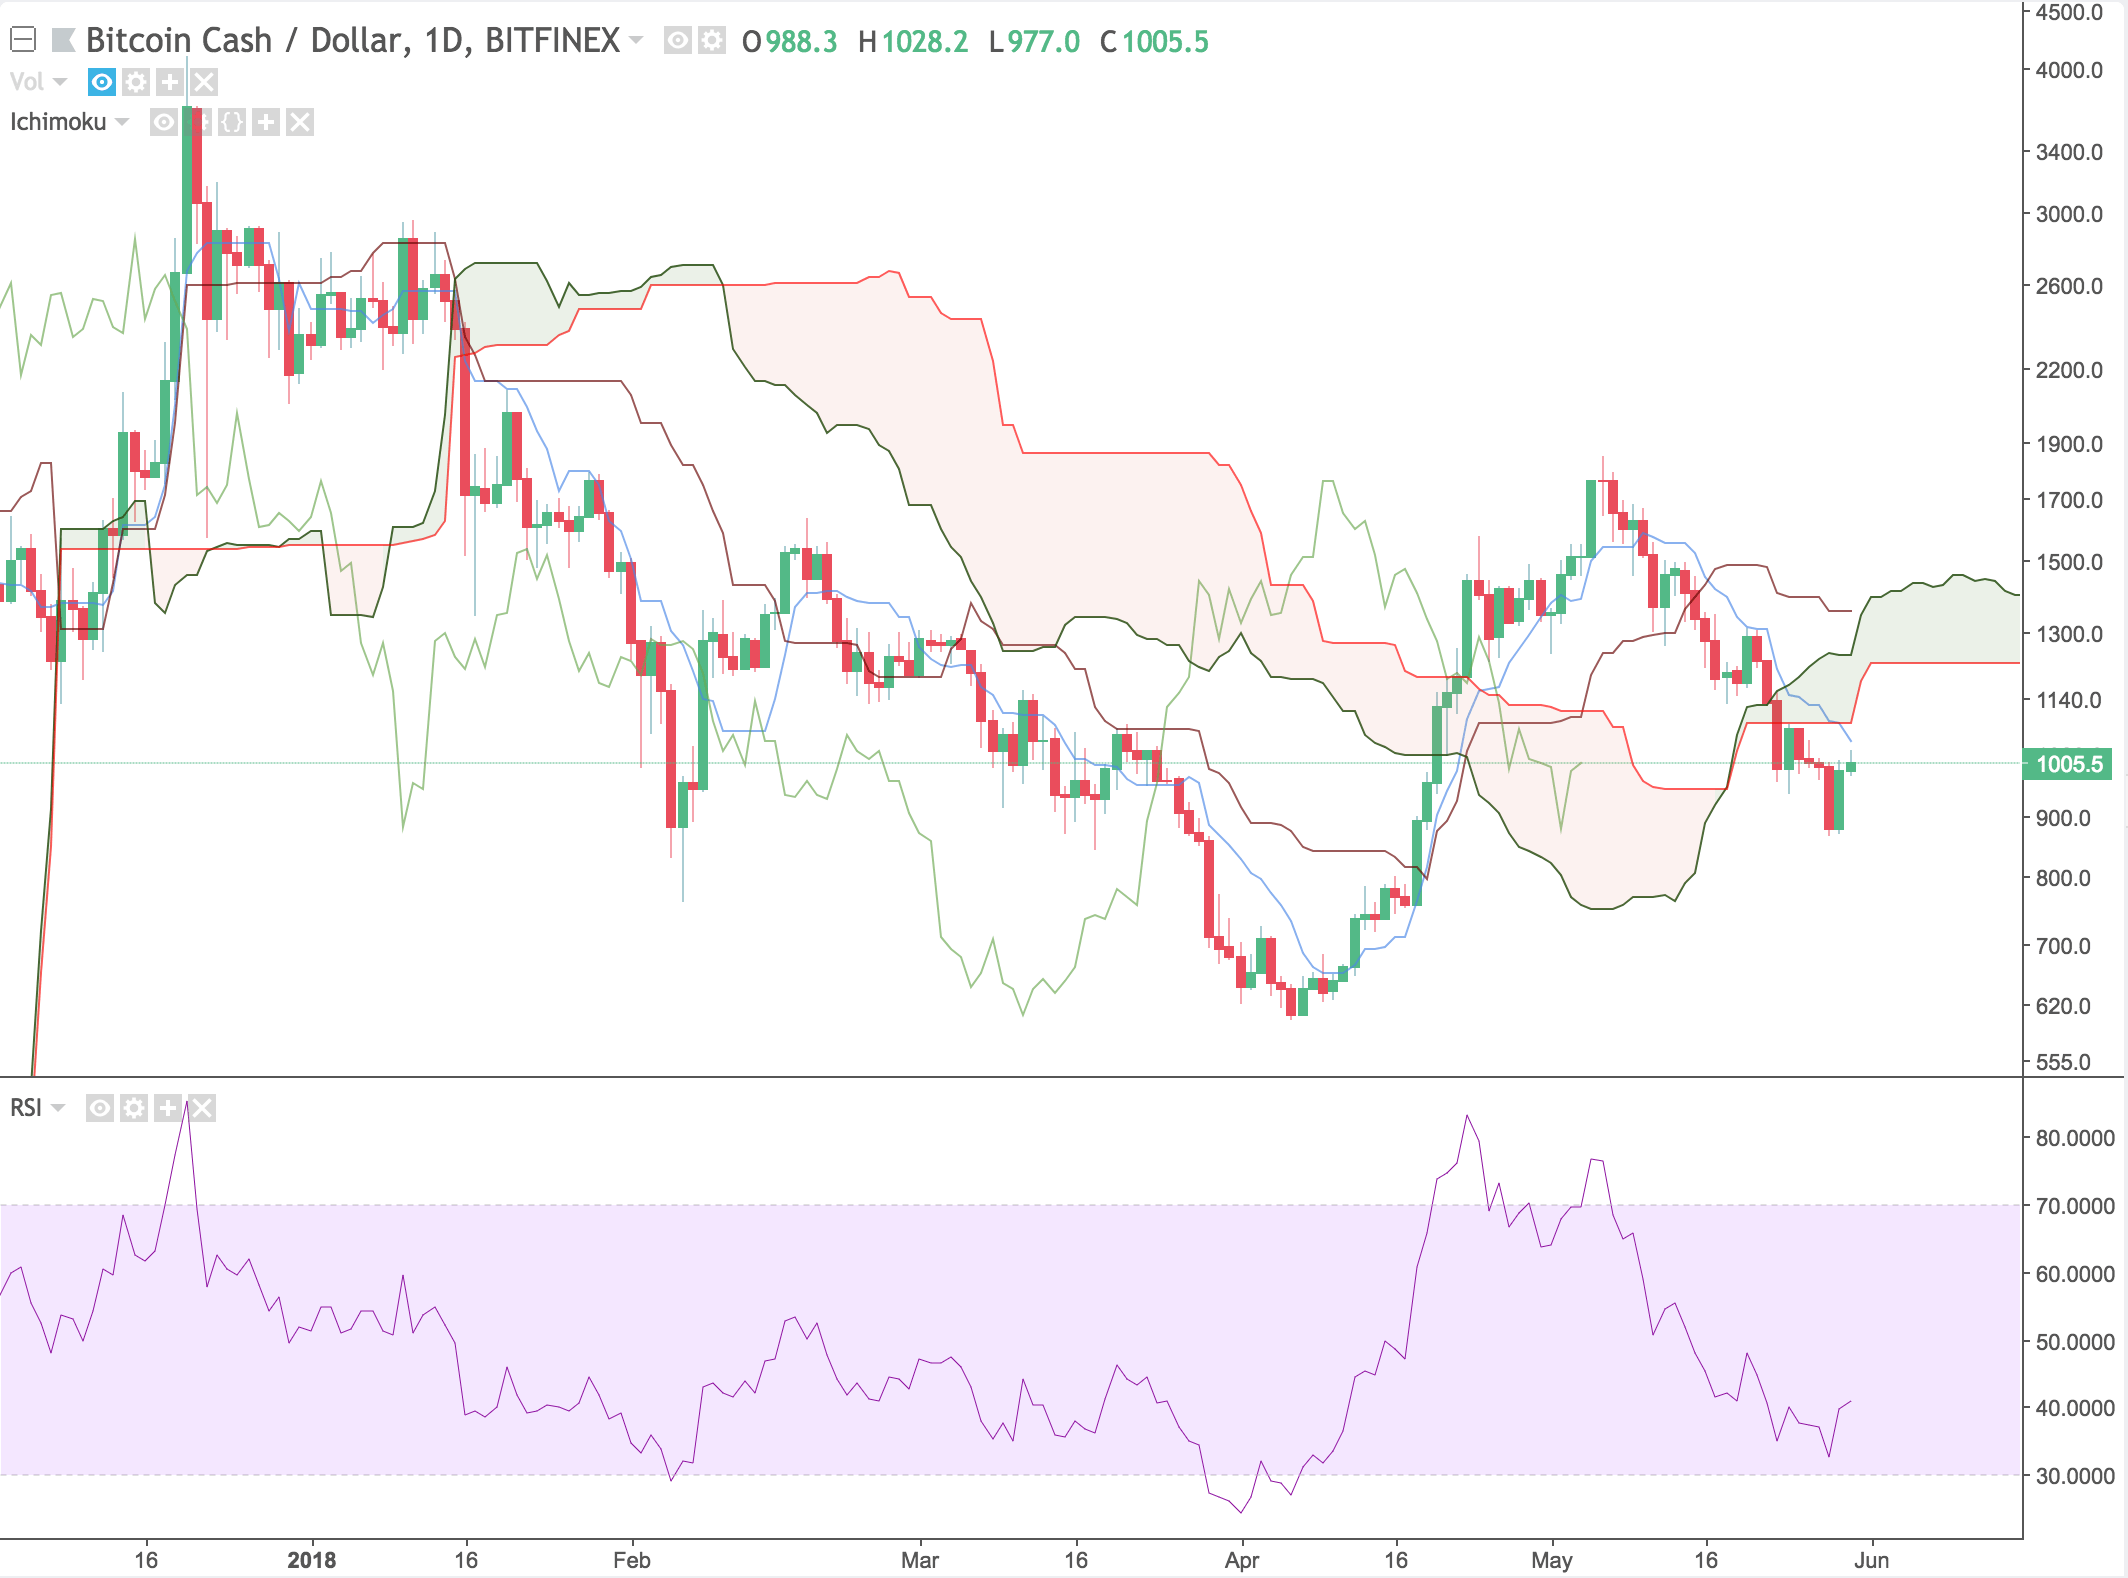
Not much is going on in RSI land. Price bounced near the oversold level and there is little to no divergence.
Ripple
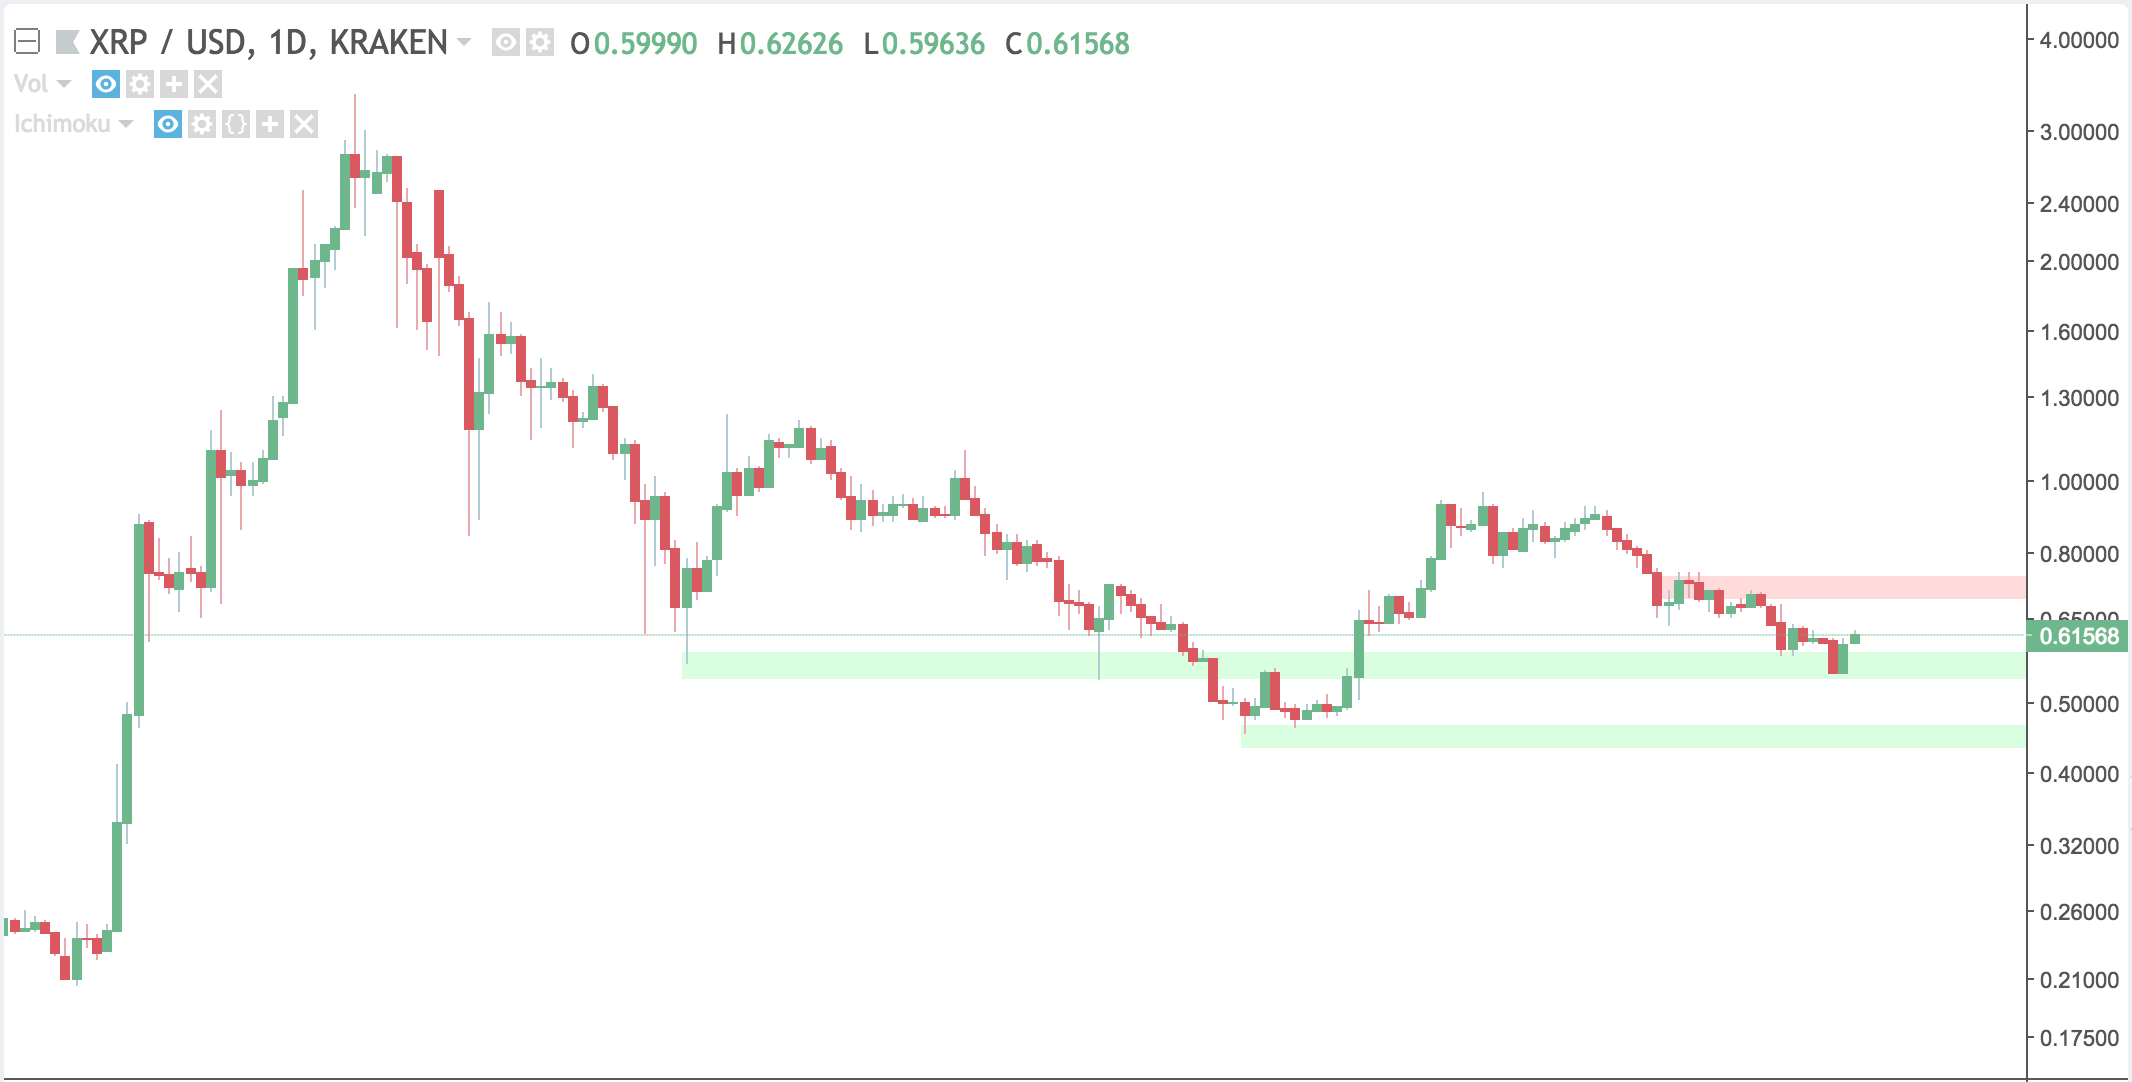
Ripple continued the downward trend with a fall from $.70 to $.60 in a week. It has two support levels to look out for at $.59 and $.50.
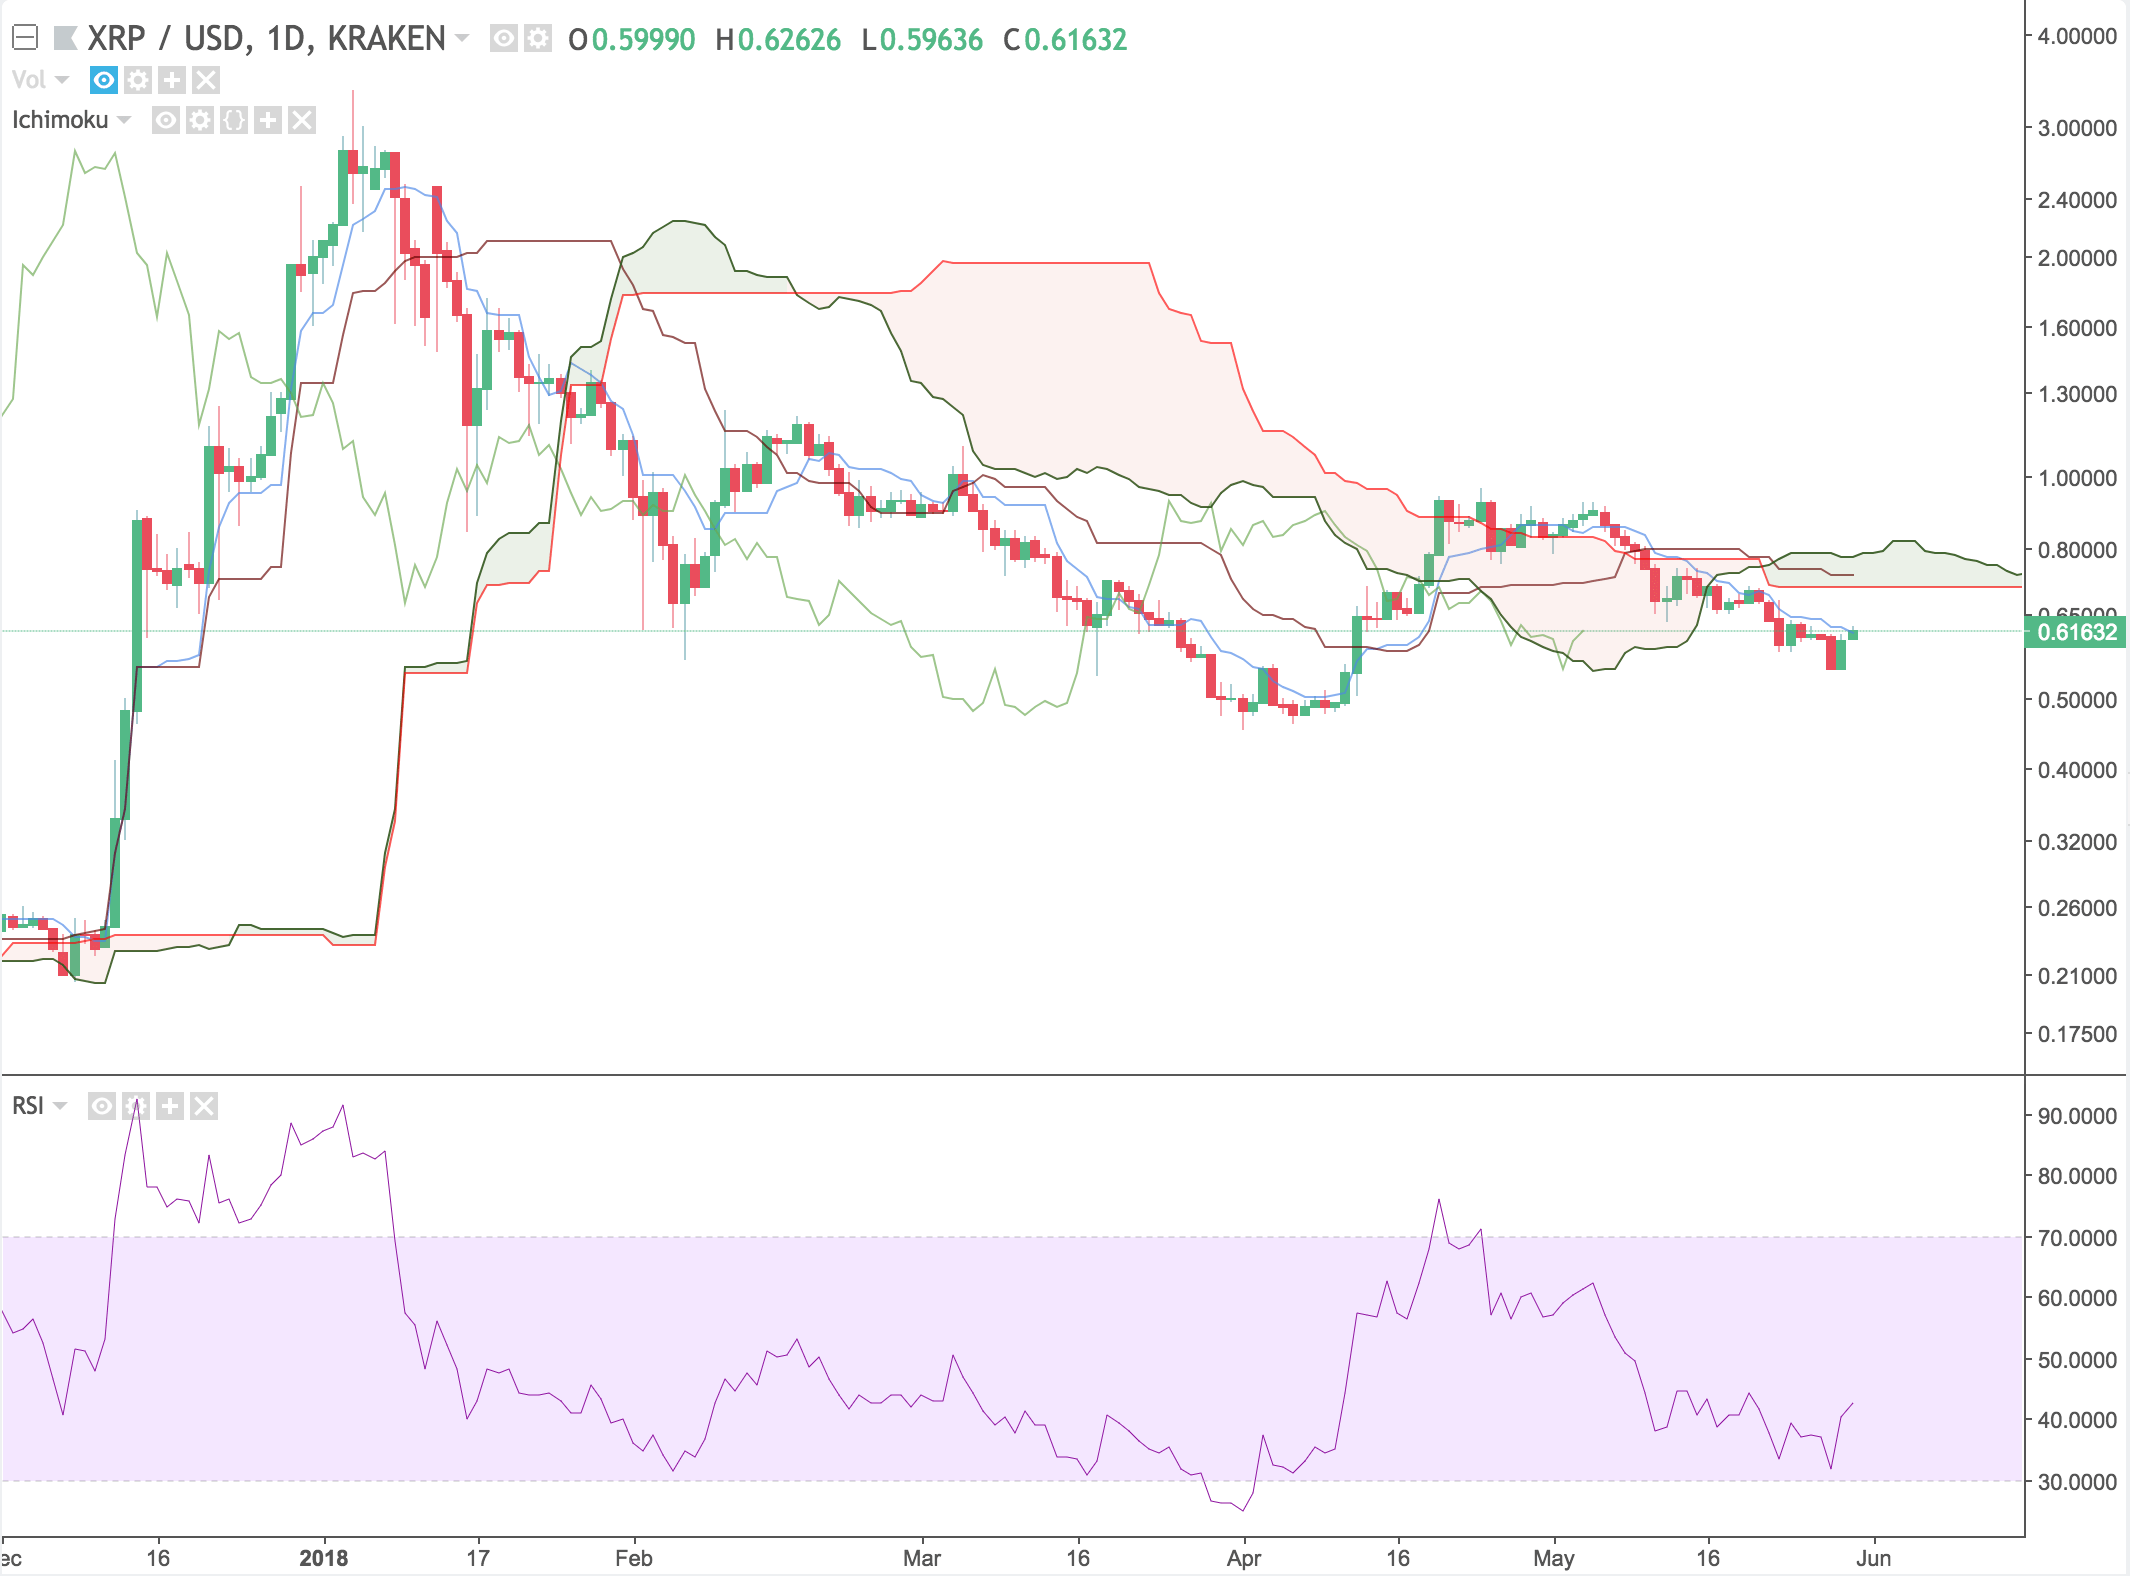
Ripple is below the cloud after recently moving out, with a flat bottom cloud above it. The lagging span will be making an appearance in a week or so which will confirm the downward trend if it is below the cloud.
Ripple is also testing the Tenkan-Sen and looks to be breaking through it. If it successfully breaks through, expect it to be attracted to the top of the flat Kumo cloud like a magnet.
Conclusions
On most of the charts, we are seeing price below the cloud and support levels being retested. Support levels can only hold so many times before traders lose hope and expect more downside.
The next few weeks will be critical in determining where cryptocurrency markets are headed, as most of the discussed currencies turned away from support tests. If the levels hold up, some easy trades can be made off the bounces.
Overall, cryptocurrency markets still seem bearish. If a bottom happens, it will probably be quick, with price bouncing off the absolute low, and forming a large wick.
There are no guarantees with technical analysis, and this post is simply an interpretation of the current market situation.
To see some more cryptocurrency and trading-related content, follow Austin on Twitter.
Glossary
Here are the definitions for each of the technical analysis terms used in this article.
- Senkou Span A – an indicator that is used to measure momentum, as well as future areas of support and resistance. Senkou Span A is always drawn in relation to Senkou Span B – together, they form the cloud.
- Senkou Span B – forms the cloud along with Senkou Span A. Traditionally when Senkou Span B is located below Senkou Span A, it is a symbol of bullish price movement.
- Senkou Span cross – The cloud is an area of uncertainty. Most traders do not make a move until price closes above or below the cloud – although, when the Senkou Spans cross one another, many traders use the indicator to predict the reversal of a current price trend.
- Kumo Twist – The Ichimoku Cloud is a Japanese trading strategy, and ‘Kumo’ means cloud in Japanese. The Kumo Twist is just a nickname for a Senkou Span cross.
- Tenkan-Sen – The Tenkan-Sen is used in conjunction with the Kijun-Sen to predict long and short positions. The formula for the Tenkan-Sen’s calculation takes the highest high and the lowest low and divides it by two over the last seven to eight time periods.
- Kijun-Sen – Similarly to the Tenkan-Sen, the Kijun-Sen is calculated using the same formula, but it usually includes the last 22 time periods. The Tenkan-Sen highlights short-term price movement, while the Kijun-Sen gives a better idea of long-term price movement.
- TK crossover – When the Tenkan-Sen crosses above the Kijun-Sen, it is an indication of bullish price movement. Conversely, the Tenkan-Sen crossing below the Kijun-Sen is a bearish sign. Both of these signals are known as a TK crossover. The location of the TK crossover impacts the strength of the signal. For example, a bullish TK crossover below the cloud is in bearish territory, and therefore a weak signal. On the other hand, a bullish TK crossover above the cloud is a strong signal.
- Chikou Span – Otherwise known as the Lagging Span, Chikou Span shows where the price was 26 periods before the most recent closing price. An upwards Lagging Span above price shows bullish momentum, while a Lagging Span below price shows bearish momentum.
- Volume – Is the amount of a stock, currency or asset exchanged in a given period of time. This can be expressed in terms of the unit (ex. Bitcoin) or standardized in terms of a currency such as dollars.
- Momentum – Momentum measures the strength or rate of acceleration of price action.