 Bitcoin nearly touches $6k, where will it go from here?
 Bitcoin nearly touches $6k, where will it go from here?

Cover art/illustration via CryptoSlate. Image includes combined content which may include AI-generated content.
After a dramatic week surrounding Bitfinex and Tether, bitcoin shrugged off news-related losses and rose 11 percent. Now it’s fighting strong resistance around the $5,950 level. If it is able to break above resistance, new highs may follow.
Bitcoin Technical Analysis
On Apr. 23, 2019, bitcoin reached a high of $5,650, which has been the highest valuation it has had since the low of Dec. 15, 2018, when it was trading at $3,129. After falling 12 percent all the way down to $4,963 on Apr. 25, bitcoin went through a consolidation period for the next 5 days. On Apr. 30, around 12:00 AM UTC, it finally broke out to reach a high of $5,797 on May 3.
4-Hour Chart
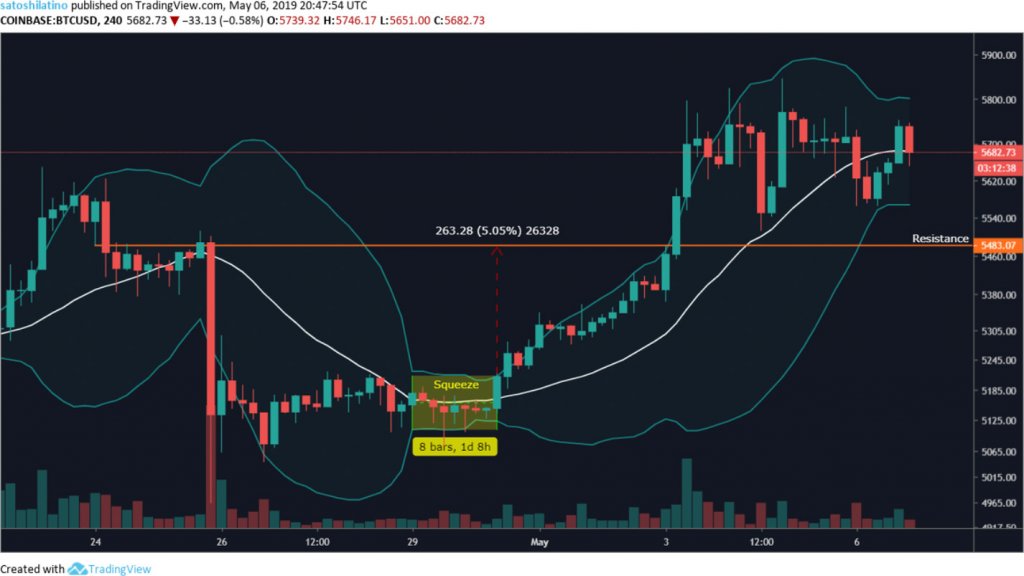
A Bollinger Band, developed by John Bollinger, is a technical analysis indicator comprised of three lines: a simple moving average, which is the middle band, and an upper and lower band. The closer the price move to the upper band, the more overbought the asset is, and the closer the price moves to the lower band, the more oversold the asset is. The squeeze, which is when the bands come closer together indicates a period of low volatility considered to be a potential sign of future volatility.
On the 4-hour chart, the Bollinger Band seem to have predicted the recent move. They began squeezing on Apr. 29, and after one day and eight hours bitcoin finally broke out. Out of the 11 percent move, a 5 percent gain could have been taken by setting a sell order on the resistance level that formed around $5,480.
Now after the recent move, the Bollinger Bands appear to be squeezing once again predicting a period of low volatility and consolidation before a breakout.

12-Hour Chart
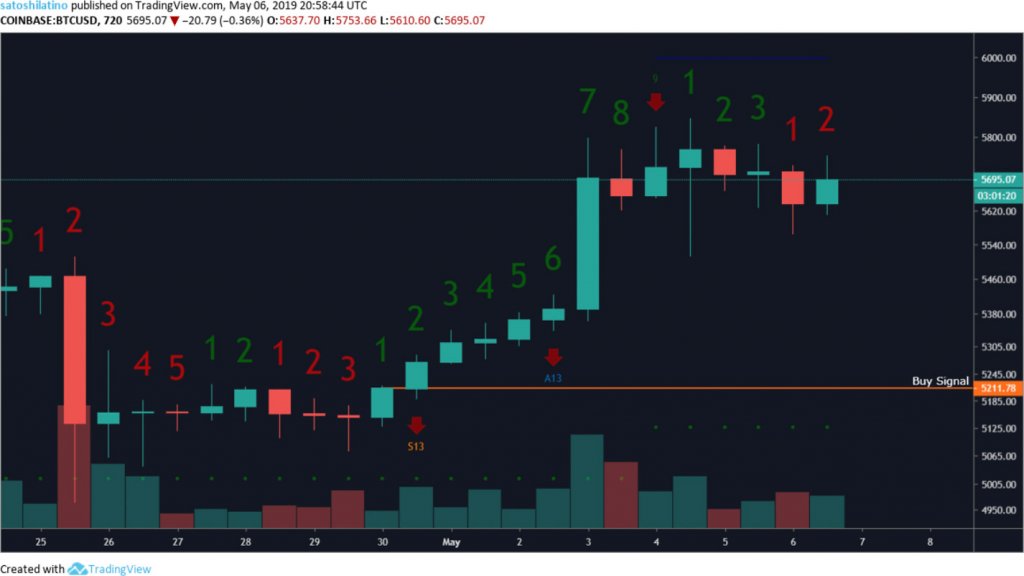
The TD Sequential Indicator, created by Tom Demark, is a tool used in technical analysis that sets various numbers above and below the candlesticks on a chart. To sum up, a bullish signal is given when the indicators show a red nine candlestick and/or when a green two candlestick trades above the previous green one candle.
Conversely, a bearish signal is given when there is a green nine candlestick or when a red two candle trades below the previous red one candlestick. The stop loss can be placed above the last high of the current bullish trend or the last low of the current bearish trend depending if its a long or short trade.
On the 12-hour chart, the TD sequential indicator gave a clear buy signal on Apr. 30, at 12:00 AM UTC, when a green two candlestick started trading above the previous green one candle. Now the current candlestick is a red two, which has not traded below the previous red one, so a sell signal will be given if the next candlestick is a red three trading below the current red two.
It’s arguably true that the first buy signal was actually given on Apr. 28, at 12:00 AM UTC, when a green two candlestick traded above the previous green one candlestick and a stop loss would have been placed at the last lowest point of the bearish trend which would have been at $4,963. Since the trend never reversed to that low, the trade still would have been valid.

1-Day Chart
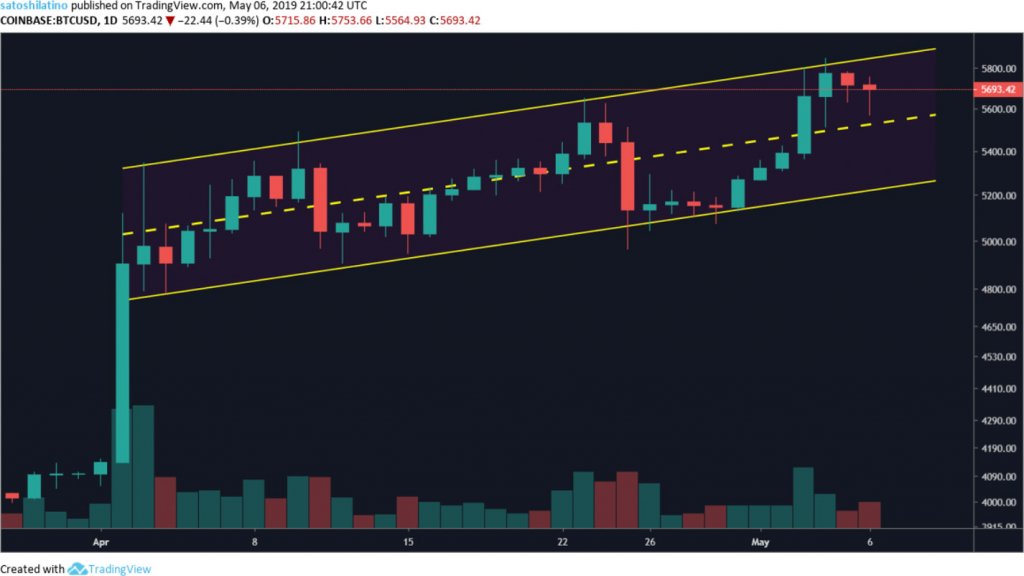
An ascending channel is the price action contained between parallel lines. Within an ascending channel, price does not always remain entirely contained within the parallel lines but instead shows areas of support and resistance that traders can use to set stop-loss orders and profit targets. A breakout above an ascending channel can signal a continuation of the move higher, while a breakdown below an ascending channel can indicate a possible trend change.
On the 1-day chart, bitcoin can be seen trading in an ascending channel since April 3. After touching the lower support line of the channel on April 29, the price has moved up to reach the upper resistance line to then fall and bounce off from the middle channel line. If bitcoin continues to trade within the upper side of the channel, it could be expected to see a period of consolidation before another move down to the bottom of the channel.
A breakout above the channel is possible and could happen at any time, the same could happen to the downside if the support level is not able to hold. Thus, the lower and the upper lines of the channel could be used as a stop loss if a trader is trying to catch the break out of the channel.

After a spike in the market valuation of bitcoin—that could have been predicted by looking at the Bollinger Bands on the 4-hour chart, the TD Sequential Indicator on the 12-hour chart, or the ascending channel on the 1-day chart—a period of consolidation could come before a pullback is triggered based on the same charts and indicators.
A break above the $5,800 resistance level could indicate that higher prices will come, while a break below the $5,000 support level could be a signal of a major correction.
Bitcoin Market Data
At the time of press 2:52 am UTC on Nov. 7, 2019, Bitcoin is ranked #1 by market cap and the price is up 3.86% over the past 24 hours. Bitcoin has a market capitalization of $104.87 billion with a 24-hour trading volume of $17.33 billion. Learn more about Bitcoin ›
Crypto Market Summary
At the time of press 2:52 am UTC on Nov. 7, 2019, the total crypto market is valued at at $188.28 billion with a 24-hour volume of $55.9 billion. Bitcoin dominance is currently at 55.77%. Learn more about the crypto market ›


