Are Ethereum, XRP and Litecoin on the road to recovery?
Cover art/illustration via CryptoSlate. Image includes combined content which may include the use of AI tools.
Over the last week, the entire cryptocurrency market suffered a significant downturn. But, as prices went down, it seems like demand is now picking up and altcoins are starting to rebound. The following technical analysis assesses whether Ethereum, XRP, and Litecoin are bound for a bullish impulse.
Ethereum (ETH)
After consolidating for 22 days within the 61.8 and the 65 percent Fibonacci retracement zone, Ethereum broke down of this trading range on Nov. 18. Since then, ETH plunged nearly 28 percent. It went from trading at a high of $185 to a low of $133.60.
Now, it seems like the 78.6 percent Fibonacci retracement level was able to contain the price of this cryptocurrency from a further decline. As the buying pressure behind Ether increases, it could try to test the resistance given by the 75 percent Fibonacci retracement level, at $153. Closing above this resistance level would increase the odds for a further bullish impulse to around $171 and $180.
The “In/Out Money” model from IntoTheBlock considers the distribution of Ethereum throughout individual wallets based on the current price. Based on this metric, the recent nosedive was held by nearly 3 million addresses containing over 32 million ETH with balances up to $137. This area could continue serving as a significant support level due to the number of investors with positions around it.
This model also stipulates that if Ethereum is indeed bound for an upswing, it will find strong resistance between $160 and $180. In this area, 3.36 million addresses are holding 13.20 million ETH.
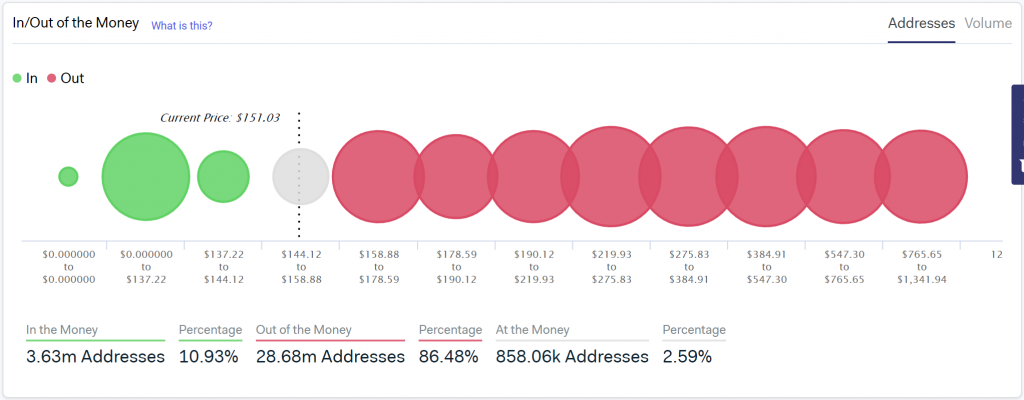
It is worth noting that the 3 million addresses carrying over 32 million ETH with balances from $0 to $137 poses a wide range of support. As a result, if Ethereum closes below $137, it could continue to plunge to hit the next level of support at $125 or $103.
XRP
The price of XRP was contained within the $0.24 support level and the $0.30 resistance level for nearly 100 days. During this time, every time this crypto hit support, it bounced off to resistance. And, when it reached resistance, it went back down to support.
As XRP continued testing the $0.24 support level, it took away its strength, getting it to break finally. The result was a 15.60 percent decline that took this cryptocurrency to the next level of support at $0.20.

Despite the recent downswing, XRP quickly rebounded, forming a dragonfly doji on its 1-day chart. This type of candlestick pattern signals a potential price reversal from bearish to bullish. The long lower shadow represents the sell-off seen during the period of the candle. But, as the day is closing, the demand for XRP is increasing, which is pushing the price back up.
The TD sequential indicator also adds credibility to the idea of a potential upward advance. This technical index is presenting a buy signal in the form of a red nine, under this time frame. This bullish signal estimates a one to four days correction to the upside or the beginning of a new upward countdown.
The fact that this is the second red nine candlestick in a row given by the TD sequential indicator increases the chances for an upswing. A green two candlestick trading above a preceding green one candle can be used as confirmation of the bullish impulse. Based on this technical index, XRP could find resistance around the setup trendline that sits at $0.27.
Nevertheless, a spike in the selling pressure behind this cryptocurrency could jeopardize the bullish outlook. If this happens and XRP moves below the recent low of $0.20, it would likely test the next support levels at $0.17 or $0.15.
Litecoin (LTC)
Litecoin’s price action since July of the present year appears to be characterized by a series of bear flags developing on its 1-week chart. This technical formation is considered a continuation pattern. It evolves after a significant correction that creates the flagpole. Then, the price goes through a consolidation period that forms the flag. And, it results in a breakout in the same direction as the initial movement.
The nearly 27 percent drop that LTC went through last week appears to be the result of a bear flag that formed in the middle of September. Now that it has reached the target given by this bearish formation, this crypto could enter another consolidation phase before it moves in a specific direction.
On the upside, if Litecoin closes above $48.50, it could try to test the next level of resistance at $53. And, if the volume behind it is significant enough, it could try to push further to the next resistance level at $58.
Conversely, a sudden increase in sell orders that takes LTC to close below the $44 support level could be catastrophic. Such a bearish impulse would likely push this crypto down to $41 or the next support level at $35.
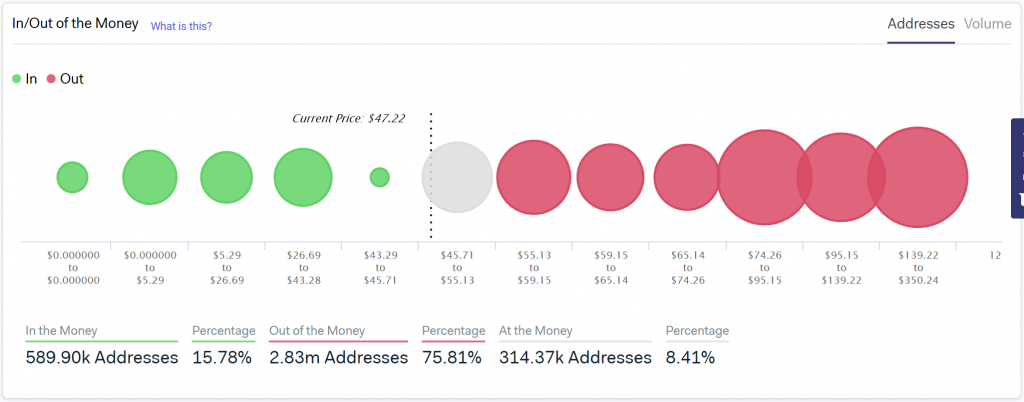
Based on IntoTheBlock’s In/Out Money model, the $55 to $60 area poses a certain level of resistance for Litecoin’s uptrend. In this zone, over 350,000 addresses are containing 4.17 million LTC. But, the real resistance sits between $74 and $95, where nearly 650,000 addresses hold approximately 10 million LTC.
On the other hand, this metric sees a significant support zone between $27 and $43. Around this area, 196,000 addresses are carrying 15.7 million LTC. Breaking through this zone would require a significant amount of volume.
Overall sentiment
The recent downturn in the market took many investors by surprise. Some expected the run-up to Bitcoin’s halving to be a positive catalyst for the entire industry. But, the steep decline turned the overall market sentiment into “extreme fear,” based on the Crypto Fear and Greed Index (CFGI).
While some are scared about the future of the market, others seem to be benefiting from the dip. The number of long positions on Bitfinex is rising exponentially. Now, it remains to be seen if the buying pressure behind the cryptocurrencies previously analyzed would increase so they can recover from the losses.