These three metrics suggest Ethereum still has some massive room to rise

Photo by Aaron Burden on Unsplash
Ethereum has seen some incredibly poor price action throughout the past several weeks, with the cryptocurrency’s severe underperformance of Bitcoin leading it to erase virtually all the gains that came about as a result of the latest market-wide upswing.
This weakness has led its market structure to become firmly bearish against its BTC trading pair, while also flashing signs of bearishness against USD as well.
In spite of this, Ethereum is showing some signs of immense underlying strength at the present moment, as fundamental indicators signal that it still has significant room to run.
These three data metrics have nailed previous Ethereum tops
There are three data points that have historically offered tremendous insight into whether or not an asset is beginning to form a long-term top.
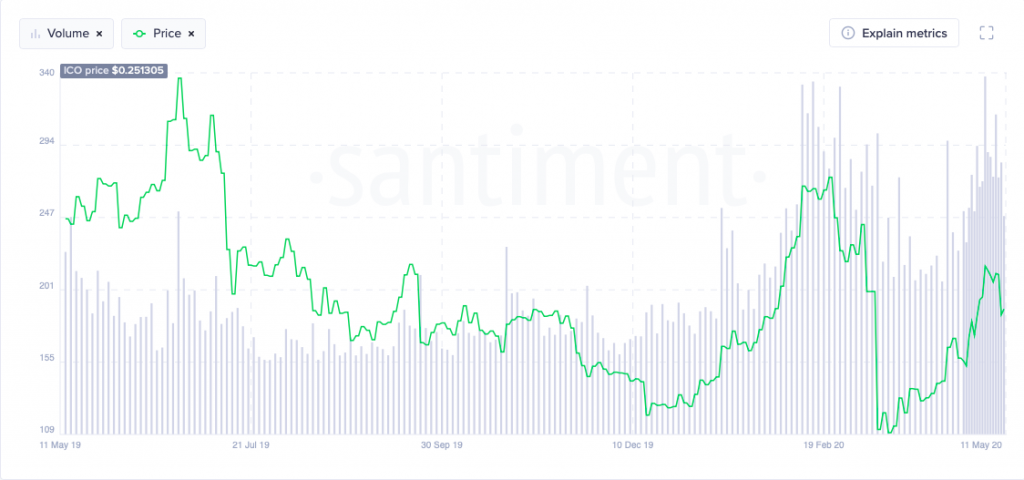
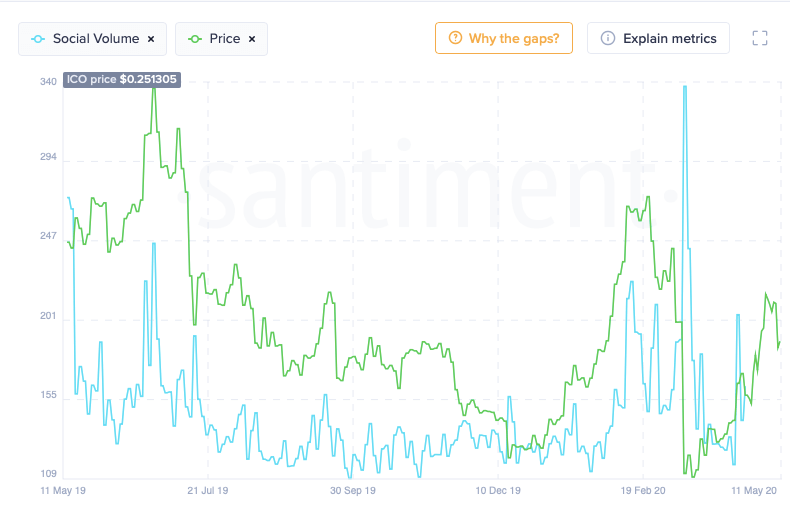
Analytics platform Santiment spoke about these factors within a research post from earlier this year, explaining that trading volume, social volume, and on-chain volume can all be used to pinpoint where an asset is within its pricing cycle.
In July of 2019 – when Ethereum topped out at over $350 – these three factors signaled that the crypto’s uptrend became “unhealthy” once its price passed roughly $250.
They spoke about this in the post, explaining that the same top pattern “holds up across the board” when there is a clear divergence between its price and collective volume.
“The same top pattern holds up across the board. As long as the price keeps growing on the growing volume (healthy zone), the trend will likely continue. Once we see clear signs of price-volume divergence (unhealthy zone), you should be aware – the top is near.”
What are these factors saying about ETH’s present price action?
Unlike the patterns seen in July of 2019, Ethereum is not currently flashing any types of divergences between its volume and its price action.
The below chart shows that currently, Ethereum’s aggregated price is trading well below its overlaid volume, meaning that its multi-month rebound from lows within the sub-$100 region has been incredibly healthy and could extend much further.
A similar trend is seen while looking towards its social volume, which has also been trending higher alongside its price in recent times.
It remains unclear as to whether or not this fundamental strength will be enough to invalidate its present technical weakness, but it does offer some hope for embattled investors.