 Last time Bitcoin printed this technical signal, it rallied nearly 3,000% — and it’s back
 Last time Bitcoin printed this technical signal, it rallied nearly 3,000% — and it’s back

Photo by Chinh Le Duc on Unsplash
Bitcoin’s inability to decisively break above the $10,000-10,500 resistance level hasn’t been seen as the most bullish of signs by investors.
One trader that called that BTC would drop to the $3,000s months before it happened recently went as far as to say that without turning $10,500 into support, the cryptocurrency is on track to revisit the $3,000s, then fall even lower.
Yet a growing number of long-term indicators suggest that Bitcoin is on the verge of a long-term bull rally that will likely take cryptocurrencies parabolically higher from current prices.
Long-term bullish technical signals appear for Bitcoin
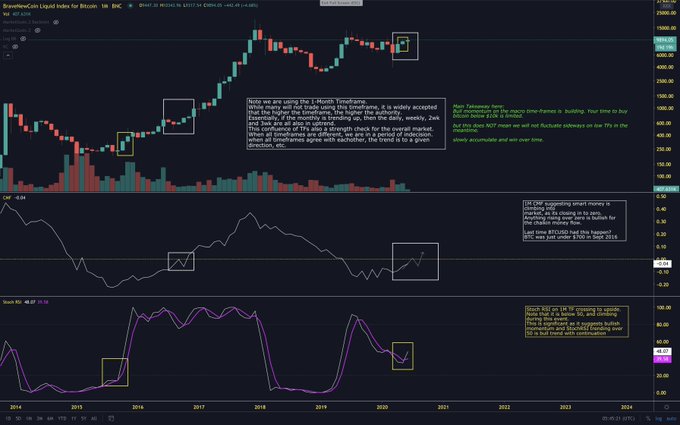
Prominent technical analyst and former CryptoSlate contributor Eric “Parabolic” Thies shared the chart below on Jun. 10, which depicts Bitcoin’s price action over the past six years from a one-month time frame perspective.
The chart shows that there is a “bull momentum” building, meaning that “your time to buy Bitcoin below $10k is limited.”
Two indicators on the chart show this, the analyst explained:
- 1) The Chaikin Money Flow (middle segment in the chart below), which tracks accumulation and distribution over time, shows that “smart money is climbing into” as the metric reaches the 0.00 baseline. The last time this happened was when BTC was just under $700 in Sep. of 2016. What followed was a near 3,000 percent surge to $20,000 in 14 months.
- 2) The Stochastic Relative Strength Index (bottom segment in the chart below), which tracks the trend of an asset, hs “crossed to the upside” after trending lower since mid-2019. This suggests that the bull trend that has transpired over the past few months will continue, Thies wrote.

The fundamentals corroborate the optimism
The fundamentals corroborate this the expectation that Bitcoin will soon trade in a full-blown bull run, analysts have said.
As reported by CryptoSlate previously, Blockstream CEO Adam Back argued that with the confluence of money printing by central banks and the relative unattractive nature of other asset classes like real estate and bonds, Bitcoin is making more and more fundamental sense. So much sense that it could hit $300,000 in the coming five years, the executive told Bloomberg.
Similarly, crypto fund BlockTower Capital explained last month that the “macro case for Bitcoin has never been more obvious.”
BlockTower’s analysts cited a confluence of reasonings, including the flaring geopolitical tensions between the U.S. and China over Hong Kong, the increase in popularity of digital tech amid these pandemic times, currency and economic collapses in emerging market economies (Syria, Lebanon, etc.), and an “erosion of trust in central banking.”


 Farside Investors


