Bullish signal suggests the bottom is in for bitcoin, says technical analyst

Cover art/illustration via CryptoSlate. Image includes combined content which may include the use of AI tools.
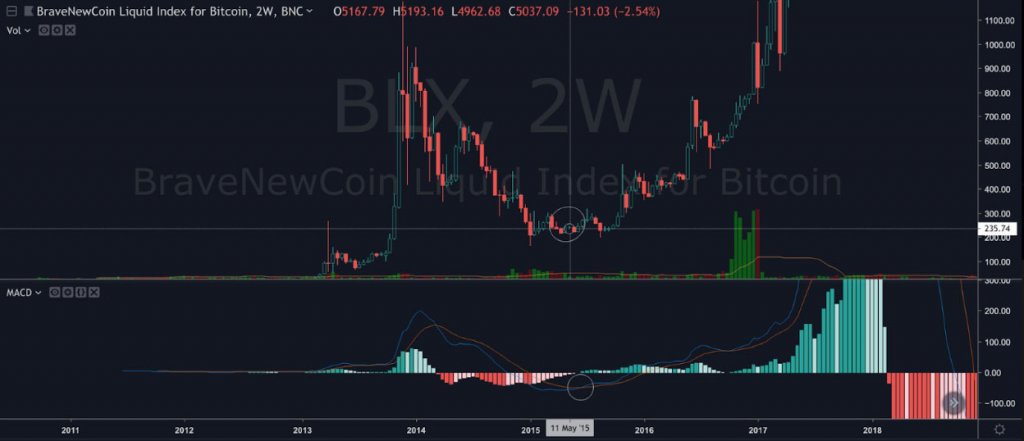
A trading indicator in the bitcoin markets suggests the bottom may be in, according to one technical analyst. The two-week MACD of bitcoin crossed into a buy signal on Apr. 1st, the first time since May 11th, 2015, the bottom of the market before it exploded in 2016-2017.
Technical analyst Eric Thies recently tweeted on Apr. 16 his organization entered into a position on bitcoin when the price was $4,000. His reasoning: bullish signals from two-week MACD.
Moving average convergence divergence, or MACD, is a trading indicator that shows the relationship between two moving averages of an asset’s price.
The 2W MACD has crossed in a buy signal on $BTC. We opened @ approx $4k.
The last time it happened? May 2015. #Bitcoin opened around $240.
We can still drop in accumulation, but the bottom is in 'folks. pic.twitter.com/5X7Dc9qc5S
— Crypto Thies (@KingThies) April 16, 2019
Understanding MACD
The MACD indicator is calculated using two exponential moving averages (EMAs) which place greater weight on the most recent data, compared to a simple moving average (SMA) which applies an equal weight to all price data over a period.
Then, a moving average (EMA) of MACD is taken to produce a “signal line,” which can signal buy and sells. Traders typically buy when MACD crosses above its signal line and sell when it crosses below.
Check out Investopedia for the details on calculating MACD.
Two Week MACD Signals Bottom
As shown by charts provided by Crypto Thies, the two-week MACD has crossed into a buy signal for BTC:
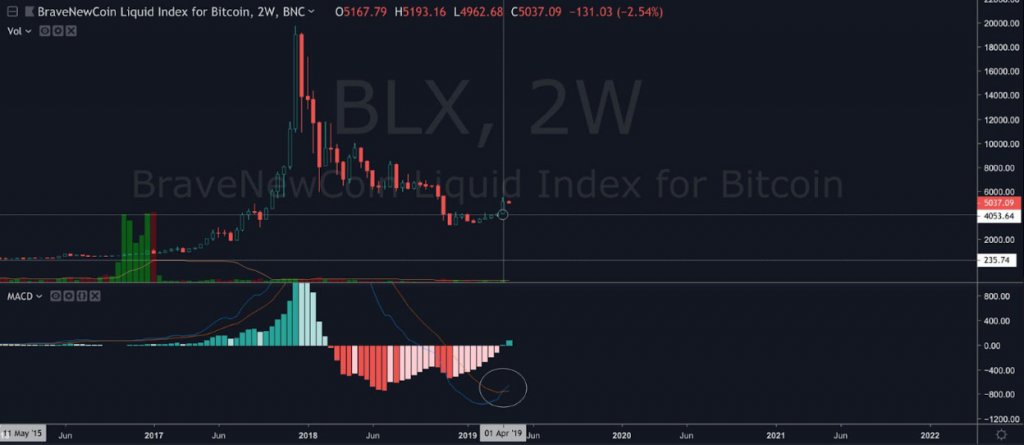
As shown on the chart above, as short-term MACD (blue) crosses above the signal line (red), the indicator gives a bullish signal—meaning the price of the asset is more likely to experience upward momentum.
The last time such a cross occurred was in May 2015, when Bitcoin was roughly $240, a bottom in the market following two exceptional years of consistent growth, as asserted by Thies.

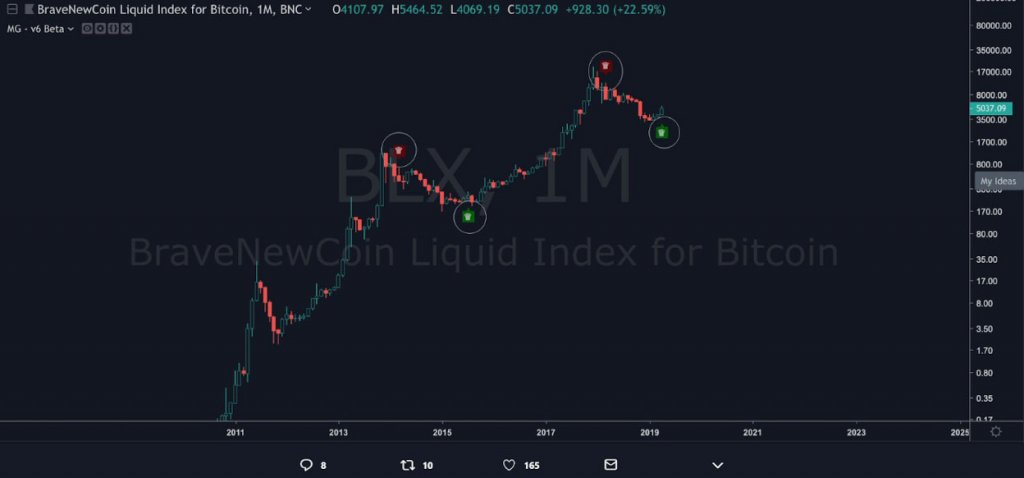
To further back his claims, Thies posts his previous trading record which suggests he entered and exited trades impeccably with the tops and bottoms of the market from 2014 to 2019:
Problems with MACD
As with all trading indicators, there is never an absolute certainty. Investopedia elaborates on a few of the issues of using MACD as a signal for trend reversals—when the market goes from bearish to bullish or vice versa.
MACD sometimes signals a trend reversal and then no reversal happens; other times, it doesn’t forecast a reversal. In other words, the indicator produces many false positives.
False positives for MACD can often occur when the price of an asset moves sideways. Such movement will cause the MACD to equalize from previous extremes. And, some suggest Bitcoin has been trading sideways for a good portion of 2019.
Limitations aside, Crypto Thies suggests there’s still time for accumulation on the way up.