Bitcoin network value at all-time high based on average price paid per BTC

Cover art/illustration via CryptoSlate. Image includes combined content which may include the use of AI tools.
The value of the Bitcoin network is at all-time highs based on the average price holders paid for their coins. The metric used, realized market capitalization, is also a surprisingly effective indicator for predicting BTC market tops and bottoms.
Issues with market capitalization
Market capitalization gives a skewed value for the Bitcoin network. Borrowed from the realm of traditional equities, market capitalization is the price of all coins in circulation multiplied by the last price the coin traded at.
Market capitalization: coin supply * last spot price
Market capitalization has several deficiencies. Large quantities of coins that are lost, unrecoverable, worth less than the associated transaction fees, or merely held by unshakeable holders, still impact a crypto-asset’s capitalization.
One notable example is addresses associated with Satoshi Nakamoto, the anonymous creator of Bitcoin. Satoshi Nakamoto is said to hold 980,000 BTC based on analysis of the early Bitcoin blockchain—5.5 percent of the current supply and 4.7 percent of the maximum supply. These coins are largely considered lost but are still factored into market capitalization.
Using realized market capitalization
In contrast, realized market capitalization—the value of all coins in circulation at the last price moved (using UTXOs)—provides an approximation for what people spent on their BTC in aggregate. Invented by the Coinmetrics team members Nic Carter, Pierre Rochard, and Antoine Le Calvez et. al., it weighs coins based on their actual presence in the Bitcoin economy.
As put by Coinmetrics co-founder Nic Carter, it can be described as an on-chain volume-weight average price of BTC.
Realized capitalization: coin supply @ price at time of movement * coins involved in move
“Another way is seeing it as an indicator of the sum of levels where groups of long-term, legit, buyer-hodlers entered into their Bitcoin positions, with local and immediate emotions and manias stripped out,” described Murad Madmudov and David Puell, analysts from Adaptive Capital.
By the numbers
Bitcoin's market capitalization is currently $230.5 billion while its realized market capitalization stands at $99.2 billion.

As said before, this means the total value of the Bitcoin network, based on actively circulating Bitcoin, is higher today than in any other point in history. Extrapolating from that, the price each holder paid for their Bitcoin is also nearing highs. This is more evident when using a derivative of realized market capitalization—realized price.

Based on this data, the average holder paid $5,180 for each of their BTC. Realized prices have yet to hit all-time highs due to the expanding Bitcoin supply since the 2017 bull market. From the market peak on Jan. 5, roughly 648,000 new Bitcoin have been introduced into circulation via mining—a 3.78 percent expansion to the coin supply.
Trading using realized market capitalization
Realized market capitalization and its derivatives can be used as a highly effective trading indicator, similar to NVT. As first theorized by Carter and several other analysts, historically, when used in conjunction with other data, realized market cap reliably predicted market bottoms and can be used to estimate market tops.
A strong indicator of market bottoms is when the current BTC price is lower than the realized BTC price (approximately the average price paid per coin).
BTC price (green), realized BTC price (red), bottom (black)
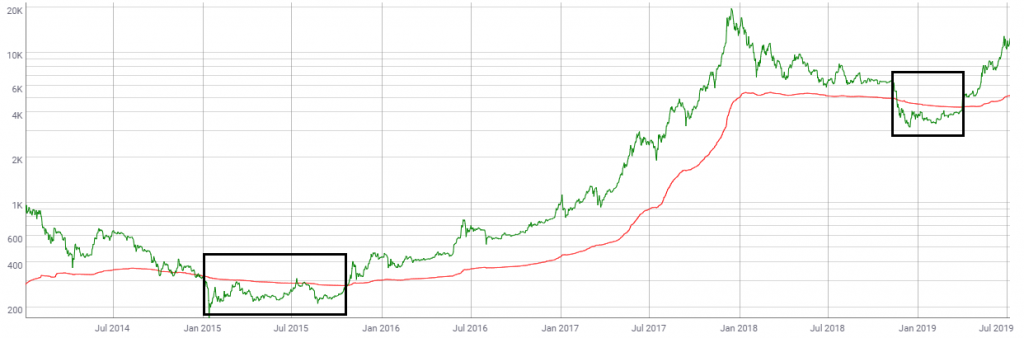
As first observed by Nic Carter:
It's kind of mind boggling how powerful Realized Cap is. The simplest trading strategy – buy when market cap goes below realized cap – gives you insanely good signals. Just… infrequently. https://t.co/kKbHv88xgj pic.twitter.com/3GCKXK2f6u
— nic carter (@nic__carter) June 19, 2019
Another more sophisticated indicator is an oscillator found by dividing market value by realized value—MVRV. Created by Murad Mahmudov and David Puell, the ratio historically identified when the market was overbought or oversold.
MVRV (red), BTC price (green), overbought (upper blue line), oversold (lower blue line)

According to Mahmudov and Puell, two historical thresholds emerge. When MVRV (red) rises above 3.7 (blue) it denotes overvaluation, and when it falls below 1.0 (blue) it denotes undervaluation.
MVRV, and realized market capitalization in general, embody a dichotomy in the crypto markets. As put by Mahmudov and Puell, it helps identify speculators versus hodlers, high time preference versus low time preference, and irrational exuberance versus uncertainty.
Realized market capitalization shows that investor’s confidence in the value of the Bitcoin network is growing—and will likely continue to do so. Furthermore, remaining aware of this indicator may help the savvy investor determine when the next phase of accumulation will begin.