 3 metrics to analyze GameFi projects: Here’s what to look for
 3 metrics to analyze GameFi projects: Here’s what to look for
What data can we use to determine the health and potential of new gaming projects?

Cover art/illustration via CryptoSlate. Image includes combined content which may include AI-generated content.
While the popularity of GameFi continues to grow, there are still relatively few genuinely fun games among the 1,322 in total.
In many cases, it’s not enough to assess the potential of a project just by looking at screenshots or walkthroughs, because the playability of a game is a subjective point.
Instead, investors and analysts should go beyond the surface and consider the data behind a game. Here are three key metrics to look at when evaluating the health and potential of a GameFi project.
1. Number of Users on the Protocol
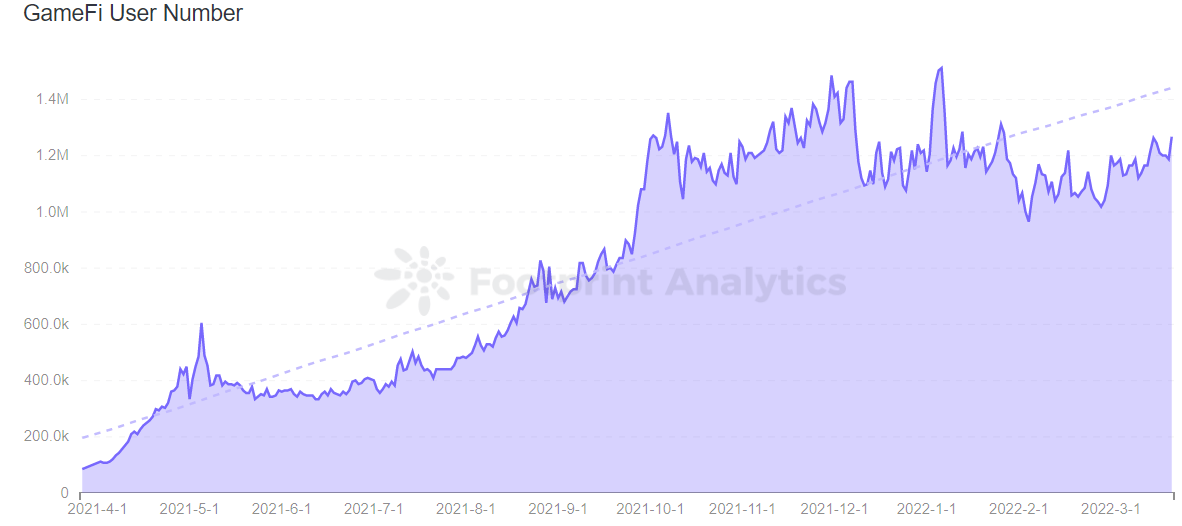
The number of users is the number of players in the GameFi program and is key to the healthy operation of the GameFi ecosystem. It also reflects the popularity of the game project among users.
According to Footprint Analytics data, the number of GameFi users has been on the rise since April 2021 and has reached a balance. This is highly correlated with the rapid growth of many projects and the ongoing development of the GameFi market.

The number of users on the chain shows that the public chains with more users in the last 3 months are mainly WAX, Hive, Polygon, and BSC.

Among them, Splinterlands, like the Hive chain, has about 300,000 daily users and accounts for more than 98% of the users on the Hive chain. Splinterlands is one of the more popular game projects recently, with its native token SPS priced at less than $0.1, lowering the threshold for players to participate in the game through its low issuance price.
There is also the WAX, which has been able to maintain a high number of users, which shows that the games in the WAX ecosystem are more sticky compared to other blockchains. And players can play Alien Worlds on its chain for free and earn $10 to $15 for a few hours of play.
Compare this to Axie Infinity on the Ronin chain, where the average number of daily users has dropped from 120,000 to about 20,000 over the last 6 months. The difference in this number is that most of the game users’ activities are carried out off-chain, and only transactions involving game props are settled on-chain. Therefore, the high gas fees for on-chain and inefficient on-chain transactions are the reasons for the decrease in its user base.
Across different successful projects, 3 things stand out:
- Need to be applicable to all crypto-users and have a low threshold, in addition to having game types that appeal to users.
- The Play to Earn model is also an important indicator of high user popularity.
- To have low gas fees and efficient capabilities.
If the project does not focus on the growth of the number of users, even if the content richness of the game project is gradually increasing, without users it will become worthless.
2. Transactions Per Capita
As GameFi demands more capabilities from the network than traditional gaming, protocols supporting these projects need cheaper gas fees and fast transactions. As a result, many blockchains are deploying dedicated chains specifically for gaming applications and improving capabilities to facilitate more project usage and user transactions.
According to Footprint Analytics, the number of transactions per capita on the WAX chain has been relatively stable since April 2021, at around 35 to 50 transactions per day, and WAX relies on projects such as Farmers World and Alien Worlds, which account for more than half of the transactions on the WAX.
In terms of capabilities, WAX not only supports high-frequency transactions but can also process up to 8,000 transactions per second, which is fast.
Notably, the average number of transactions on Avalanche has been increasing since January, reaching as high as 50 transactions on March 16. Originally occupying a major position in the DeFi field, with the popularity of GameFi, Avalanche gradually shifted to GameFi. For example, Crabada is a game where players can explore the kingdom of Crabada while earning income through mining, looting, breeding, combat, exploration, and crafting. It accounts for the majority of transactions.
Avalanche is an EVM-compatible L1 chain that focuses on speed and low transaction costs, achieving transaction throughput of over 4500 TPS and transaction termination times of less than 2 seconds. It aims to solve the scalability problems faced by Ethereum.

As you can see from the data, other blockchains such as Near and Moonriver are basically below 30 transactions per capita.
3. Transaction Volume Per Capita
Transaction volume per capita refers to the average amount of funds transferred per user. It is a crucial metric to analyze GameFi projects because it reflects the level of user engagement and the soundness of the product and tokenomics design. As an investor, you should look at the continued stability of a program’s per capita transaction volume trends, specifically looking for sustainable growth in user data and an increase in agreed revenue for gaming-based programs.
One of the more notable declines is OKExChain, which went from a high of $20,487 per capita in May 2021 to almost no volume after October.
The development of OKExChain chain games is relatively slow, and the popularity of the projects under planning is relatively low.

As of February, the Harmony, Ronin, and Ethereum blockchains are currently the main battlegrounds for GameFi’s per capita transaction volume, with most of the explosive chain tours on these chains ranging from $800 to $4,000 per capita.
To evaluate whether a GameFi project has potential, one should look at which protocol model it uses. If it uses a protocol model like the one on OKExChain, it is less likely to succeed because its chain ecosystem is slow to develop and no further plans are in place; if it uses a protocol model on Hive or WAX, it has more potential because it focuses on user experience and maintaining a good user growth rate.
Summary
The GameFi industry is in an early, highly volatile stage—making it easy to lose all of your money if you back the wrong horse. Therefore, it is crucial to look at underlying data when analyzing projects.
Date & Author: March 26 2022, Vincy
Data Source: Footprint Analytics – GameFi Data by Chain
This piece is contributed by the Footprint Analytics community.
The Footprint Community is a place where data and crypto enthusiasts worldwide help each other understand and gain insights about Web3, the metaverse, DeFi, GameFi, or any other area of the fledgling world of blockchain. Here you’ll find active, diverse voices supporting each other and driving the community forward.
What is Footprint Analytics?
Footprint Analytics is an all-in-one analysis platform to visualize blockchain data and discover insights. It cleans and integrates on-chain data so users of any experience level can quickly start researching tokens, projects, and protocols. With over a thousand dashboard templates plus a drag-and-drop interface, anyone can build their own customized charts in minutes. Uncover blockchain data and invest smarter with Footprint.


