 Why a trader says a Bitcoin bottom is close, based on a key technical structure
 Why a trader says a Bitcoin bottom is close, based on a key technical structure

Photo by André François McKenzie on Unsplash
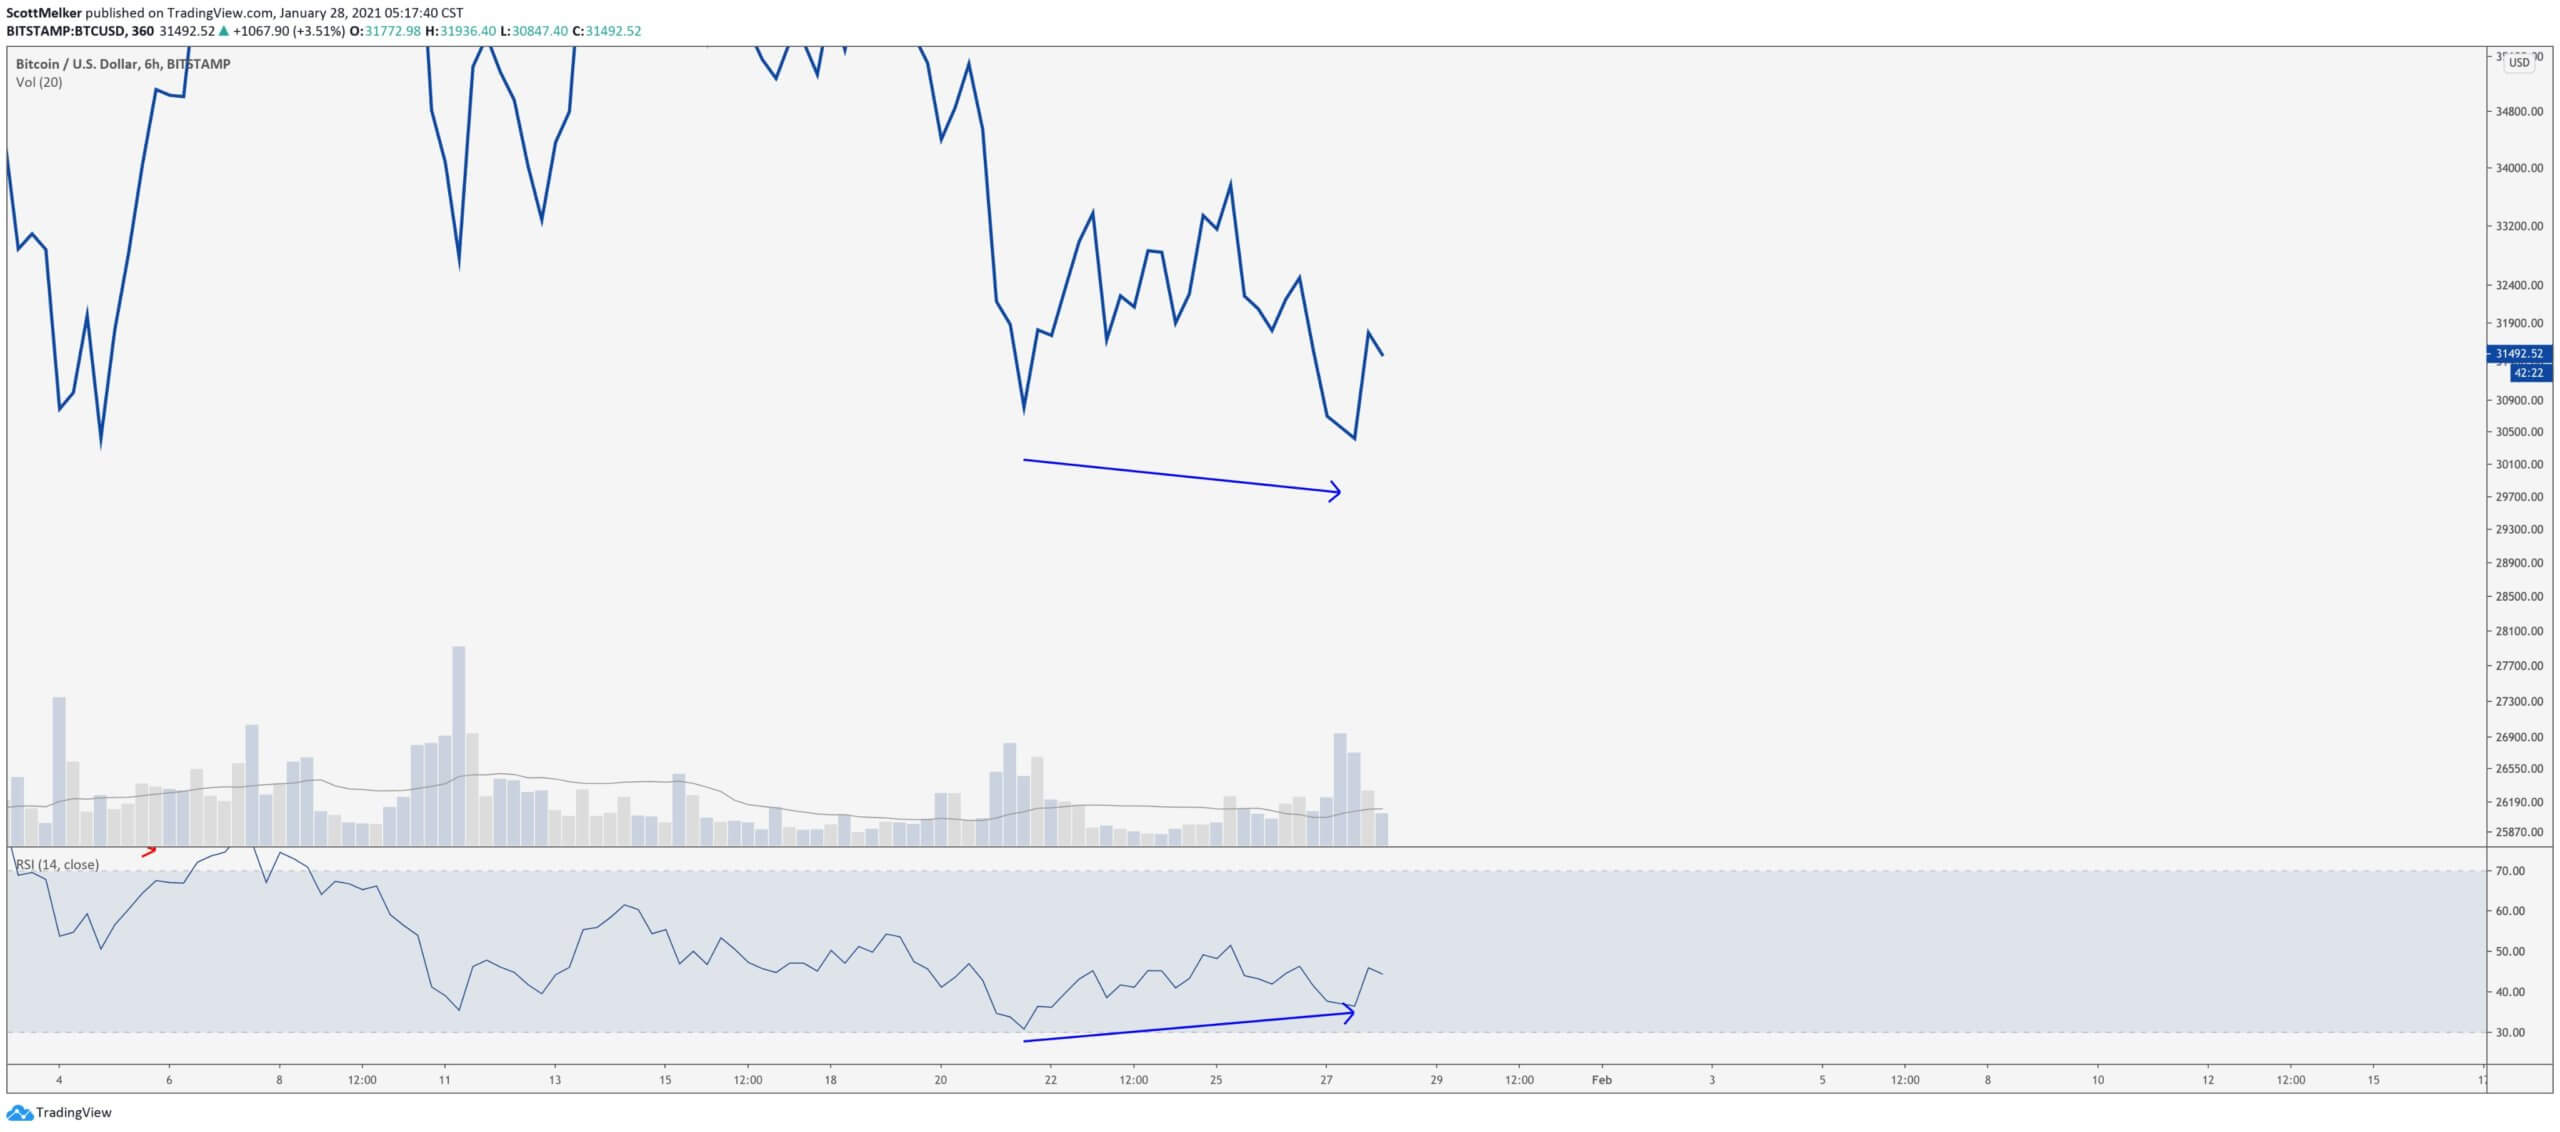
Scott Melker, a cryptocurrency trader and the author of The Wolf Den Newsletter, believes a short-term Bitcoin bottom is close.
Melker often uses the relative strength index (RSI) indicator on the 4-hour and 6-hour candle chart time frames to identify potential trend reversals.
The RSI is an indicator that is used to evaluate whether an asset is overbought or oversold. If the RSI is over 75, the asset is overbought, and if it is under 30, it is oversold.
Bitcoin not oversold, but the bottom is likely soon
Technically, Melker explained that Bitcoin is not yet oversold, at least on the 6-hour time frame.
But, a bullish divergence with the RSI has been confirmed, Melker said. The 12-hour candle chart would also soon confirm the same structure, which would be positive for BTC in the near term. He wrote:
“6 hour bull div with RSI confirmed. 12 hour likely to confirm in 40 minutes. We had iffy divs on lower time frames yesterday building to these. Neither reached oversold. Can still drop and make larger div, but bottom ‘should’ be in or close. Should.”

There are also fundamental reasons why a short-term Bitcoin relief rally could occur.
First, yesterday, on January 27, the premium of Bitcoin on Coinbase rose significantly, reaching $200 at one point.
Although the price of Bitcoin naturally trades slightly higher on Coinbase than usual, this indicates that high-net-worth investors were aggressively accumulating the dip.
This trend explains the swift trend reversal Bitcoin saw under $30,000, recovering to around $31,000 within several hours.
Whales are likely trying to defend the $30,000 support area from being broken, as breaking below $30,000 would result in a more complex correction.
What happens next?
A pseudonymous trader known as “Salsa Tekila” said the current price action reminds him of September 2020.
At the time, Bitcoin seemed to be breaking down, but a bullish engulfing daily candle caused a trend reversal, leading the BTC rally. He said:
“The $BTC price action observed yesterday reminds me of September 24, 2020. I was massively short that day, betting on a break-down. The sell-side got BTFO impulsively after dip buyers show up. Someone big had bought. I see similarities with the 30k vicinity. Could be wrong.”
In the foreseeable future, Bitcoin overtaking the $33,000 level is critical for a short-term resumption of the rally. Until BTC solidifies $33,000 as a support level once again, the trend remains neutral to bearish.
But one positive trend is that stablecoin deposits to exchanges are rising once again. This shows that sidelined capital is moving back into the Bitcoin market, which could result in a short-term catalyst for BTC.
The price of Bitcoin already rose from around $30,500 to over $31,500 as stablecoin deposits rose.
Bitcoin Market Data
At the time of press 5:21 pm UTC on Jan. 28, 2021, Bitcoin is ranked #1 by market cap and the price is up 5.53% over the past 24 hours. Bitcoin has a market capitalization of $604.69 billion with a 24-hour trading volume of $68.88 billion. Learn more about Bitcoin ›
Crypto Market Summary
At the time of press 5:21 pm UTC on Jan. 28, 2021, the total crypto market is valued at at $962.34 billion with a 24-hour volume of $136.35 billion. Bitcoin dominance is currently at 62.81%. Learn more about the crypto market ›


