Using Share of Trade Volume (SOTV) to assess DEXs
Analysis shows that one of the best ways to assess a Decentralized Exchange's market performance is by looking at its share of trade volume versus its market cap.

Cover art/illustration via CryptoSlate. Image includes combined content which may include the use of AI tools.
Decentralized exchanges (DEXs) are a core Web3 infrastructure with a proven use case. People will need a place to exchange tokens without intermediaries or centralized entities if they continue participating in the blockchain economy.
However, comparing the dozens of platforms for sustainability and potential is more challenging than making a case for the technology as a whole. It's unclear which ones will be around for several years.
For example, Uniswap has become a blue-chip institution in DeFi. But how can we compare the value of tokens of smaller DEXs, like TraderJoe and Biswap?
Since the most important metric for an exchange platform's health is that people are using it, this article will look at a metric that can be used alongside others to assess DEXes: Share of trade volume to market capitalization ratio, or SOTV/MC. This can be used to analyze DEXs' market performance.
What Is a DEX?
A DEX is a cryptocurrency trading platform that doesn't rely on third-party services for custody. All trades are completed directly on the blockchain through smart contracts and off-chain protocols. Unlike most centralized exchanges, which require users to provide personal information, DEXs enables users to remain anonymous while conducting trades. All other users can see is your wallet's “public address” — in the case of Ethereum, that is the 42-character hexadecimal address that starts with 0x.
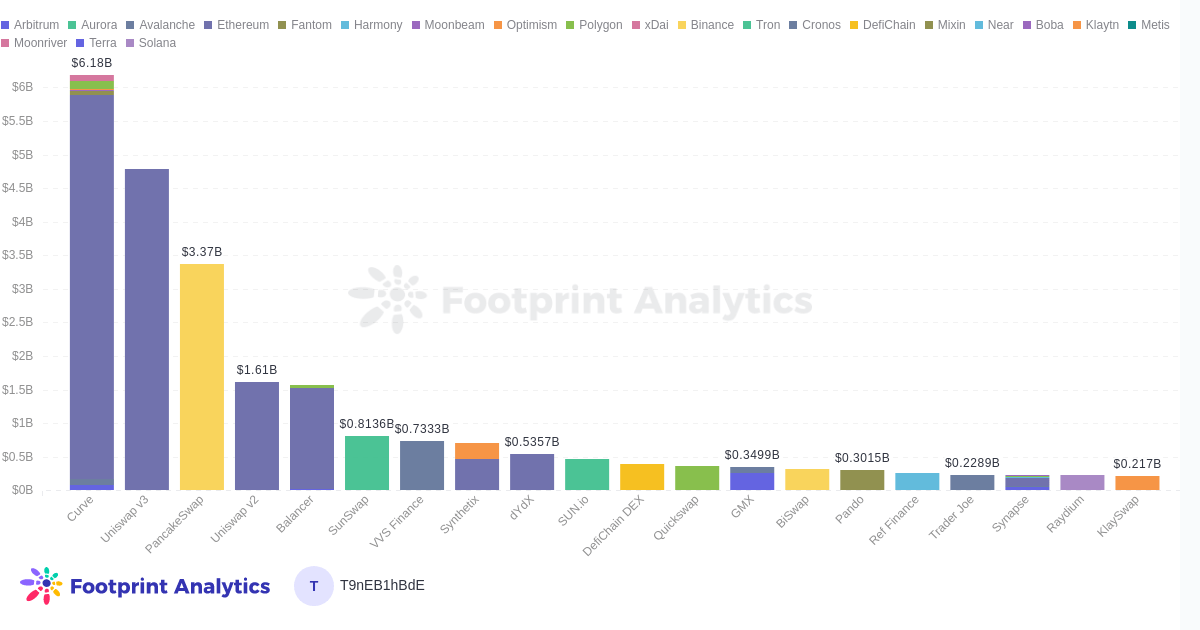
Top 20 DEXs and their TVL in Different Chains Why Does Market Cap Matter for DEXs?
Market cap is one of the most critical factors to look at when analyzing a cryptocurrency. The market cap is calculated by multiplying the circulating supply of the asset with its current price. For example, if 100,000 units of a particular crypto asset are valued at $1, its market cap would be $100,000.
Market cap tells us how big a cryptocurrency is relative to others in its industry and is often used as a benchmark of the popularity and desirability of the crypto asset.
A company with a high market cap can be considered more valuable than one with a low market cap — but that's not always the case. By comparing the market cap of a DEX with its usage (using SOTV as a proxy), we may be able to assess whether a protocol is over or undervalued. Or we may spot some other discrepancy, not widely known to market participants, pointing to a feature or bug.
As we calculate the market cap, it's important to remember that there are different types of DEX tokens and that their use cases have meaningful implications for users. For example, CAKE (PancakeSwap) is a general utility token with governance uses, whereas CRV (Curve) is entirely governance.
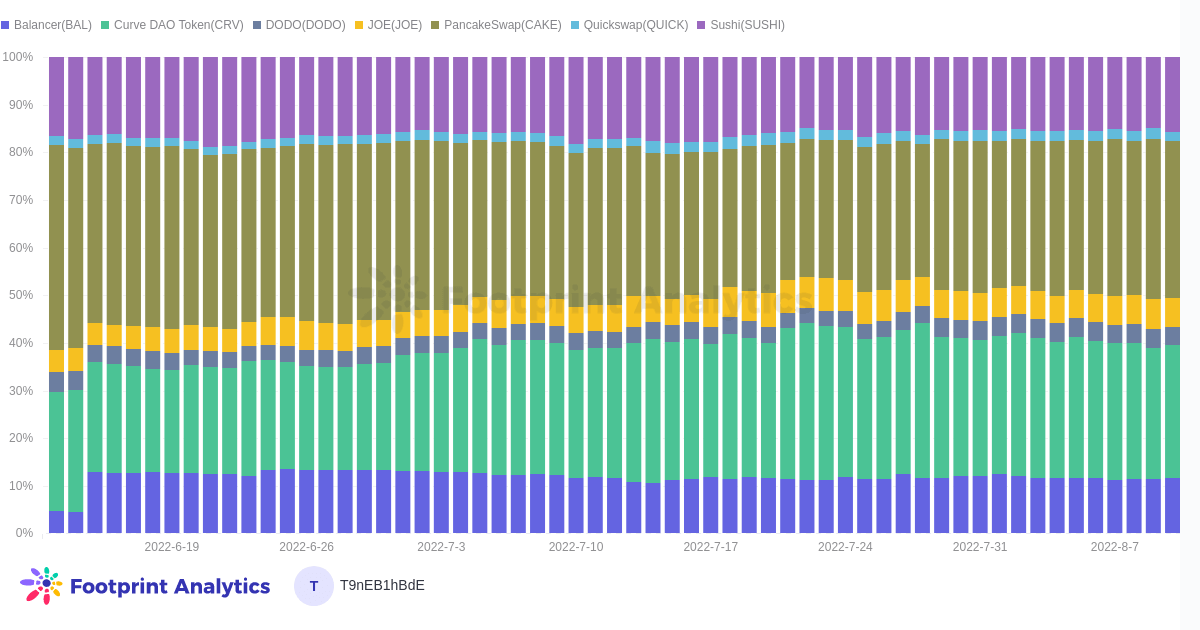

Basket of 7 DEXs and their share of market cap. What Is the Share of Trade Volume (SOTV) Metric?
We can calculate SOTV by dividing the total daily transaction volume on DEXs by the total daily transaction volume on all exchanges.
The SOTV gives us insight into how much activity happens within a given ecosystem and can serve as an indicator for the relative health of the ecosystem — and the prospects of its native token, if applicable.
By looking at SOTV/MC, we can also explore how the market prices in different tokenomics have significant implications for projects and developers. For example, we can compare 2 DEXs with similar ecosystems, features, and trading volumes but different supplies and token mechanics, to see if those differences affect the market cap and amount of speculative investment into those projects.
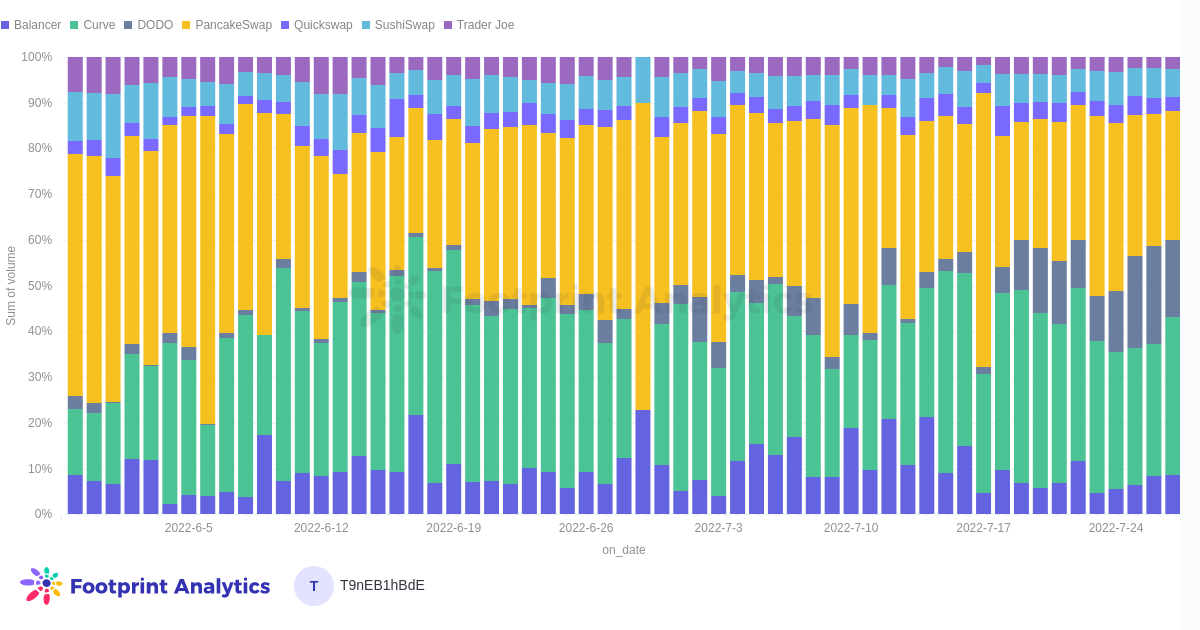
Basket of 7 DEXs and their share of the trading volume. Finding Hypotheses Based on SOTV/MC
SOTV/MC ratio is a contextual metric, i.e., it must be applied to the limited sample of protocols you plan to analyze together. That's because there is so much diversity among DEXs that casting too wide a net could lead to errant findings. Data out is only as good as data in.
In this batch, we analyzed 7 major DEXs besides Uniswap that have the standard suite of DEX features, as Uniswap is in a class of its own as a market leader. Such an outlier skews the data. We also removed Sunswap and VVS as they are entirely within their respective ecosystems. An example of another hypothetical batch that would make sense is “DEXs with futures trading”—dYdX, MCDEX, Perpetual Protocol, etc.
The higher the SOTV/MC, the more overvalued a DEX's market cap is relative to its trading volume.
For example, analyzing the two largest DEXs for one ecosystem: DEX A has a trading volume of $600 per day and a market cap of $400. DEX B only trades $400 per day but—for whatever reason—has a market cap of $600.
To calculate the SOTV/MC of DEX A, you divide the share of trading volume, 60, by the percentage of market cap, 40. The result is 1.5. For DEX B, you divide 40 by 60, getting 0.6. In theory, DEX A is undervalued, but it's important to remember that this metric only shows one small part of the story.
Here are some findings from running a SOTV/MC analysis on Balancer, Pancakeswap, Sushiswap, Curve, DODO, Quickswap, and TraderJoe. The entire dashboard can be found here.
Is CRV currently undervalued?
Curve SOTV/MC: 1.2
Pancakeswap SOTV/MC: 0.9
Curve and Pancakeswap are the two major DEXs after Uniswap. Even though Curve has nearly over 6% more SOTV than Pancakeswap, the market caps of CRV and CAKE are nearly neck-and-neck (though CRV is on an upward trajectory while CAKE is declining.) While their main use cases are vastly different, it can be argued that Curve's, i.e. facilitating stablecoin DeFi, is a safer bet than Pancakeswap's, i.e. the DEX of a Layer 1 with a vast number of low cap “memecoins” listed. However, CAKE has wider utility than CRV.
Is DODO a hidden gem?
DODO SOTV/MC: 4.5
DODO's SOTV is at 17% as of July 27 — making it the 3rd largest DEX in the group. However, its market cap is relatively miniscule, at 3.7%. For investors bullish on DEXs, DODO is a protocol worth looking into.
How valuable is branding for a DEX?
TraderJoe SOTV/MC: 0.4
Quickswap SOTV/MC: 1.3
Two new DEXs with similar SOTV are TraderJoe, at 2.7%, and Quickswap, at 3%. But whereas TraderJoe's market cap is 6.7% of the group, Quickswap is significantly lower at 2.2%. Immediately, TraderJoe's strong branding and marketing jump out as the only thing distinguishing it from Quickswap, which is quite similar to other DEXs in terms of appearance. Or, is the key takeaway that Quickswap has some seriously slept-on functionality that will allow it to grow in the future?
Conclusion
We believe it is important to track multiple metrics when analyzing the exchange landscape; SOTV/MC is one of those metrics.
Date: August 23, 2022
Author: James
Data source: www.footprint.network
What is Footprint Analytics?
Footprint Analytics is an all-in-one analysis platform to visualize blockchain data and discover insights. It cleans and integrates on-chain data so users of any experience level can quickly start researching tokens, projects, and protocols. With over a thousand dashboard templates plus a drag-and-drop interface, anyone can build their own customized charts in minutes. Uncover blockchain data and invest smarter with Footprint.