 These three narratives may help fuel an intense Ethereum upswing
 These three narratives may help fuel an intense Ethereum upswing

Cover art/illustration via CryptoSlate. Image includes combined content which may include AI-generated content.
Ethereum’s price is finally starting to show some signs of life as the cryptocurrency recovers from its recent lows.
Its ongoing upswing has outpaced that seen by Bitcoin and most other digital assets, being bolstered by its ability to break back above the lower boundary of its long-held trading range.
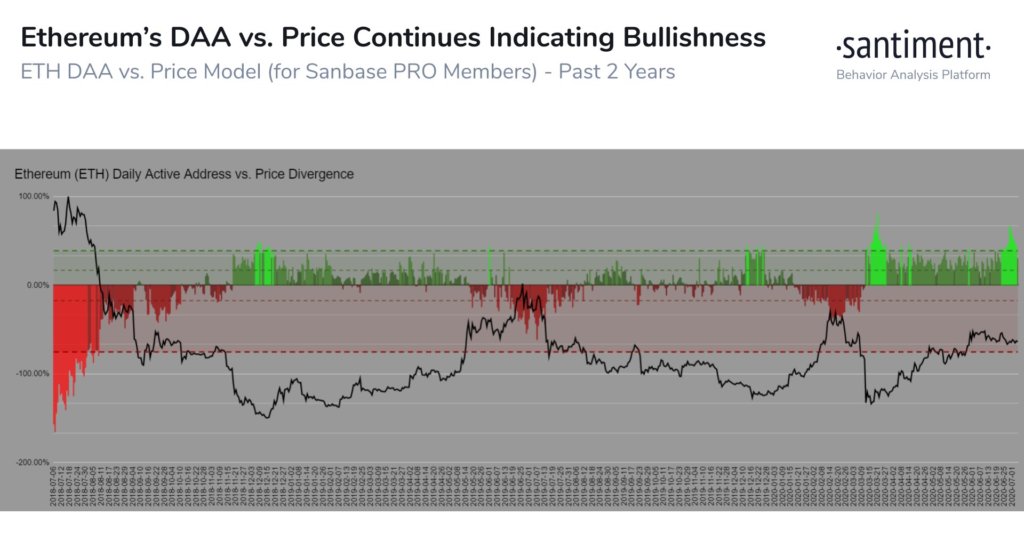
One reliable on-chain indicator that has a track record of forecasting when the cryptocurrency forms mid-term tops and bottoms is now flashing, signaling that its recent lows of $220 could ultimately mark a long-term low for ETH.
The imminent uptrend that this indicator is forecasting could be fueled by three key narratives that play into the favor of buyers.
Ethereum posts strong price movement as on-chain data points to further upside
Yesterday, Ethereum’s price saw a sharp, albeit fleeting, decline that sent it to lows of $222. This is the price at which buyers stepped up and reversed this downtrend.
The crypto is now trading well above these lows at its current price of $239 – marking an intense 6 percent rally from where it was trading at just 24 hours ago.
This rally has far exceeded that seen by Bitcoin, which is currently trading up just under 3 percent at its current price of $9,300.
ETH’s upswing may be driven partially by its ability to shatter the resistance that it had formed around $230.
Buyers may now attempt to push the token up towards the upper boundary of its trading range around $250, although the heavy resistance in this price region may be insurmountable.
One on-chain indicator that weights Ethereum’s daily active address count against the bullish divergences seen by its price seems to forecast further upside.
Santiment – the research platform responsible for making this indicator – explained that it is now signaling that a long-term ETH bottom is in.
“ETH has shown a major Daily Active Address vs. Price bullish divergence since 6/23. This [Santiment] model calculates when DAA is above its expected average 2-yr levels at current prices. Neon green has been a consistently reliable local bottom signal.”

Data Source: Santiment
These three narratives could help drive ETH higher
There are currently three bullish narratives working in Ethereum’s favor.
The first would be regarding the imminent transition to ETH 2.0 – which is anticipated to increase the blockchain’s scalability while also decentralizing the network via a Proof-of-Stake consensus model.
Another narrative that is being widely discussed by investors is regarding how the DeFi sector could help drive value to the cryptocurrency.
Ethereum Improvement Proposal (EIP) 1559, introduced in 2019, is essentially the “final component to the crypto’s economic system – according to ETH advocate David Hoffman – and is the third narrative source.
It helps solve the user experience flaws currently plaguing the blockchain’s gas management system and burns a significant amount of the ETH used to pay the transaction fees.
This adds a deflationary facet to Ethereum’s economic structure.
Ethereum Market Data
At the time of press 10:01 pm UTC on Jul. 7, 2020, Ethereum is ranked #2 by market cap and the price is up 0.01% over the past 24 hours. Ethereum has a market capitalization of $26.6 billion with a 24-hour trading volume of $6.75 billion. Learn more about Ethereum ›
Crypto Market Summary
At the time of press 10:01 pm UTC on Jul. 7, 2020, the total crypto market is valued at at $268.41 billion with a 24-hour volume of $59.23 billion. Bitcoin dominance is currently at 63.49%. Learn more about the crypto market ›


