Historical patterns in Bitcoin fees surface amid the halving countdown
Bitcoin's transaction fees dip and spike, mirroring pre-halving trends.
Quick Take
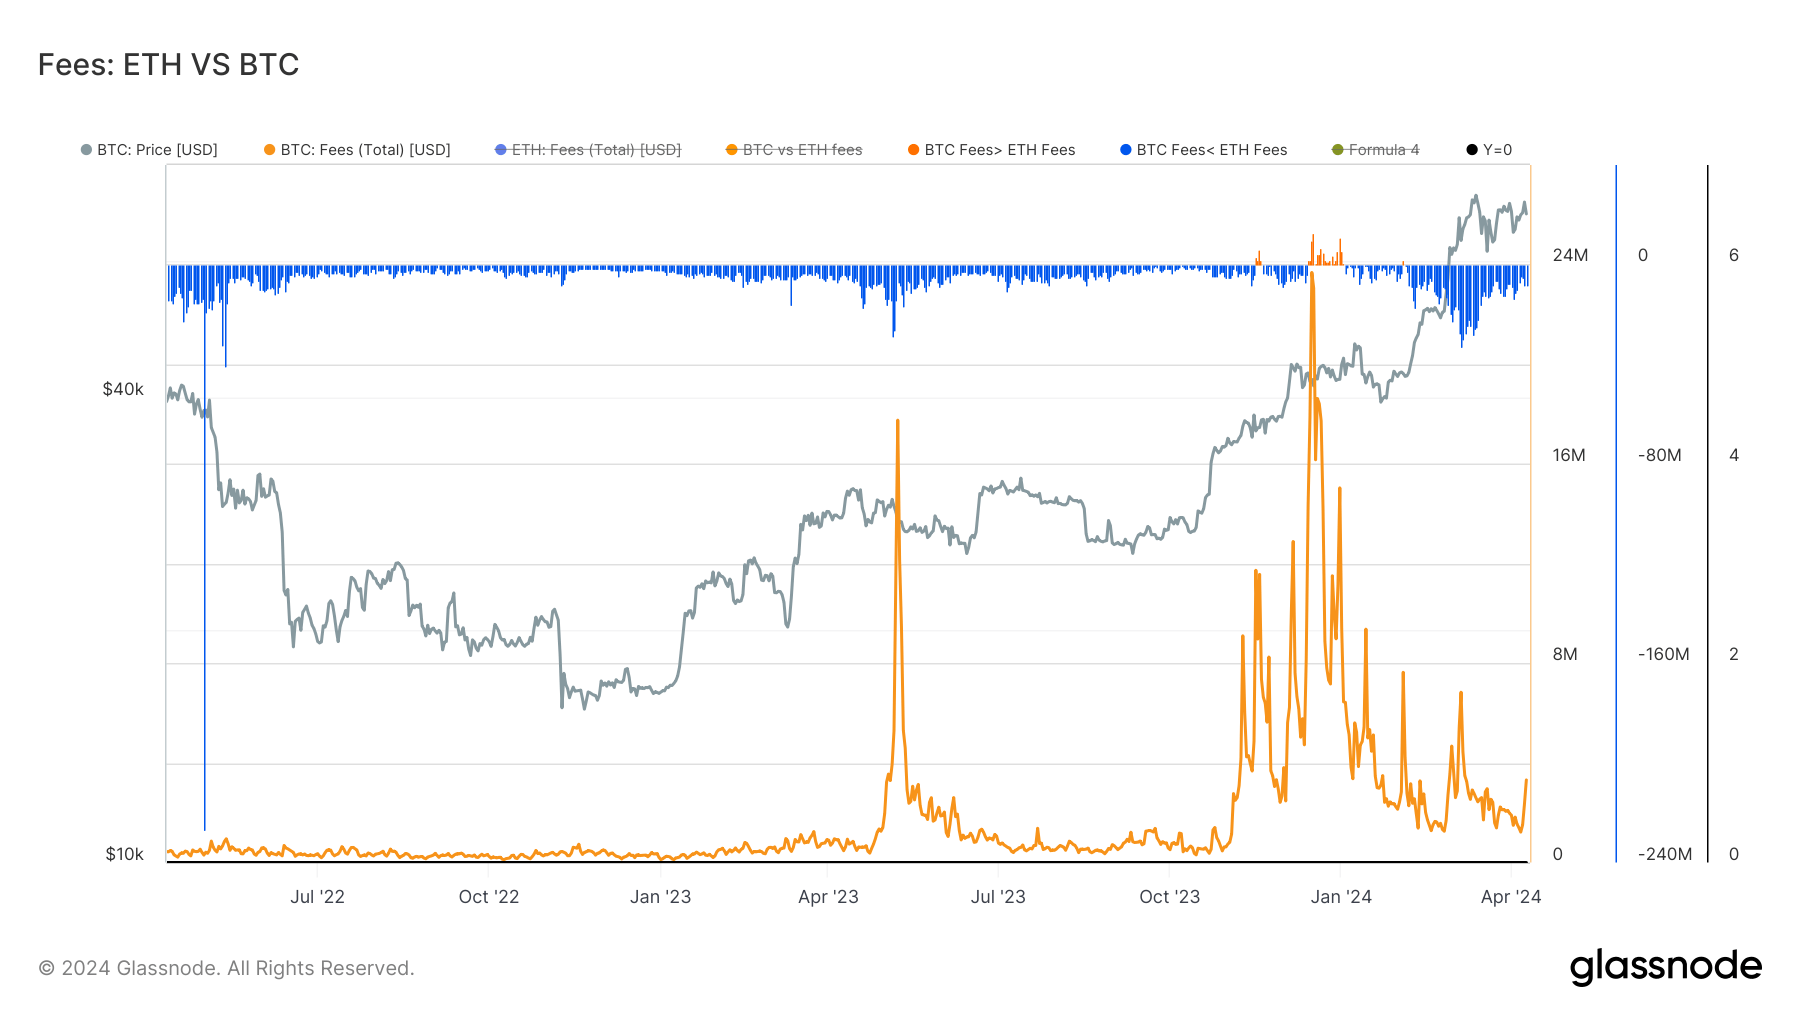
Data from Glassnode show that Bitcoin (BTC) transaction fees in 2024 have exhibited a general downward trend, but not without intermittent spikes. Contrasting with 2023, the average transaction fees in BTC have escalated, now settling between $1 million to $2 million per day, a marked increase from the previous year's $500k average. Notably, inscriptions, particularly prevalent from November through December 2023, fueled significant fee spikes, surpassing Ethereum fees for the last two weeks of December and briefly on Feb. 3. However, Ethereum has since retained its dominance.
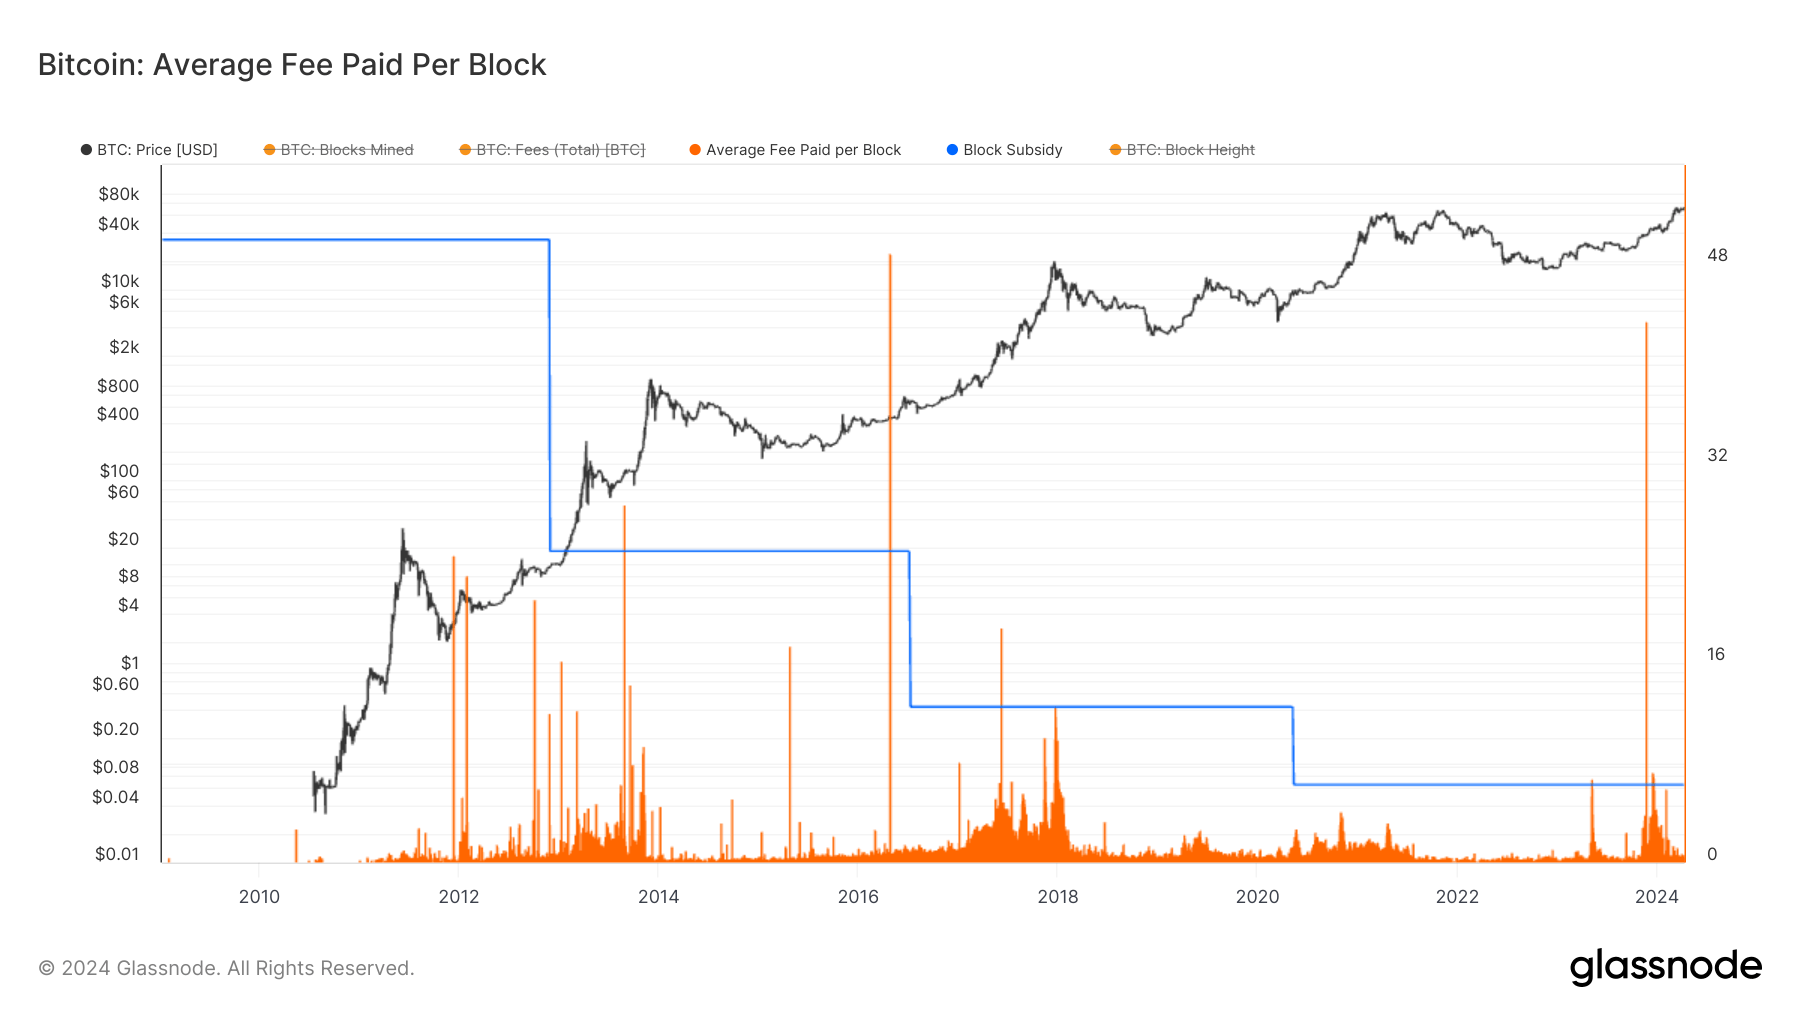
Presently, the average fee per block stands at approximately 0.40 BTC, remaining close to cycle lows, having recently risen from 0.10 BTC. This trend reflects patterns observed before previous halvings, characterized by low fees leading up to the event and a subsequent surge in fees during ensuing bull markets. Remarkably, throughout Bitcoin's history, including three occurrences in 2023, the average fee paid per block has exceeded the block subsidy six times, according to Glassnode.
As the halving approaches within 10 days, historical trends indicate that Bitcoin's post-halving surge could align with a resurgence in fees.