DEFINITION: The correlation between Bitcoin and gold over 30-day and 90-day periods measures the strength and direction of their price relationship.
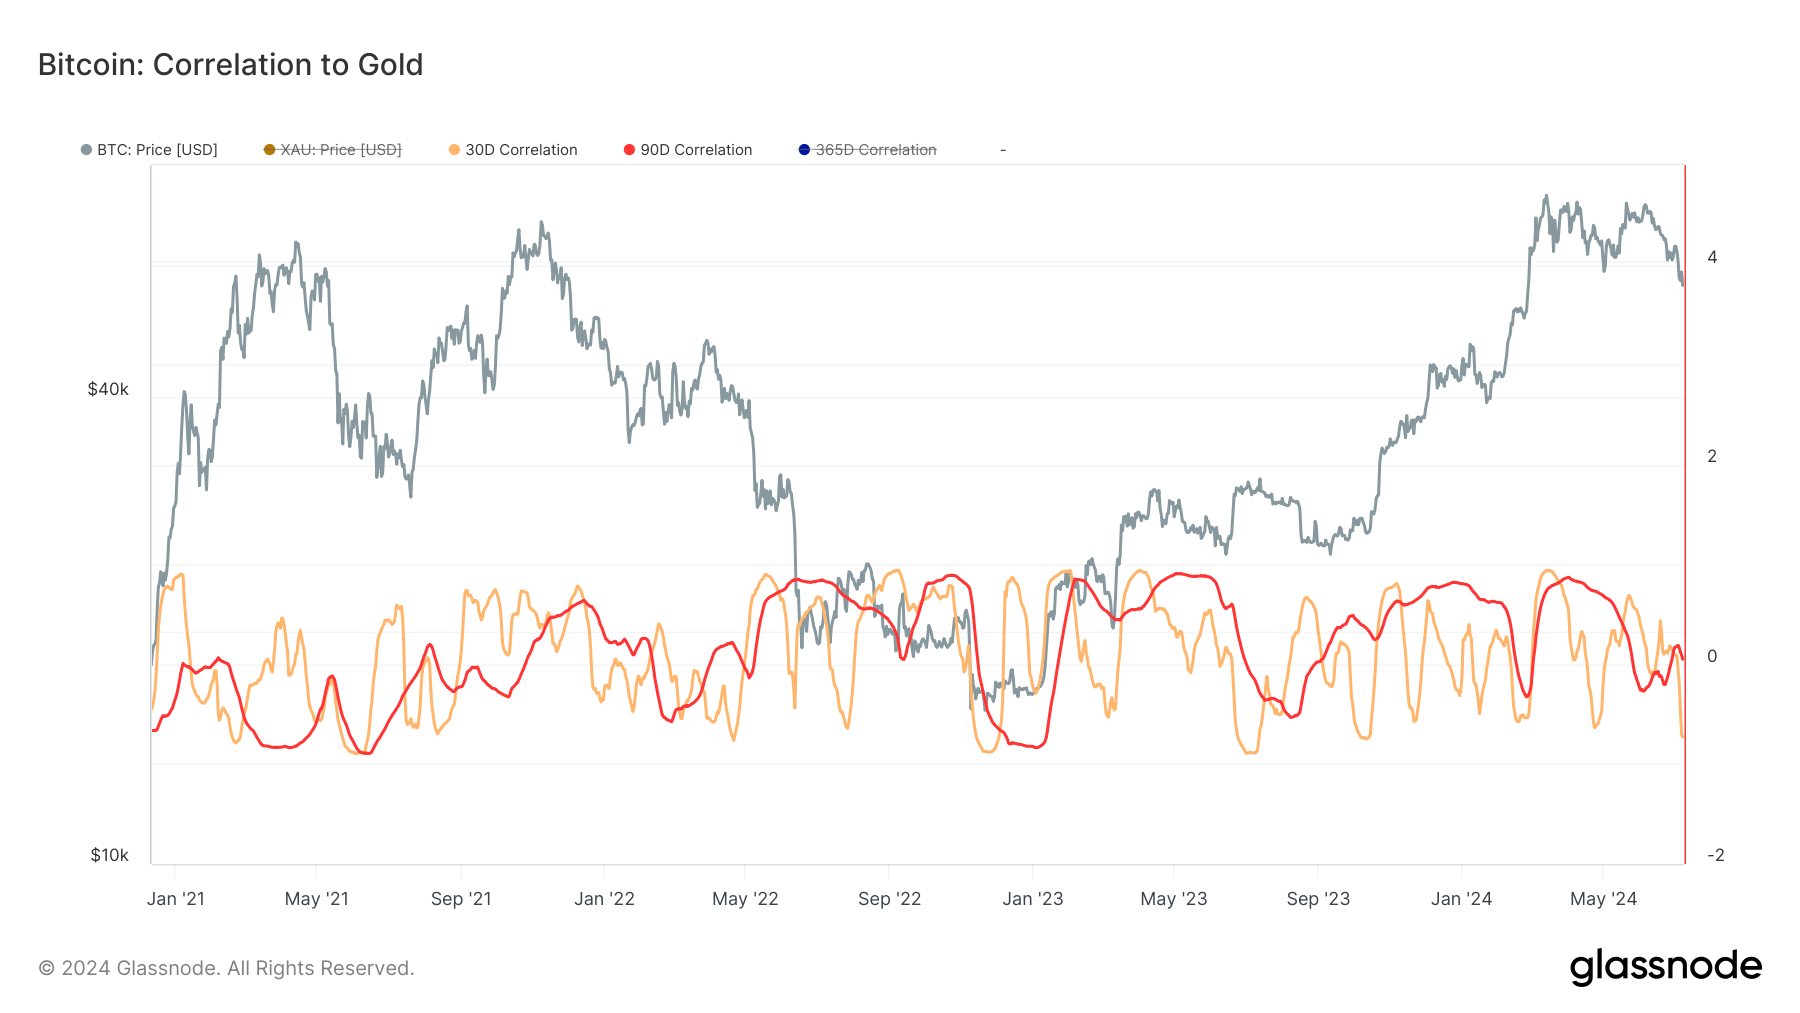
Bitcoin's correlation to gold has exhibited fluctuating trends over the past three years. The 30-day and 90-day correlation metrics show intermittent peaks and troughs, indicating varying degrees of correlation between Bitcoin and gold prices.
From January 2021 to mid-2024, Bitcoin's price saw significant movements, including a sharp rise to over $60,000 in late 2021, followed by a sharp decline into 2022 and subsequent recovery post-2023. During these periods, the 30-day and 90-day correlations often diverged, reflecting the flagship crypto's unique volatility compared to gold.
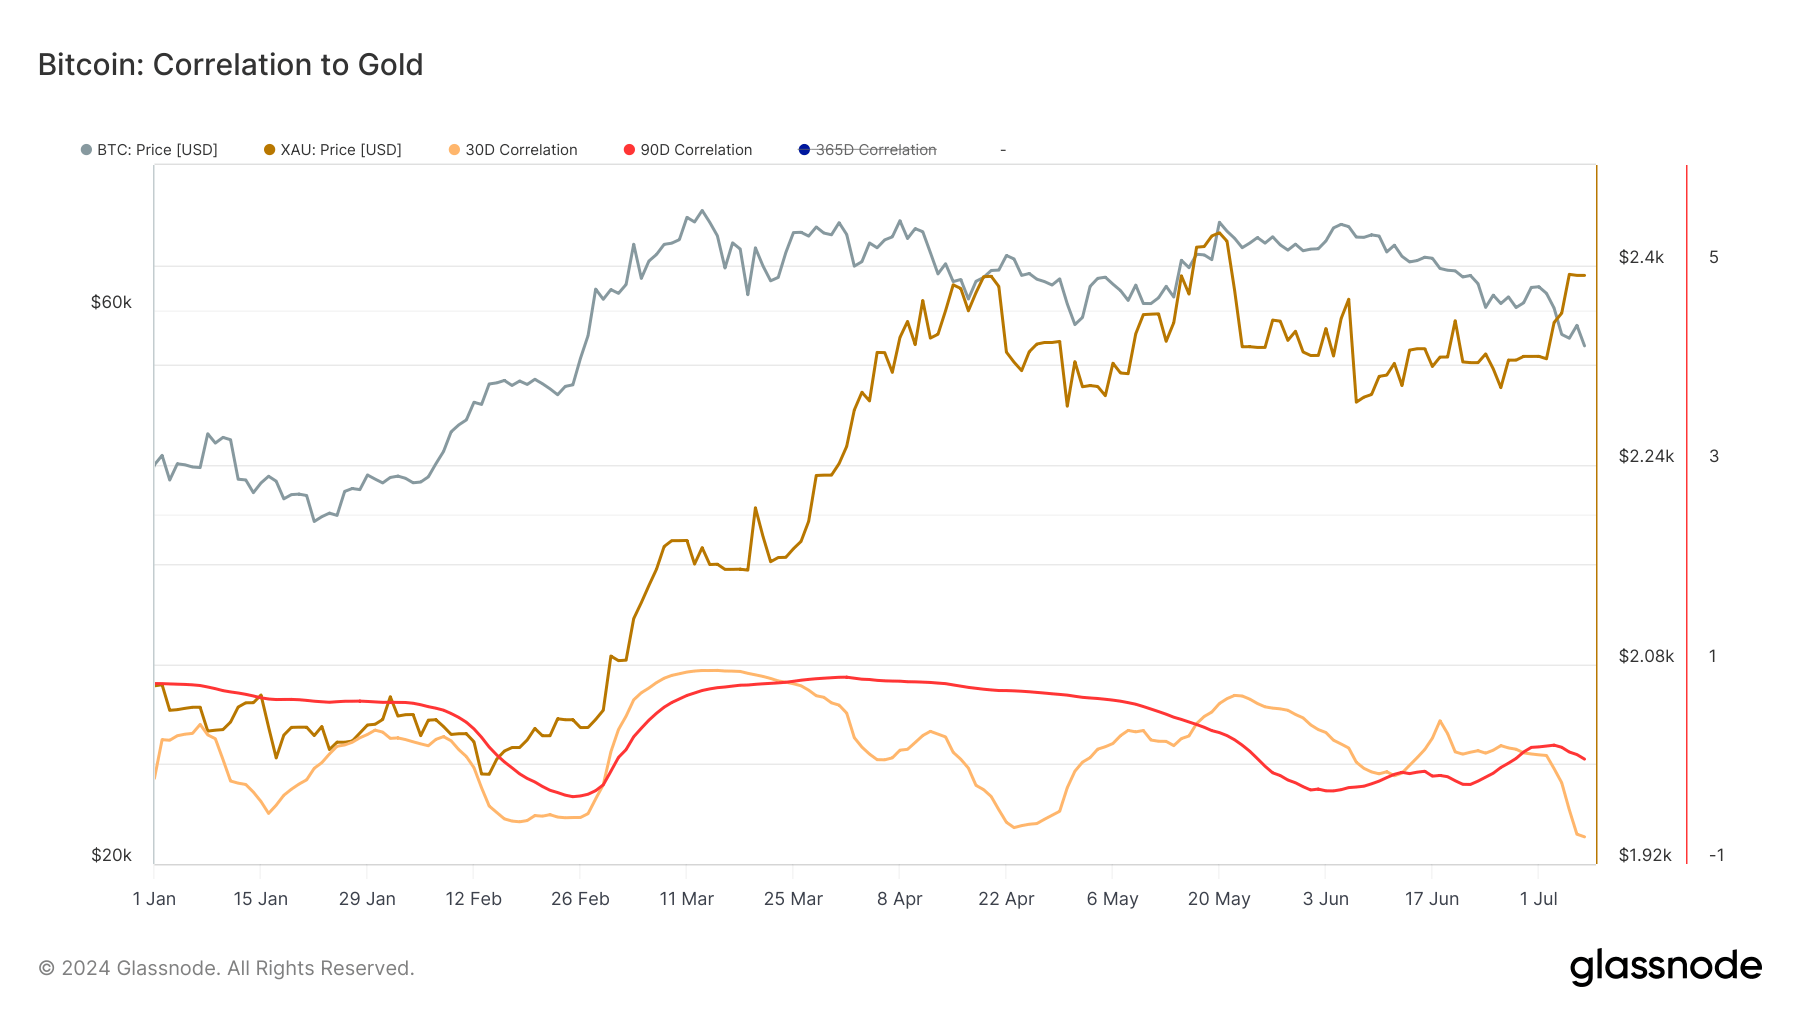
At the end of the first quarter of 2024, Bitcoin's correlation to gold exhibited a rising trend, with both the 30-day and 90-day correlations approaching one. This period coincides with Bitcoin reaching new heights pre-halving in March 2024, with gold following shortly after in May.
However, Bitcoin and gold have increasingly decoupled from one another over the past 30 days, similar to the recent trend observed between Bitcoin and the S&P 500. This raises the question of whether Bitcoin and gold will continue to diverge or eventually converge.